Out of the box distributed tracing for Node.js applications with OpenTracing. Support multiple Tracers.
WARNING: experimental library, do not use in production yet
Requirements
- Node.js, >= v8
npm install shimo-opentracing-auto// must be in the first two lines of your application
const Instrument = require('shimo-opentracing-auto')
const { Tracer } = require('opentracing') // or any OpenTracing compatible tracer like jaeger-client
const tracer1 = new Tracer()
const tracer2 = new Tracer()
const instrument = new Instrument({
tracers: [tracer1, tracer2]
})
// rest of your code
const express = require('express')
// ...This package depends on require-in-the-middle and shimmer to monkeypatch tracing information onto the modules listed below. Therefore it is crucial that you require() supported modules after creating the tracing instrument.
If you are using node 8.5+'s experimental module support, you will need to manually hook supported modules:
import Instrument from 'shimo-opentracing-auto';
import jaeger from 'jaeger-client';
import UDPSender from 'jaeger-client/dist/src/reporters/udp_sender';
import http from 'http';

const instrument = new Instrument({
  tracers: [
    new jaeger.Tracer(
      'my-service-name',
      new jaeger.RemoteReporter(new UDPSender.default({ host: 'my-jaeger-host' })),
      new jaeger.RateLimitingSampler(1),
      {}
    ),
  ],
});

instrument.hookModule(http, 'http');Instrument modules.
tracers: Array of OpenTracing compatible tracers- required
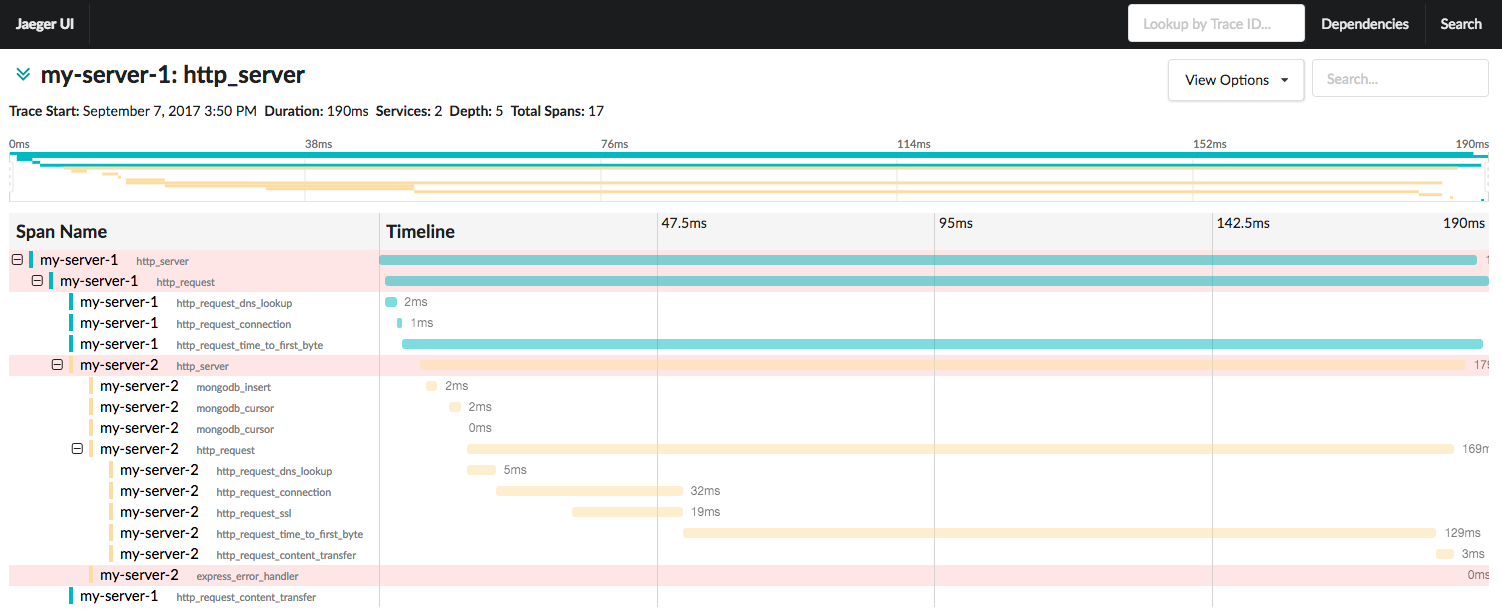
httpTimings: Adds HTTP timings (DNS lookup, Connect, TLS, Time to first byte, Content transfer)- default: false
Unpatch instrumentations
The example require a running MongoDB and Jaeger.
To start Jaeger and visit it's dashboard:
docker run -d -p5775:5775/udp -p6831:6831/udp -p6832:6832/udp -p5778:5778 -p16686:16686 -p14268:14268 jaegertracing/all-in-one:latest && open http://localhost:16686npm run example
curl http://localhost:3000
open http://localhost:16686You can enable it with the httpTimings: true
Start your application with the DEBUG=opentracing-auto* environment variable.
- More database instrumentation: Redis etc.
- More messaging layer instrumentation: HTTP/2, GRPC, RabbitMQ, Kafka etc.

