Graph visualization using D3.js
Reference Project: https://vsr.informatik.tu-chemnitz.de/projects/2020/atlas/
- Zoom (In, Out, Reset)
- Pan (Left, Right, Up, Down, Reset)
- Control Node distances
- Control Link width
- Localization on hover (Unidirectional and Bidirectional)
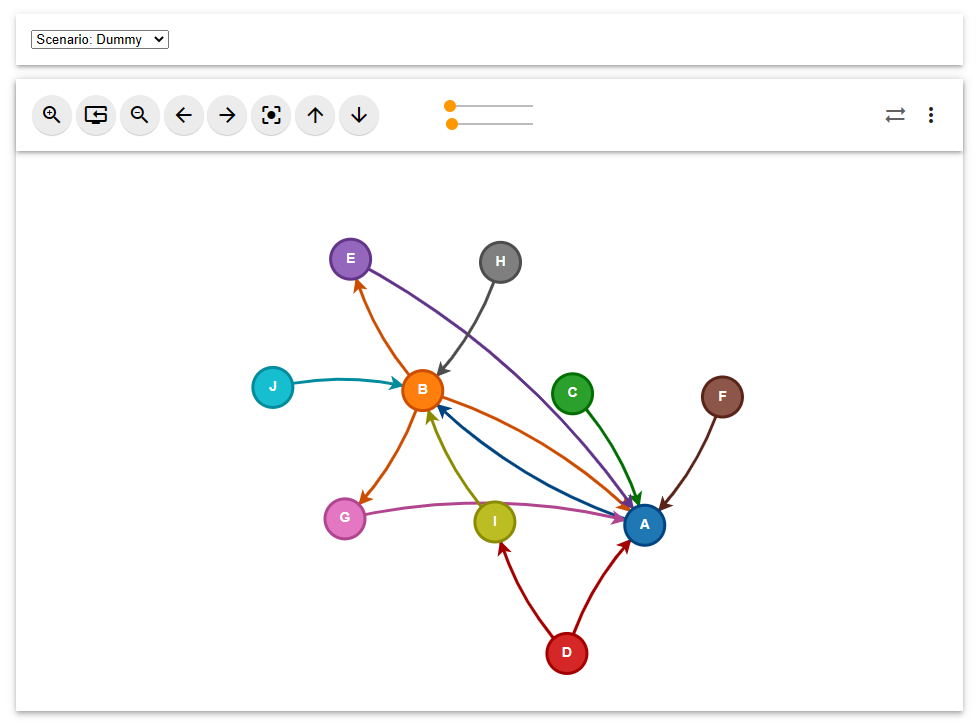
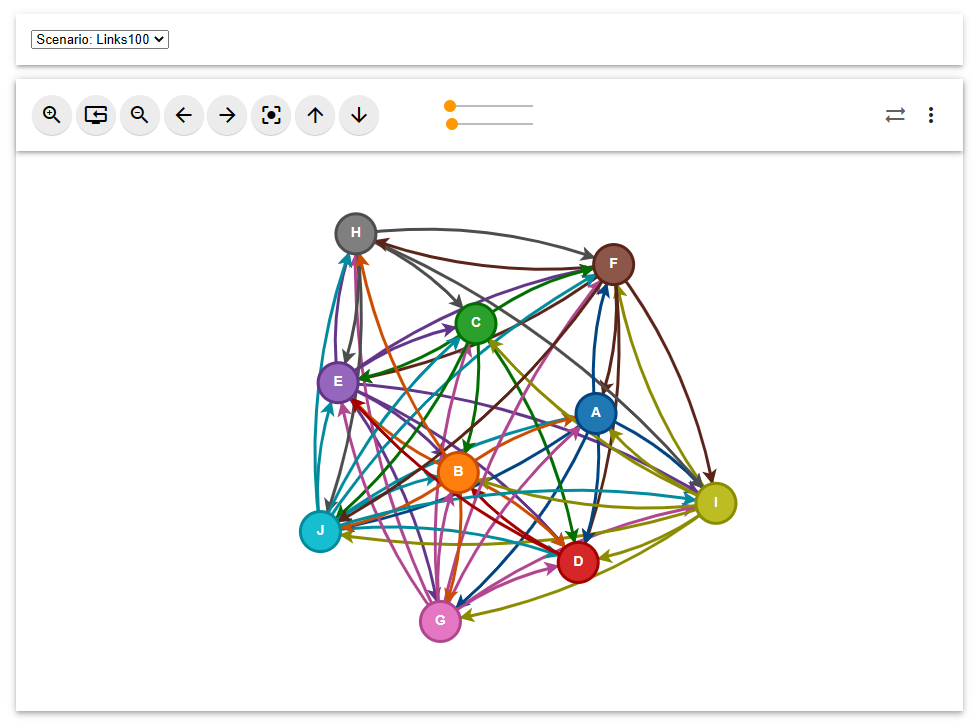
Simply open the graph.html with any browser. Use the combobox to switch between scenarios.
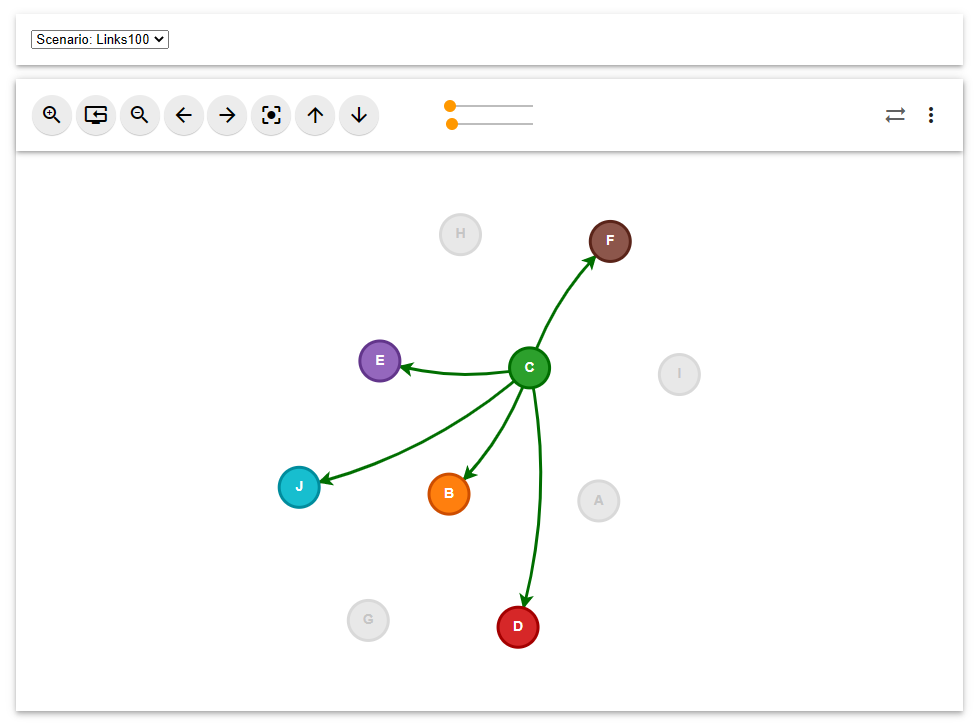
On hover displays only trusted agents

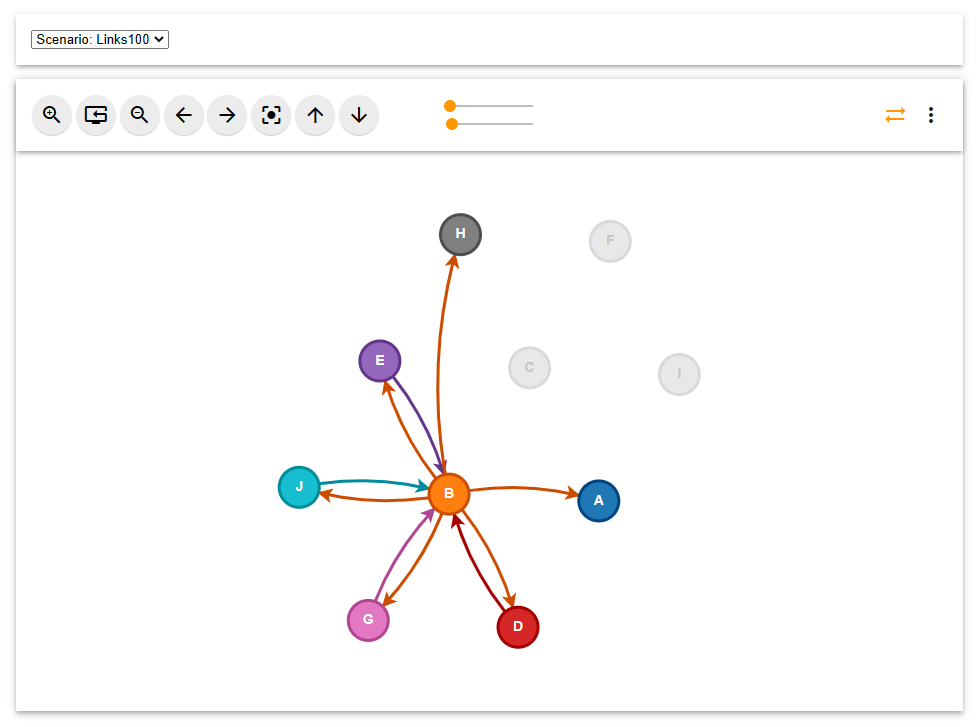
On hover with bidirectional switch enabled (top-right corner) displays trusted agents and the agents who trusts the hovered agent


