A mobile indoor air quality monitoring system for measuring humidity, temperature, volatile organic compounds, particulate matter and detecting concentration of various gases.
These instructions will get you a copy of the project up and running on your local machine. You will be able to access:
- Live Dashboard
- Webite
- Thingspeak channels for both the nodes
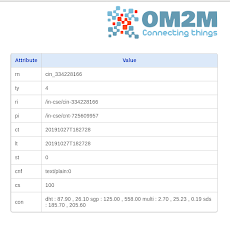
- OneM2M server containing data
You will need Python 3 to run the Flask application for the Live Dashboard, it can be installed on Ubuntu/Debian using the following command:
$ sudo apt-get install python3 python3-pipThe other requirements can be installed as follows:
$ cd Indoor-Air-Pollution-Monitoring-System
$ cd Live_Dashboard
$ sudo -H pip install -r requirements.txt
You will need Arduino 1.8.9 or above along with the appropriate libraries included for the sensors to flash the code onto the NodeMCU.
The following are the libraries included in the Arduino code for obtaining data from the node and sending it to the OneM2M server as well as Thingspeak.
//Libraries required for OneM2M communication
#include <JSONVar.h>
#include <Arduino_JSON.h>
#include <JSON.h>
#include <Wire.h>
#include <stdlib.h>

//Sensor Libraries
#include "Adafruit_SGP30.h"
#include "MutichannelGasSensor.h"
#include "SdsDustSensor.h"
#include "DHT.h"
#include "sgp30.h"
#include "sensirion_common.h"
#include <Adafruit_Sensor.h>
#include <SDS011.h>

//Libraries required for Thingspeak communication
#include <ThingSpeak.h>
#include <ESP8266HTTPClient.h>
#include <ESP8266WiFi.h>
#include <SoftwareSerial.h>
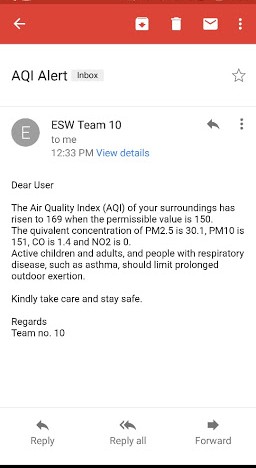
#include <Arduino.h>The Live Dashboard contains real-time data in the form of SI Unit vs Time graphsas well the calculated AQI.
The Flask application can be run with the following commands after cloning this reposirory.
$ cd Indoor-Air-Pollution-Monitoring-System
$ cd Live_Dashboard
$ sudo -H pip install -r requirements.txt
$ python3 run.py
This will start the server and and the user will see a line as follows:
Running on http://127.0.0.1:5000/ (Press CTRL+C to quit)Click on the HTTP link to acces the dashboard!
Add the format of the file to enter username of users of the Email Alert service here.
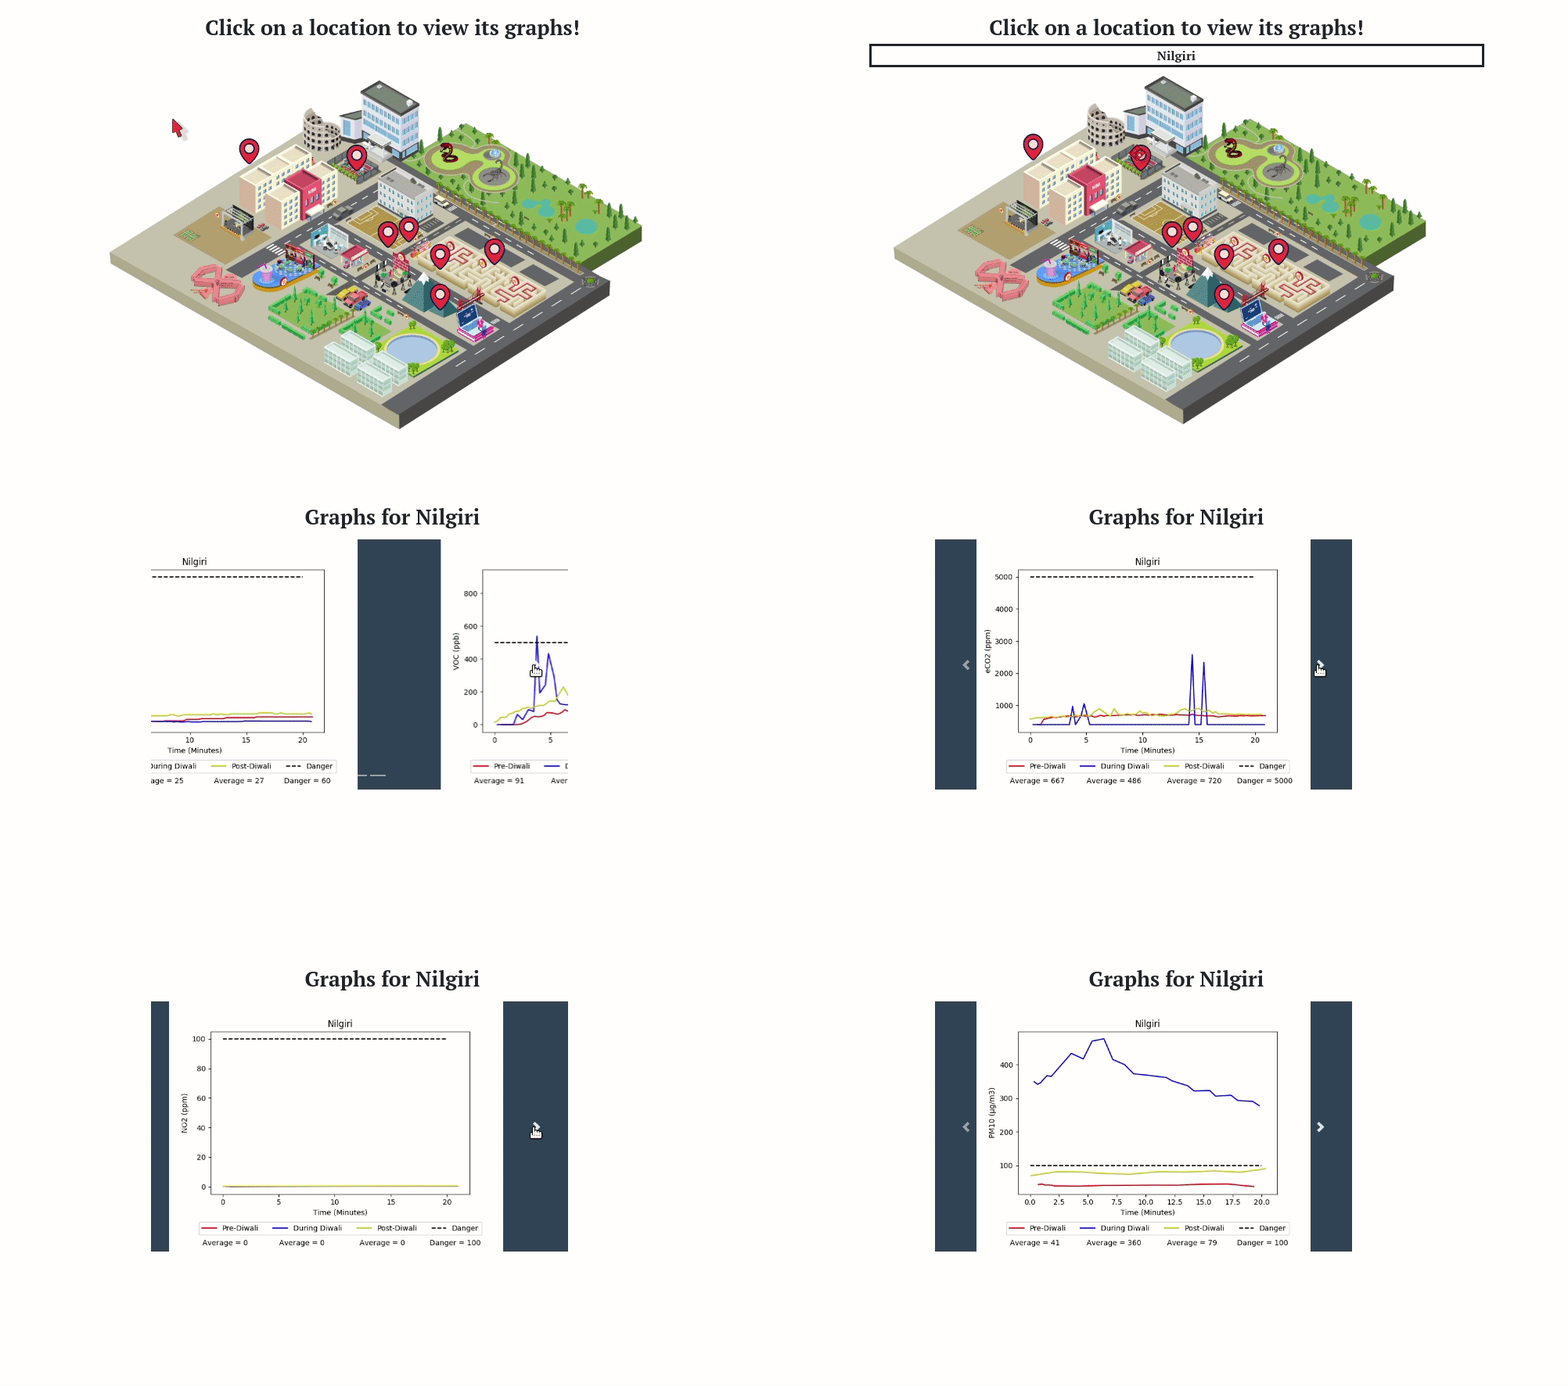
The Website contains a map of International Institute Of Information Technology, Hyderabad's campus and the graphs of data collected by the node at different indoor locations during three important time slots:
- Before Diwali Friday 7/10/2019
- During Diwali Saturday 8/10/2019
- After Diwali Sunday 9/10/2019
- Visit the homepage for Thingspeak
- Choose Channels from the nav bar at the top and search for the following channel numbers corresponding to sensors in the 2 nodes!
Channels for first node:
873276      //DHT Sensor
873290      //VoC and eCO2 Sensor
873271      //Nova PM Sensor
873290      //Grove Multichannel Gas Sensor
Chanel numbers for second node:
905895      //DHT Sensor
905904      //VoC and eCO2 Sensor
905893      //Nova PM Sensor
905902 //Grove Multichannel Gas SensorInsert method of setting up own server here when we figure out how to!
For now:
- Visit onem2m.iiit.ac.in/webpage
- Enter
adminas the username - Enter
adminas the password - Select Team 10 and click on the instances under the respective nodes to view the data collected.
- Scrape data from OneM2M directly instead of Thingspeak
- Improve the UI/UX of the Live Dashboard
@ainsley2000 @jyotisunkara @shradhasehgal


