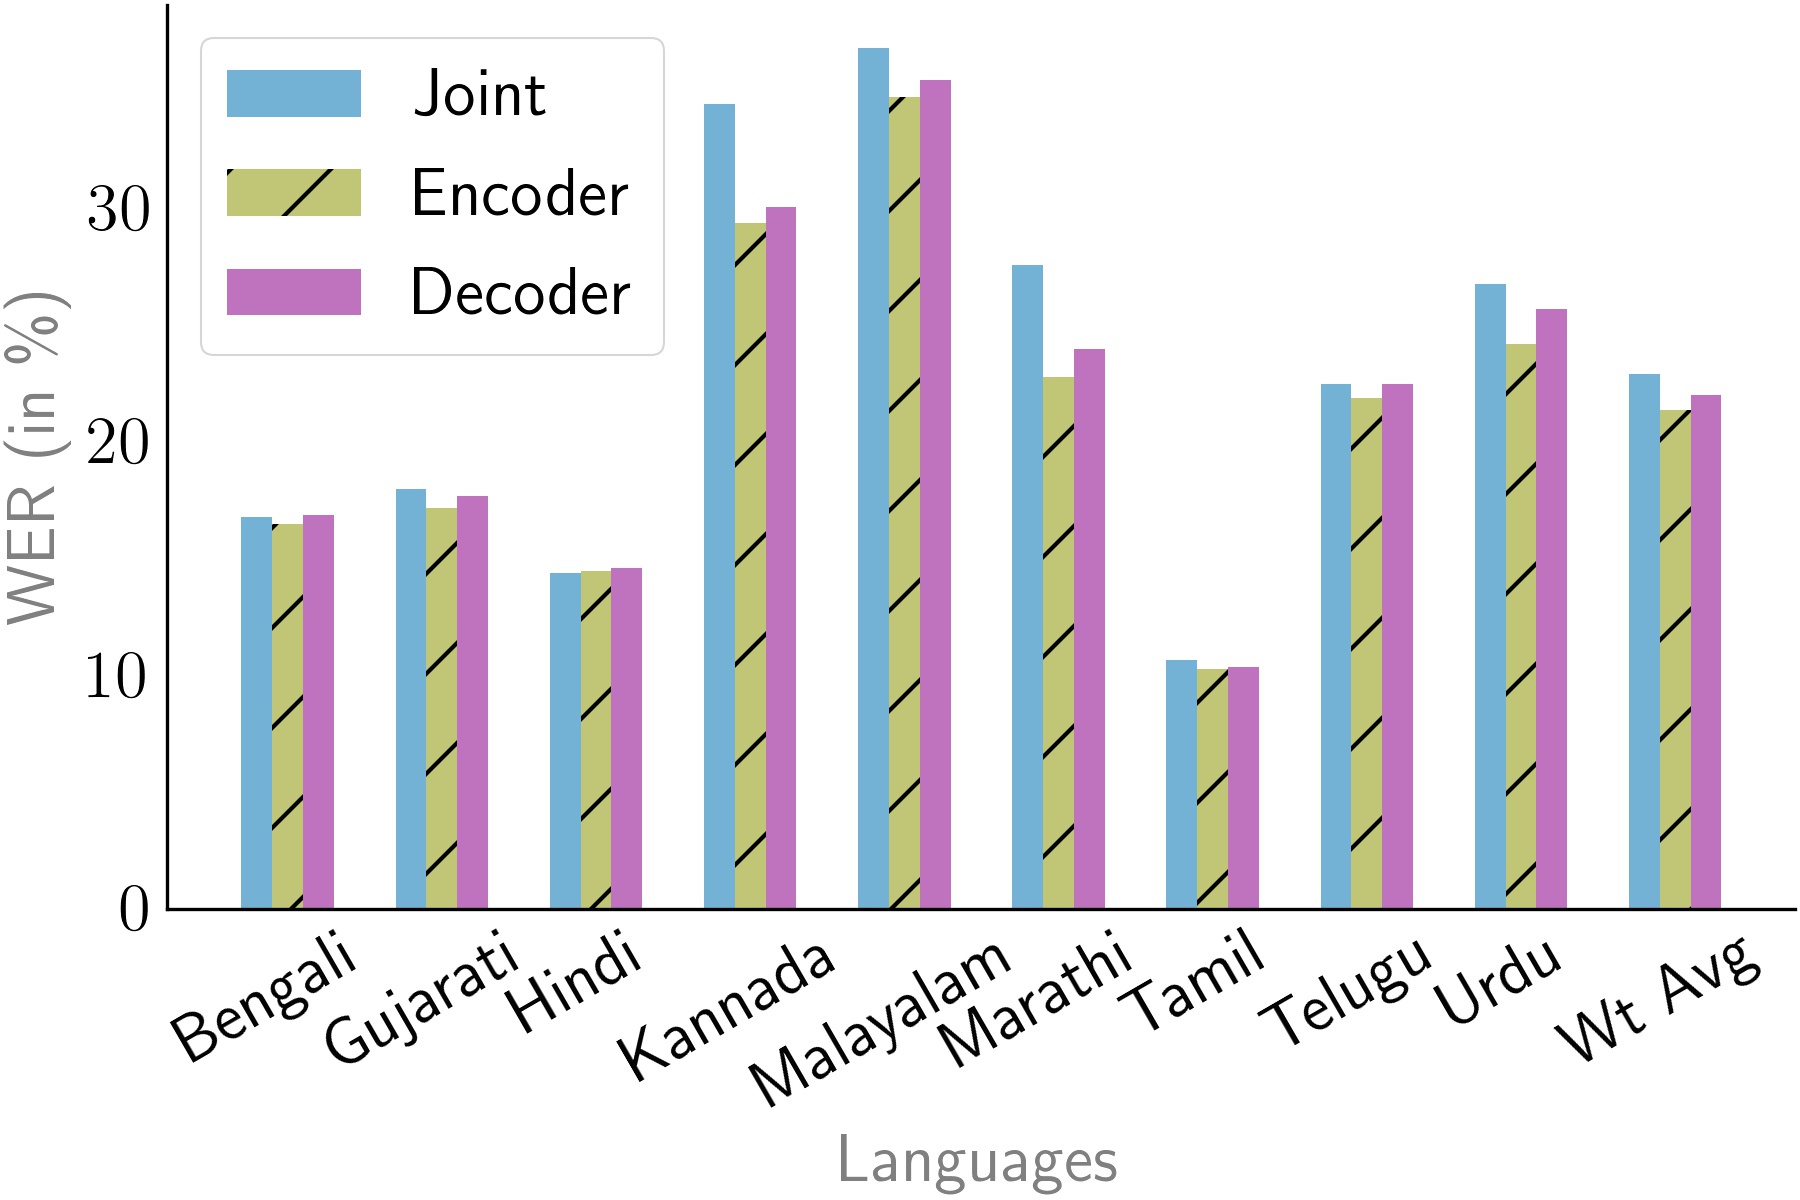
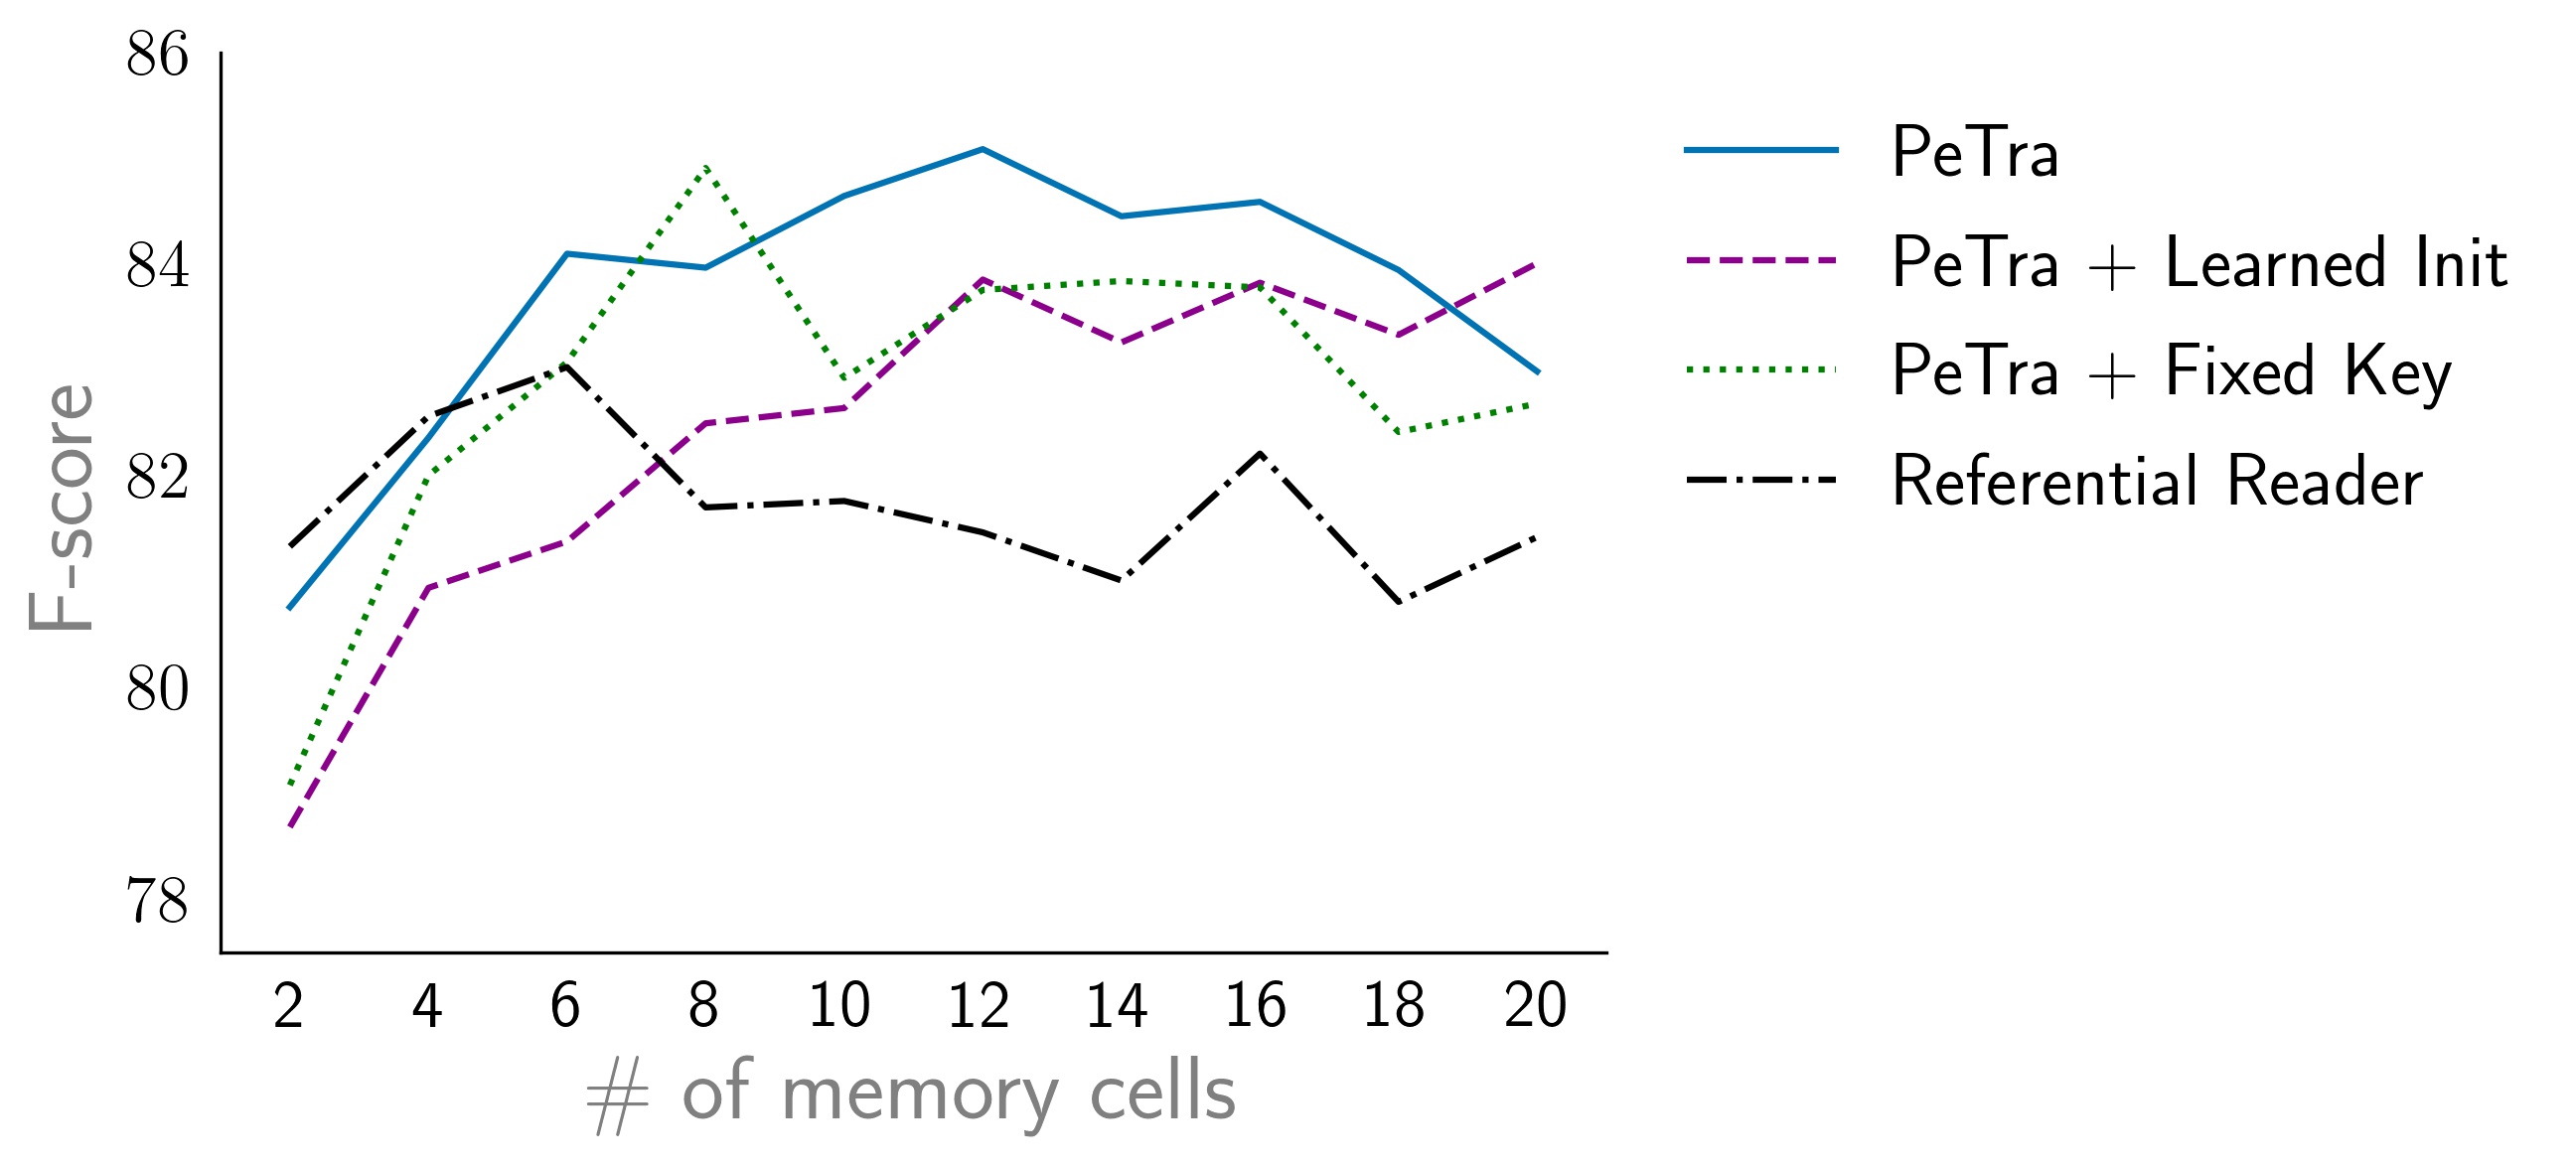
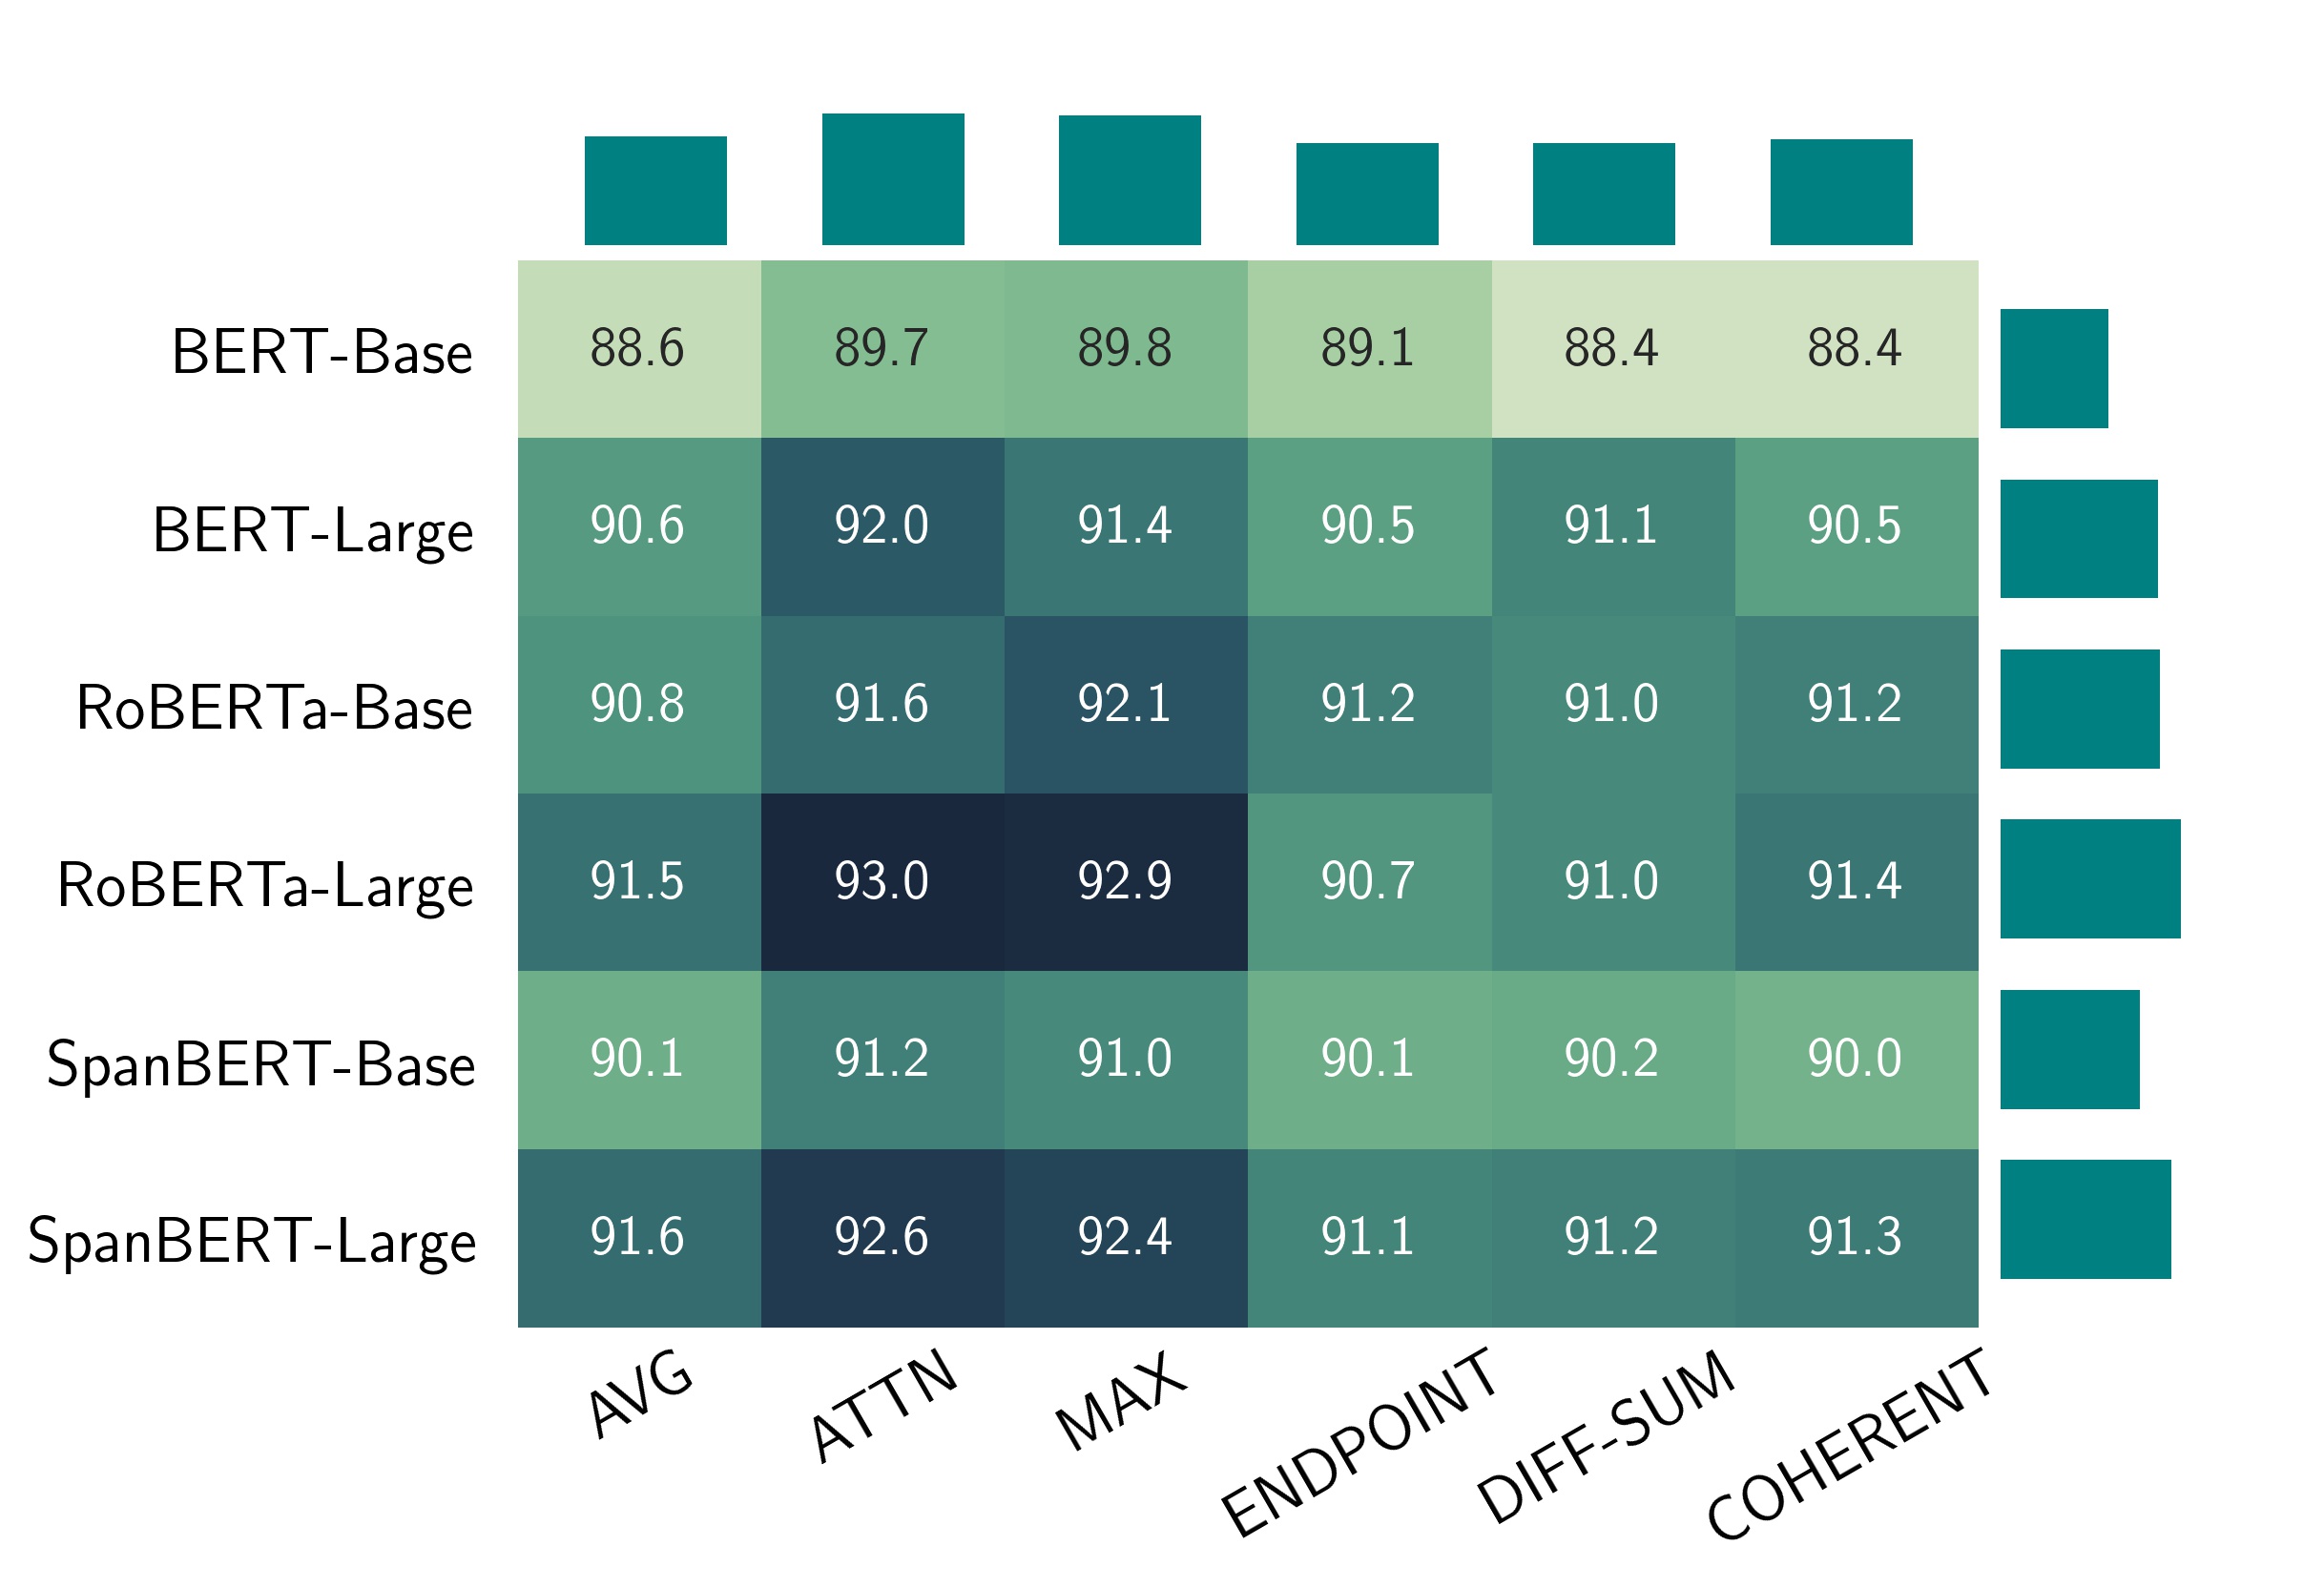
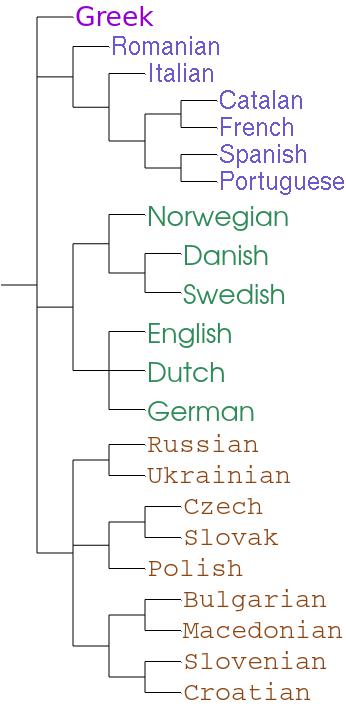
While it's not clear whether our world is simulated or real, one thing is for sure that those simulations are not done with matplotlib default settings.
The default settings are ugly to say the least. In this repository, I illustrate some of the settings I use for matplotlib. I also illustrate examples with other libraries such as Plotly and ETE. Some illustrative examples are shown below:
Following is the list of examples with brief descriptions and links to their separate notebooks:
- Bar Plots: A simple example illustrating drawing different bar plots with matplotlib.
- Line Plot: A simple line plot.
- Heatmap Plotly: Plotly is a powerful library and in this example I illustrate a rather complicated heatmap which is relatively easy with Plotly.
- Subplots Matplotlib: Example demonstrating subplots with matplotlib. This is one of the more complicated plots I have made till now.


