
Grafana dashboards for AWS CloudWatch
Set of AWS Grafana dashboards published on grafana.com - 10M+ downloads.
Doc:
Feel free to create pull request for additional AWS resources/printscreens/...
Please set your dashboard variables (Region, ...) after dashboard import.
Empty dashboard variables are reason of initial "Unable to call AWS API" or "Metric request error" error.
Import all Monitoring Artist AWS dashboards in one go (example script,
bash/curl/jq required):
#!/bin/bash
jq --version >/dev/null 2>&1 || { echo >&2 "I require jq but it's not installed.  Aborting."; exit 1; }
### Please edit grafana_* variables to match your Grafana setup:
grafana_host="http://localhost:3000"
grafana_cred="admin:admin"
# Keep grafana_folder empty for adding the dashboards in "General" folder
grafana_folder="AWS CloudWatch"
ds=(1516 677 139 674 590 659 758 623 617 551 653 969 650 644 607 593 707 575 1519 581 584 2969 8050 11099 11154 11155 12979 13018 13040 13104 13892);
folderId=$(curl -s -k -u "$grafana_cred" $grafana_host/api/folders | jq -r --arg grafana_folder  "$grafana_folder" '.[] | select(.title==$grafana_folder).id')
if [ -z "$folderId" ] ; then echo "Didn't get folderId" ; else echo "Got folderId $folderId" ; fi
for d in "${ds[@]}"; do
  echo -n "Processing $d: "
  j=$(curl -s -k -u "$grafana_cred" $grafana_host/api/gnet/dashboards/$d | jq .json)
  payload="{\"dashboard\":$j,\"overwrite\":true"
  if [ ! -z "$folderId" ] ; then payload="${payload}, \"folderId\": $folderId }";  else payload="${payload} }" ; fi
  curl -s -k -u "$grafana_cred" -XPOST -H "Accept: application/json" \
    -H "Content-Type: application/json" \
    -d "$payload" \
    $grafana_host/api/dashboards/import; echo ""
done
Use AWS Policy Generator, which fits your needs. Example of minimal IAM role for Grafana (CloudWatch + EC2 metrics):
{
    "Version": "2012-10-17",
    "Statement": [
        {
            "Sid": "AllowReadingMetricsFromCloudWatch",
            "Effect": "Allow",
            "Action": [
                "cloudwatch:DescribeAlarmsForMetric",
                "cloudwatch:DescribeAlarmHistory",
                "cloudwatch:DescribeAlarms",
                "cloudwatch:ListMetrics",
                "cloudwatch:GetMetricStatistics",
                "cloudwatch:GetMetricData"
            ],
            "Resource": "*"
        },
        {
            "Sid": "AllowReadingTagsInstancesRegionsFromEC2",
            "Effect": "Allow",
            "Action": [
                "ec2:DescribeTags",
                "ec2:DescribeInstances",
                "ec2:DescribeRegions"
            ],
            "Resource": "*"
        },
        {
            "Sid": "AllowReadingResourcesForTags",
            "Effect" : "Allow",
            "Action" : "tag:GetResources",
            "Resource" : "*"
        }
    ]
}
You can also install this project as a Jsonnet library with jsonnet-bundler:
$ jb install github.com/monitoringartist/grafana-aws-cloudwatch-dashboards
$ cat > aws-cloudwatch-dashboards.jsonnet <<EOF
local awsCloudWatch = import 'github.com/monitoringartist/grafana-aws-cloudwatch-dashboards/dashboards.libsonnet';
awsCloudWatch.grafanaDashboards
EOF
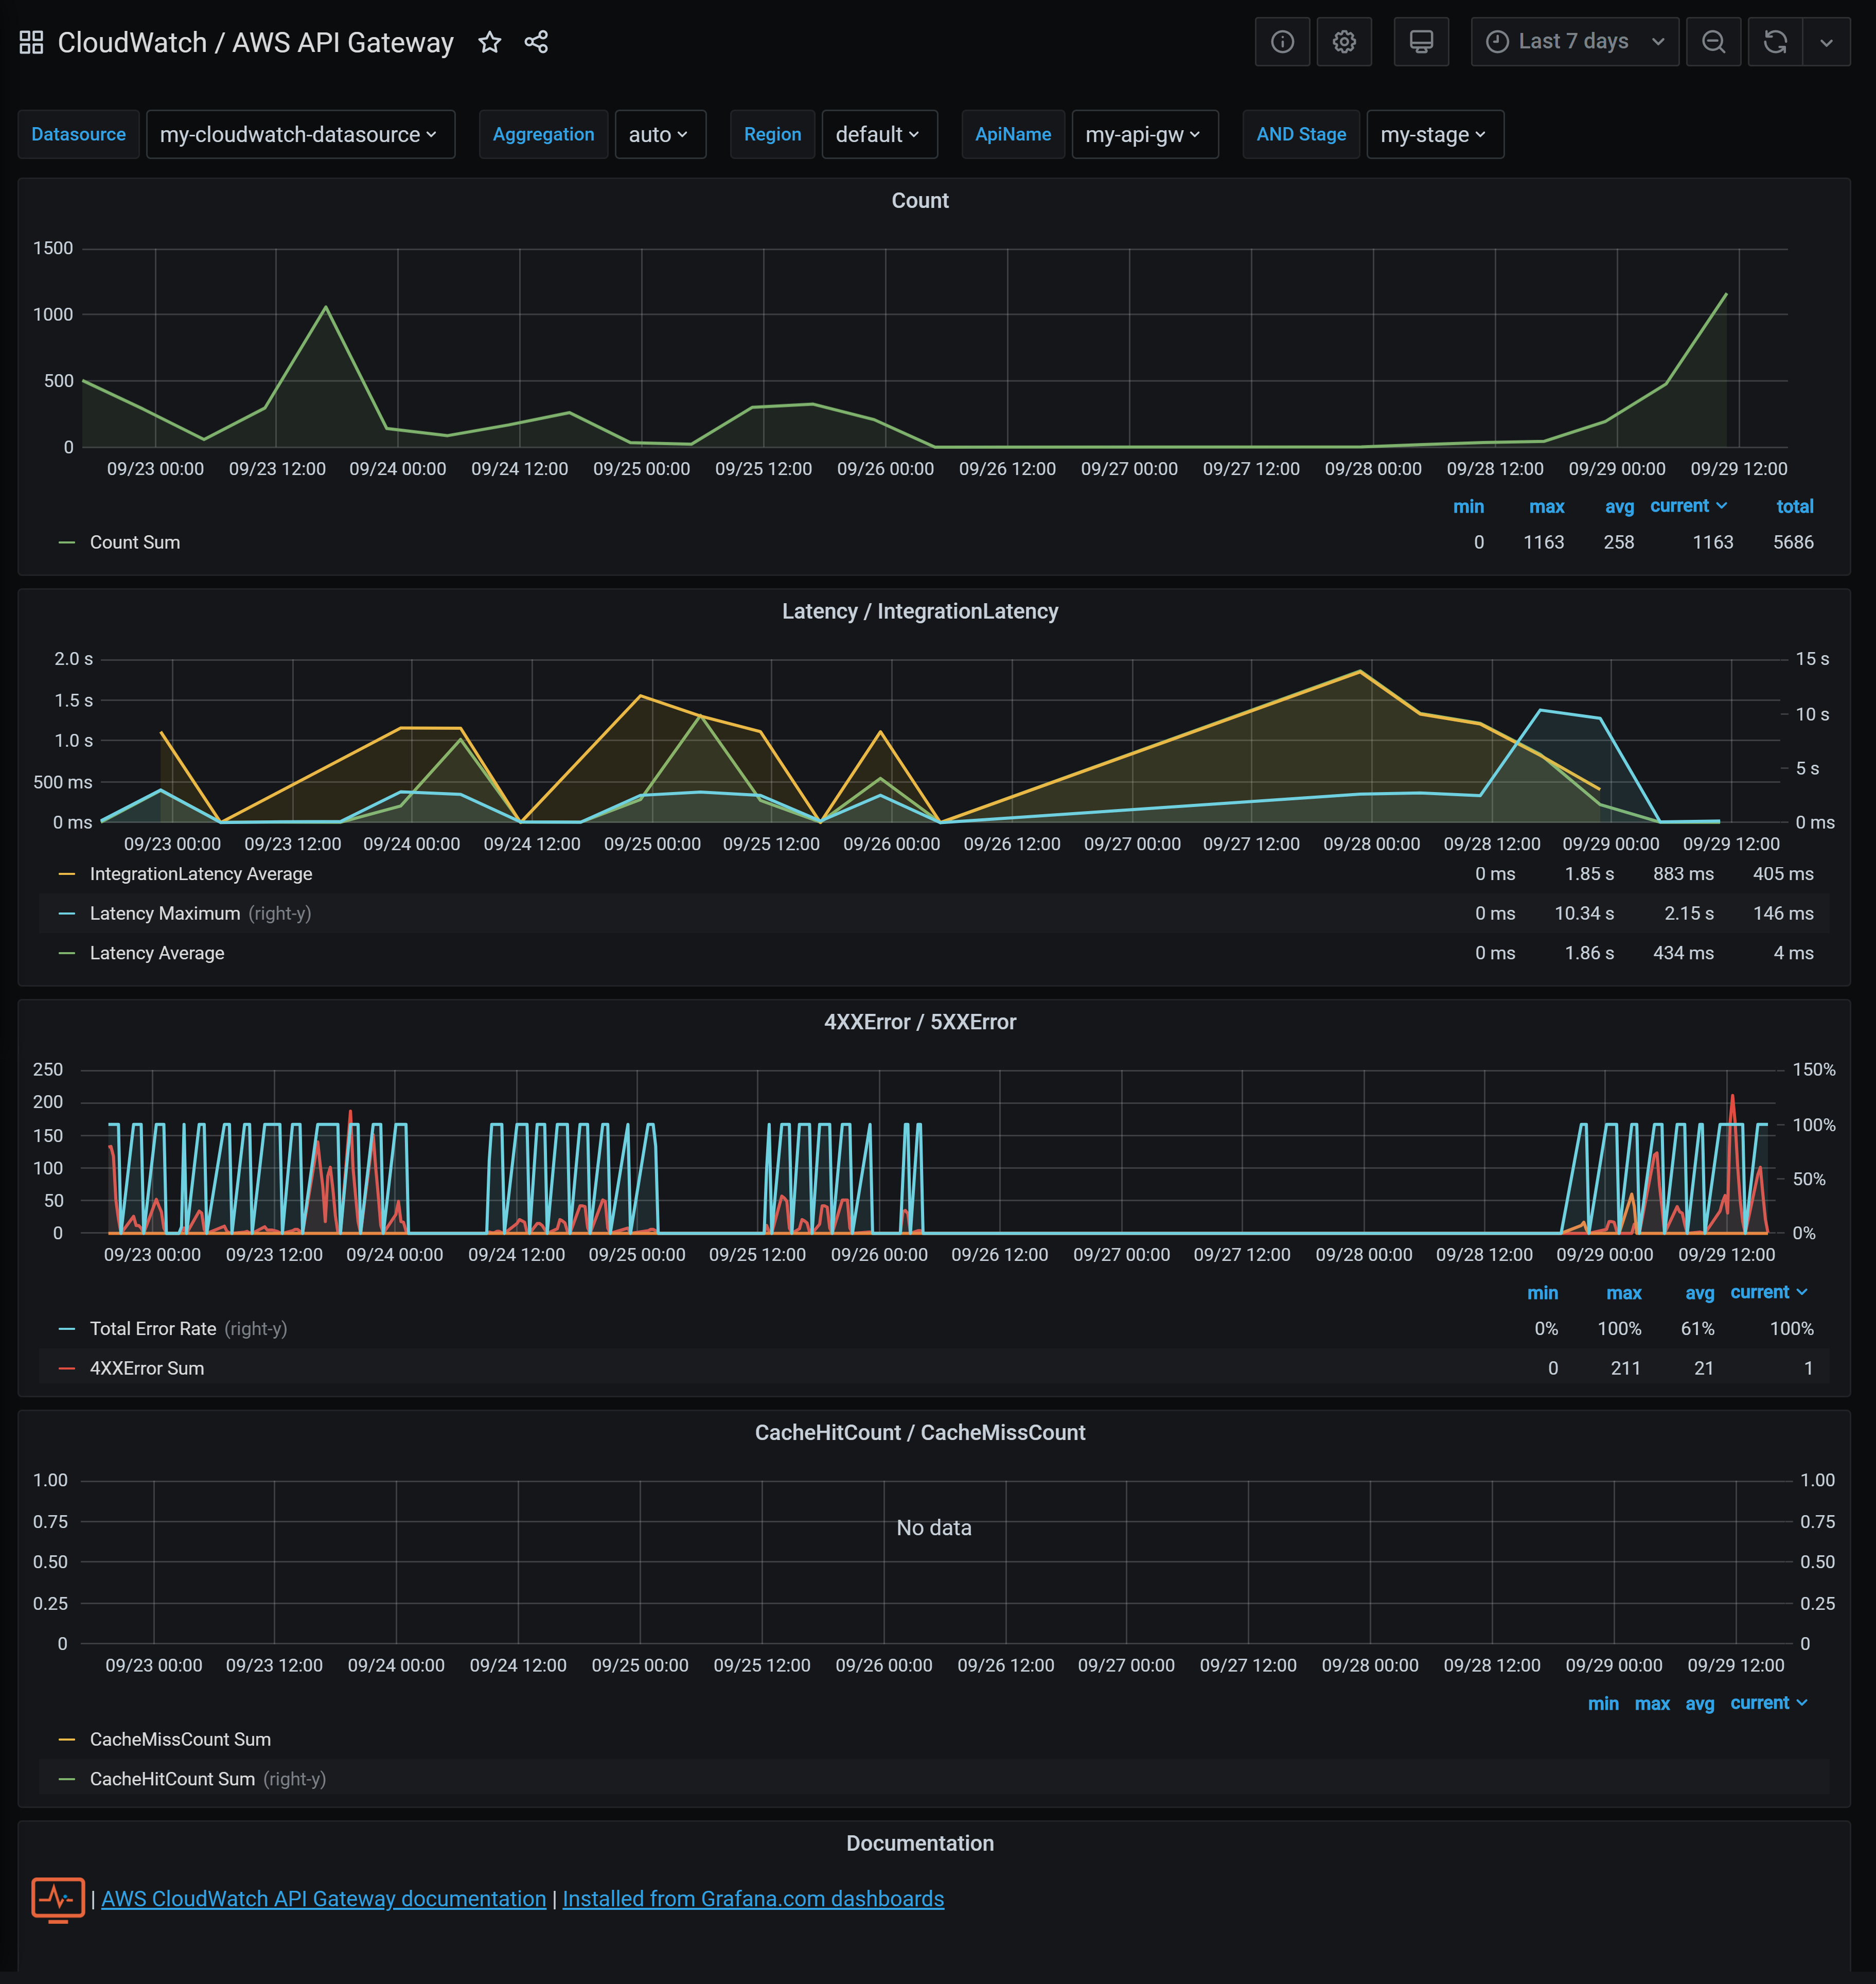
$ jsonnet -J vendor aws-cloudwatch-dashboards.jsonnetAWS API Gateway
AWS Auto Scaling
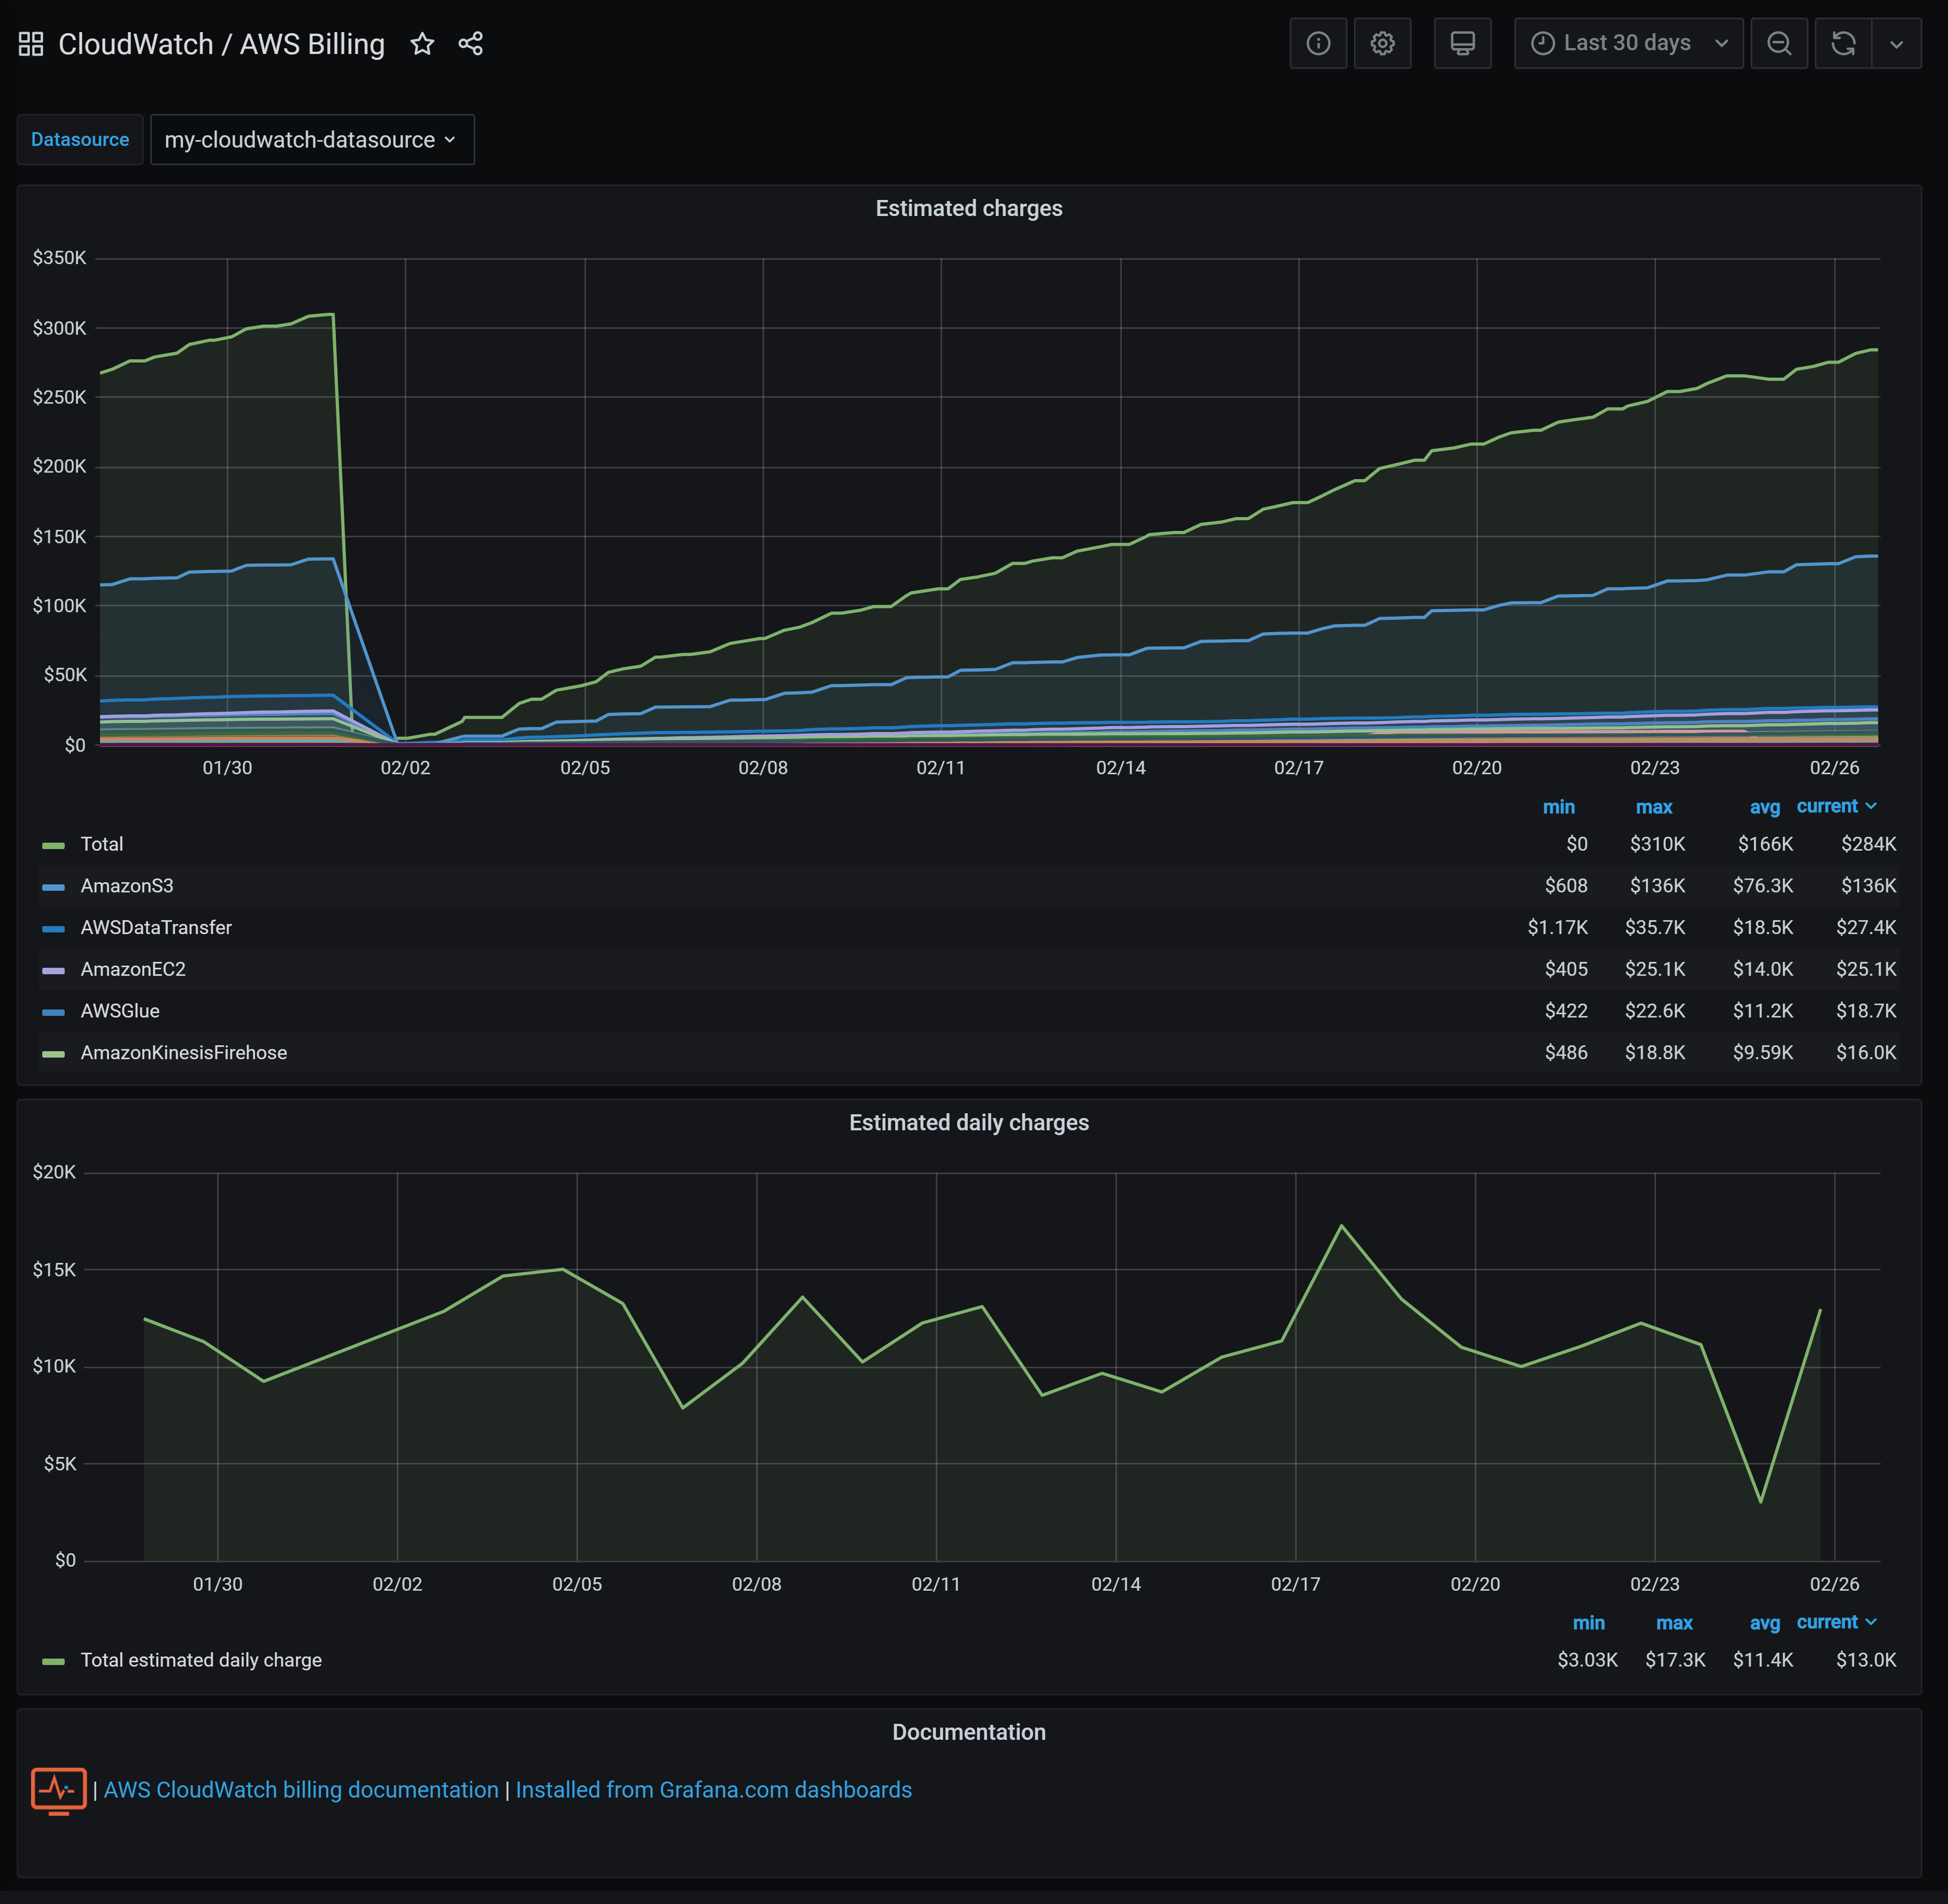
AWS Billing
AWS CloudFront
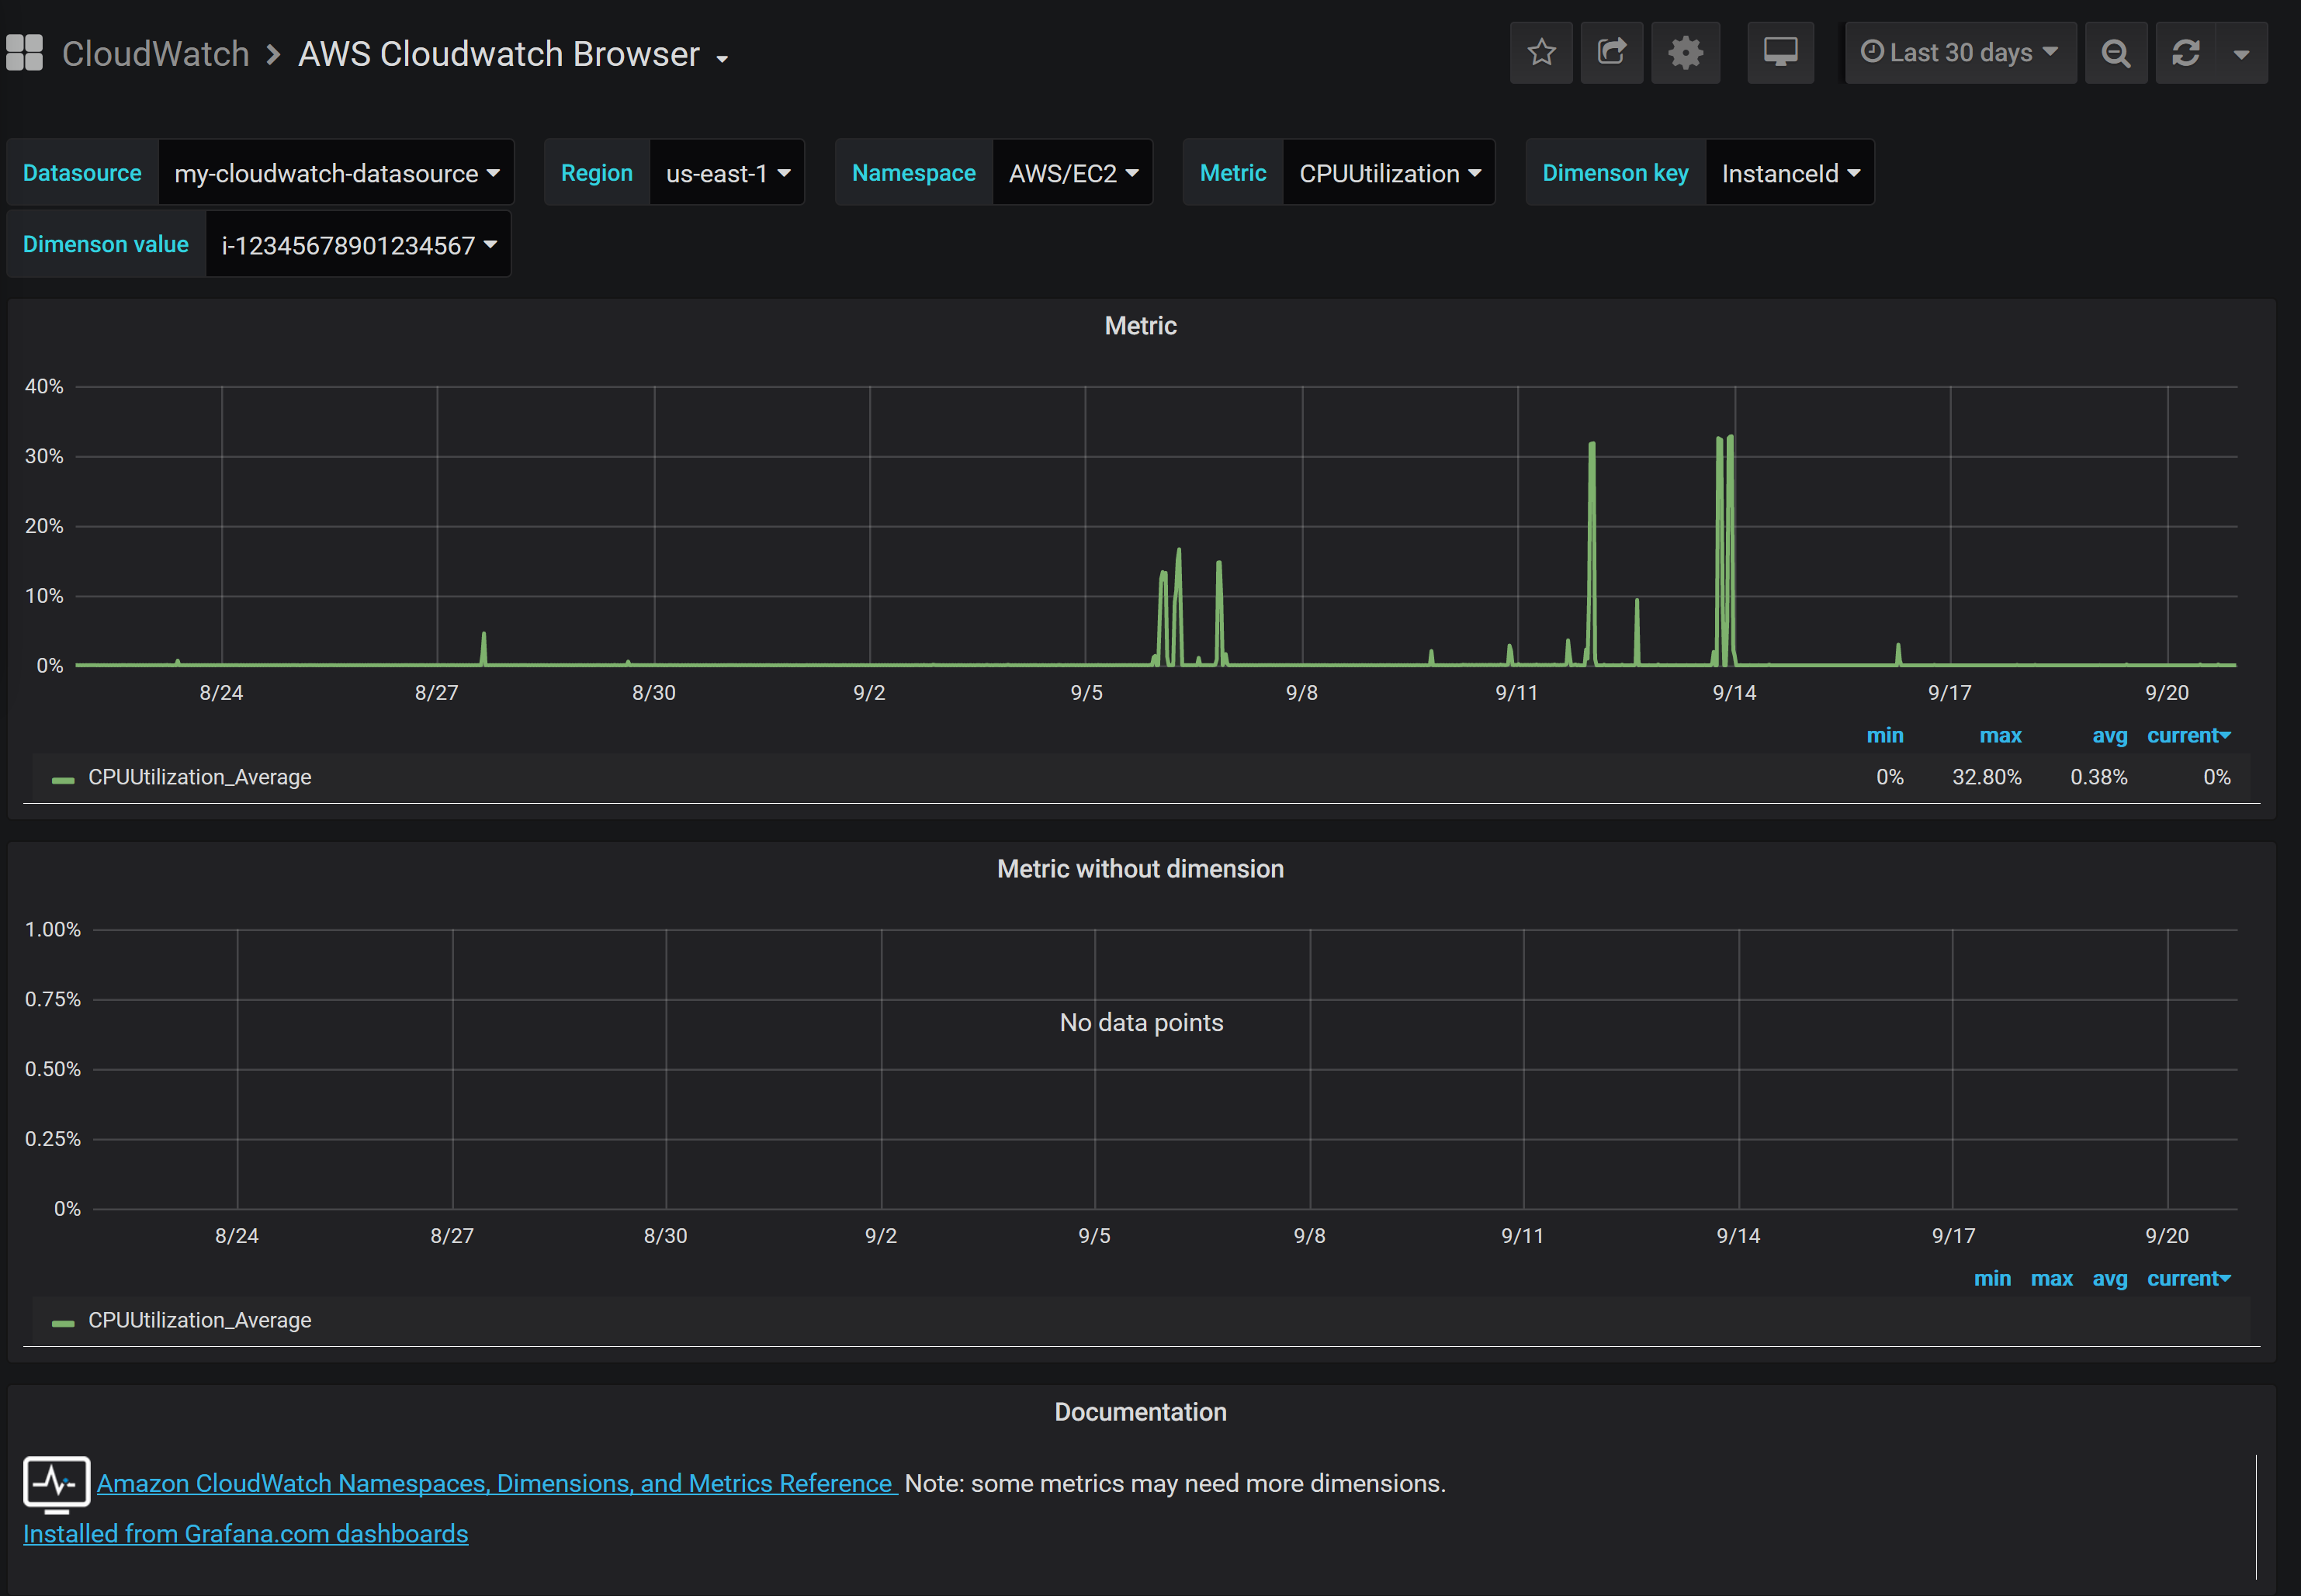
AWS CloudWatch Browser
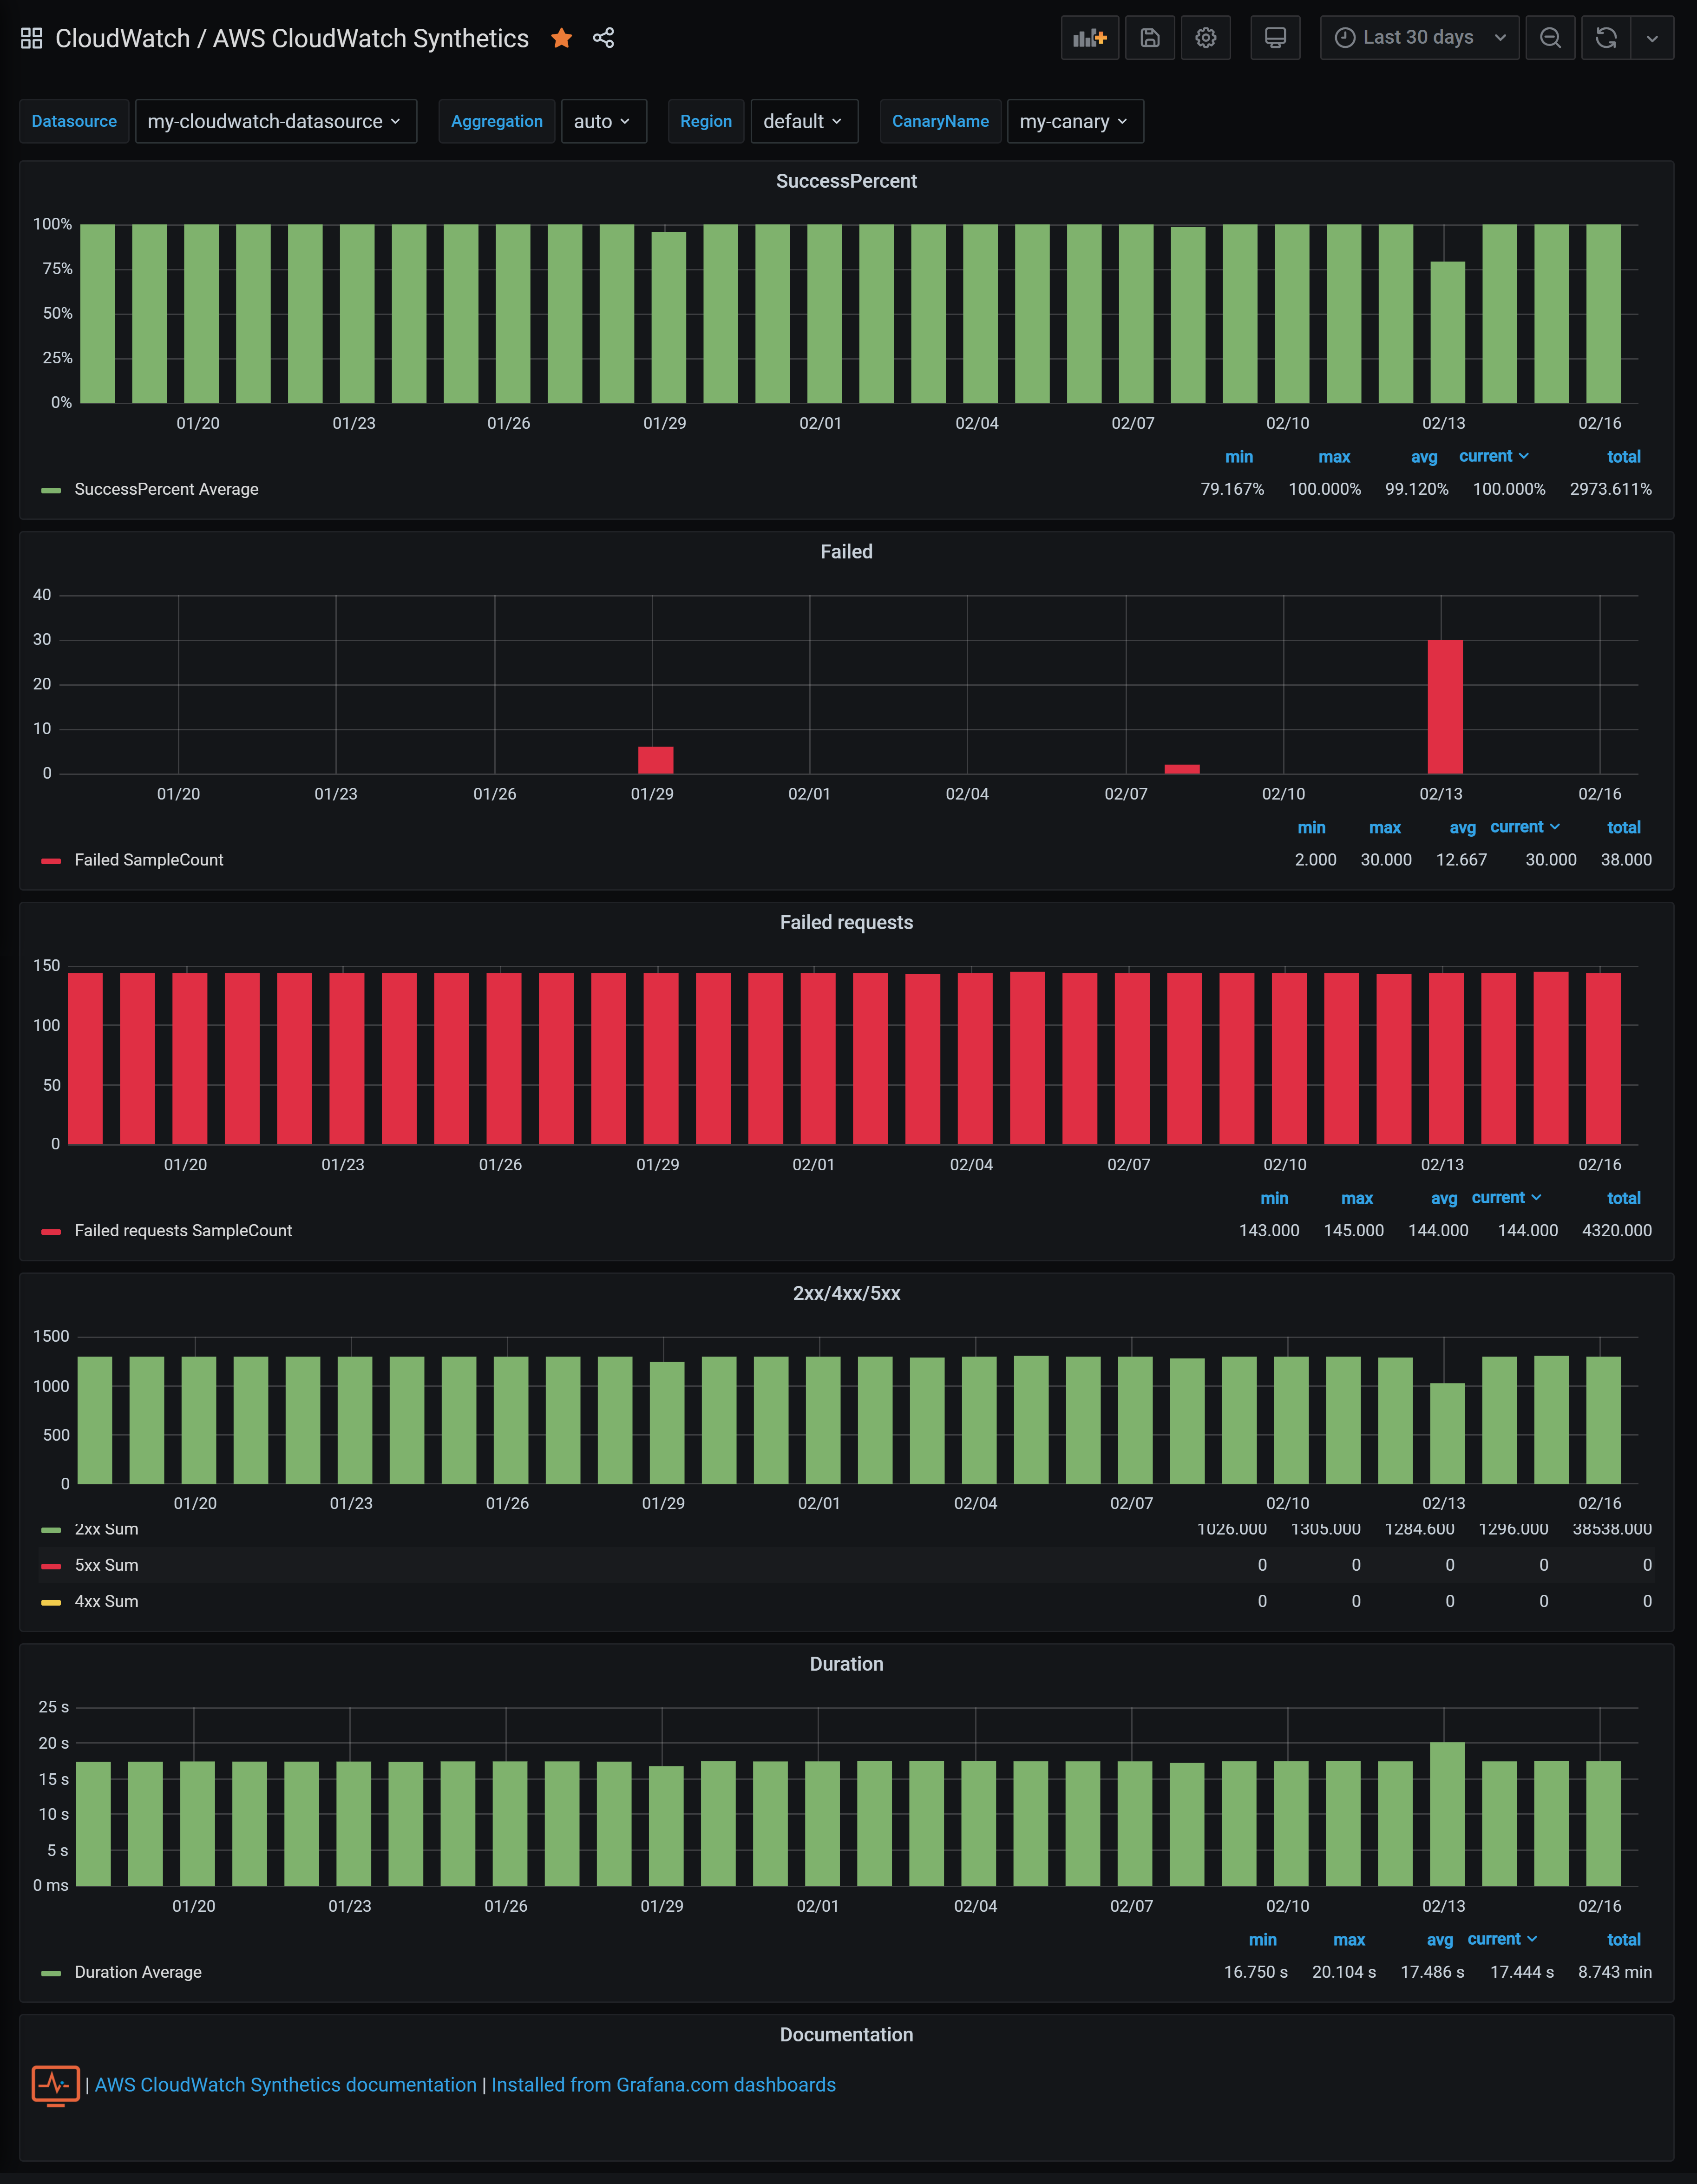
AWS CloudWatch Synthetics
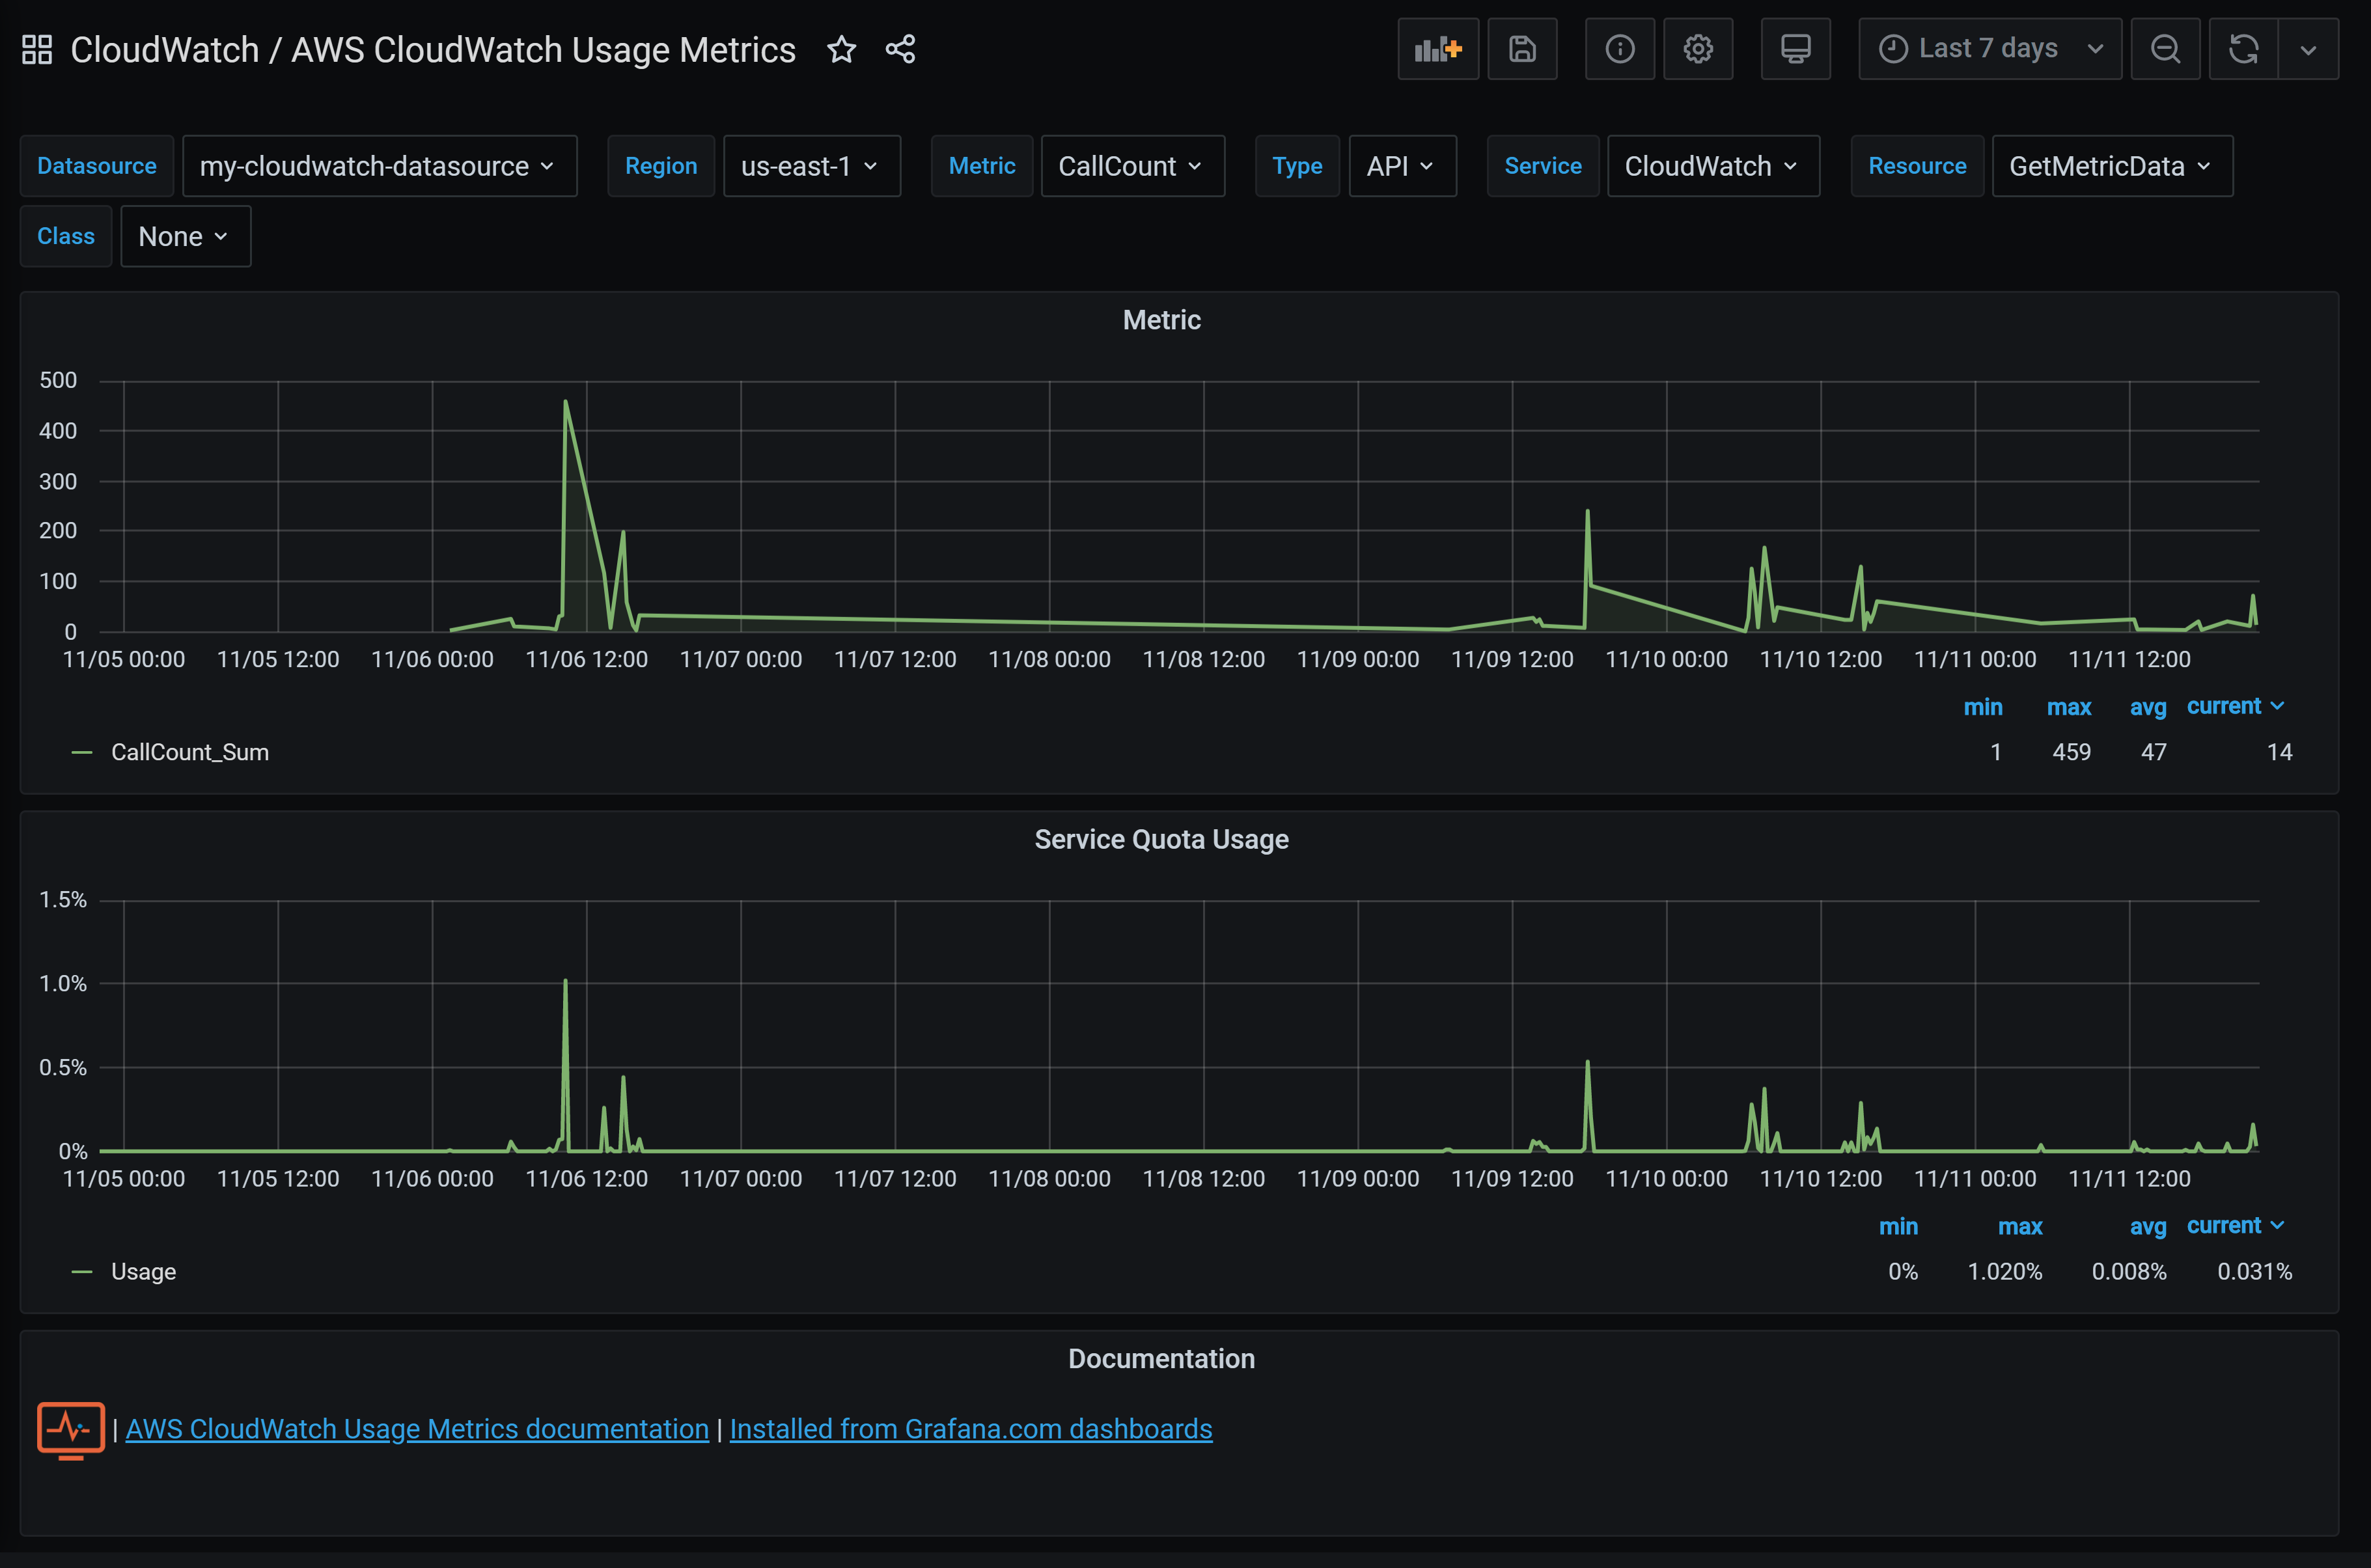
AWS CloudWatch Usage Metrics
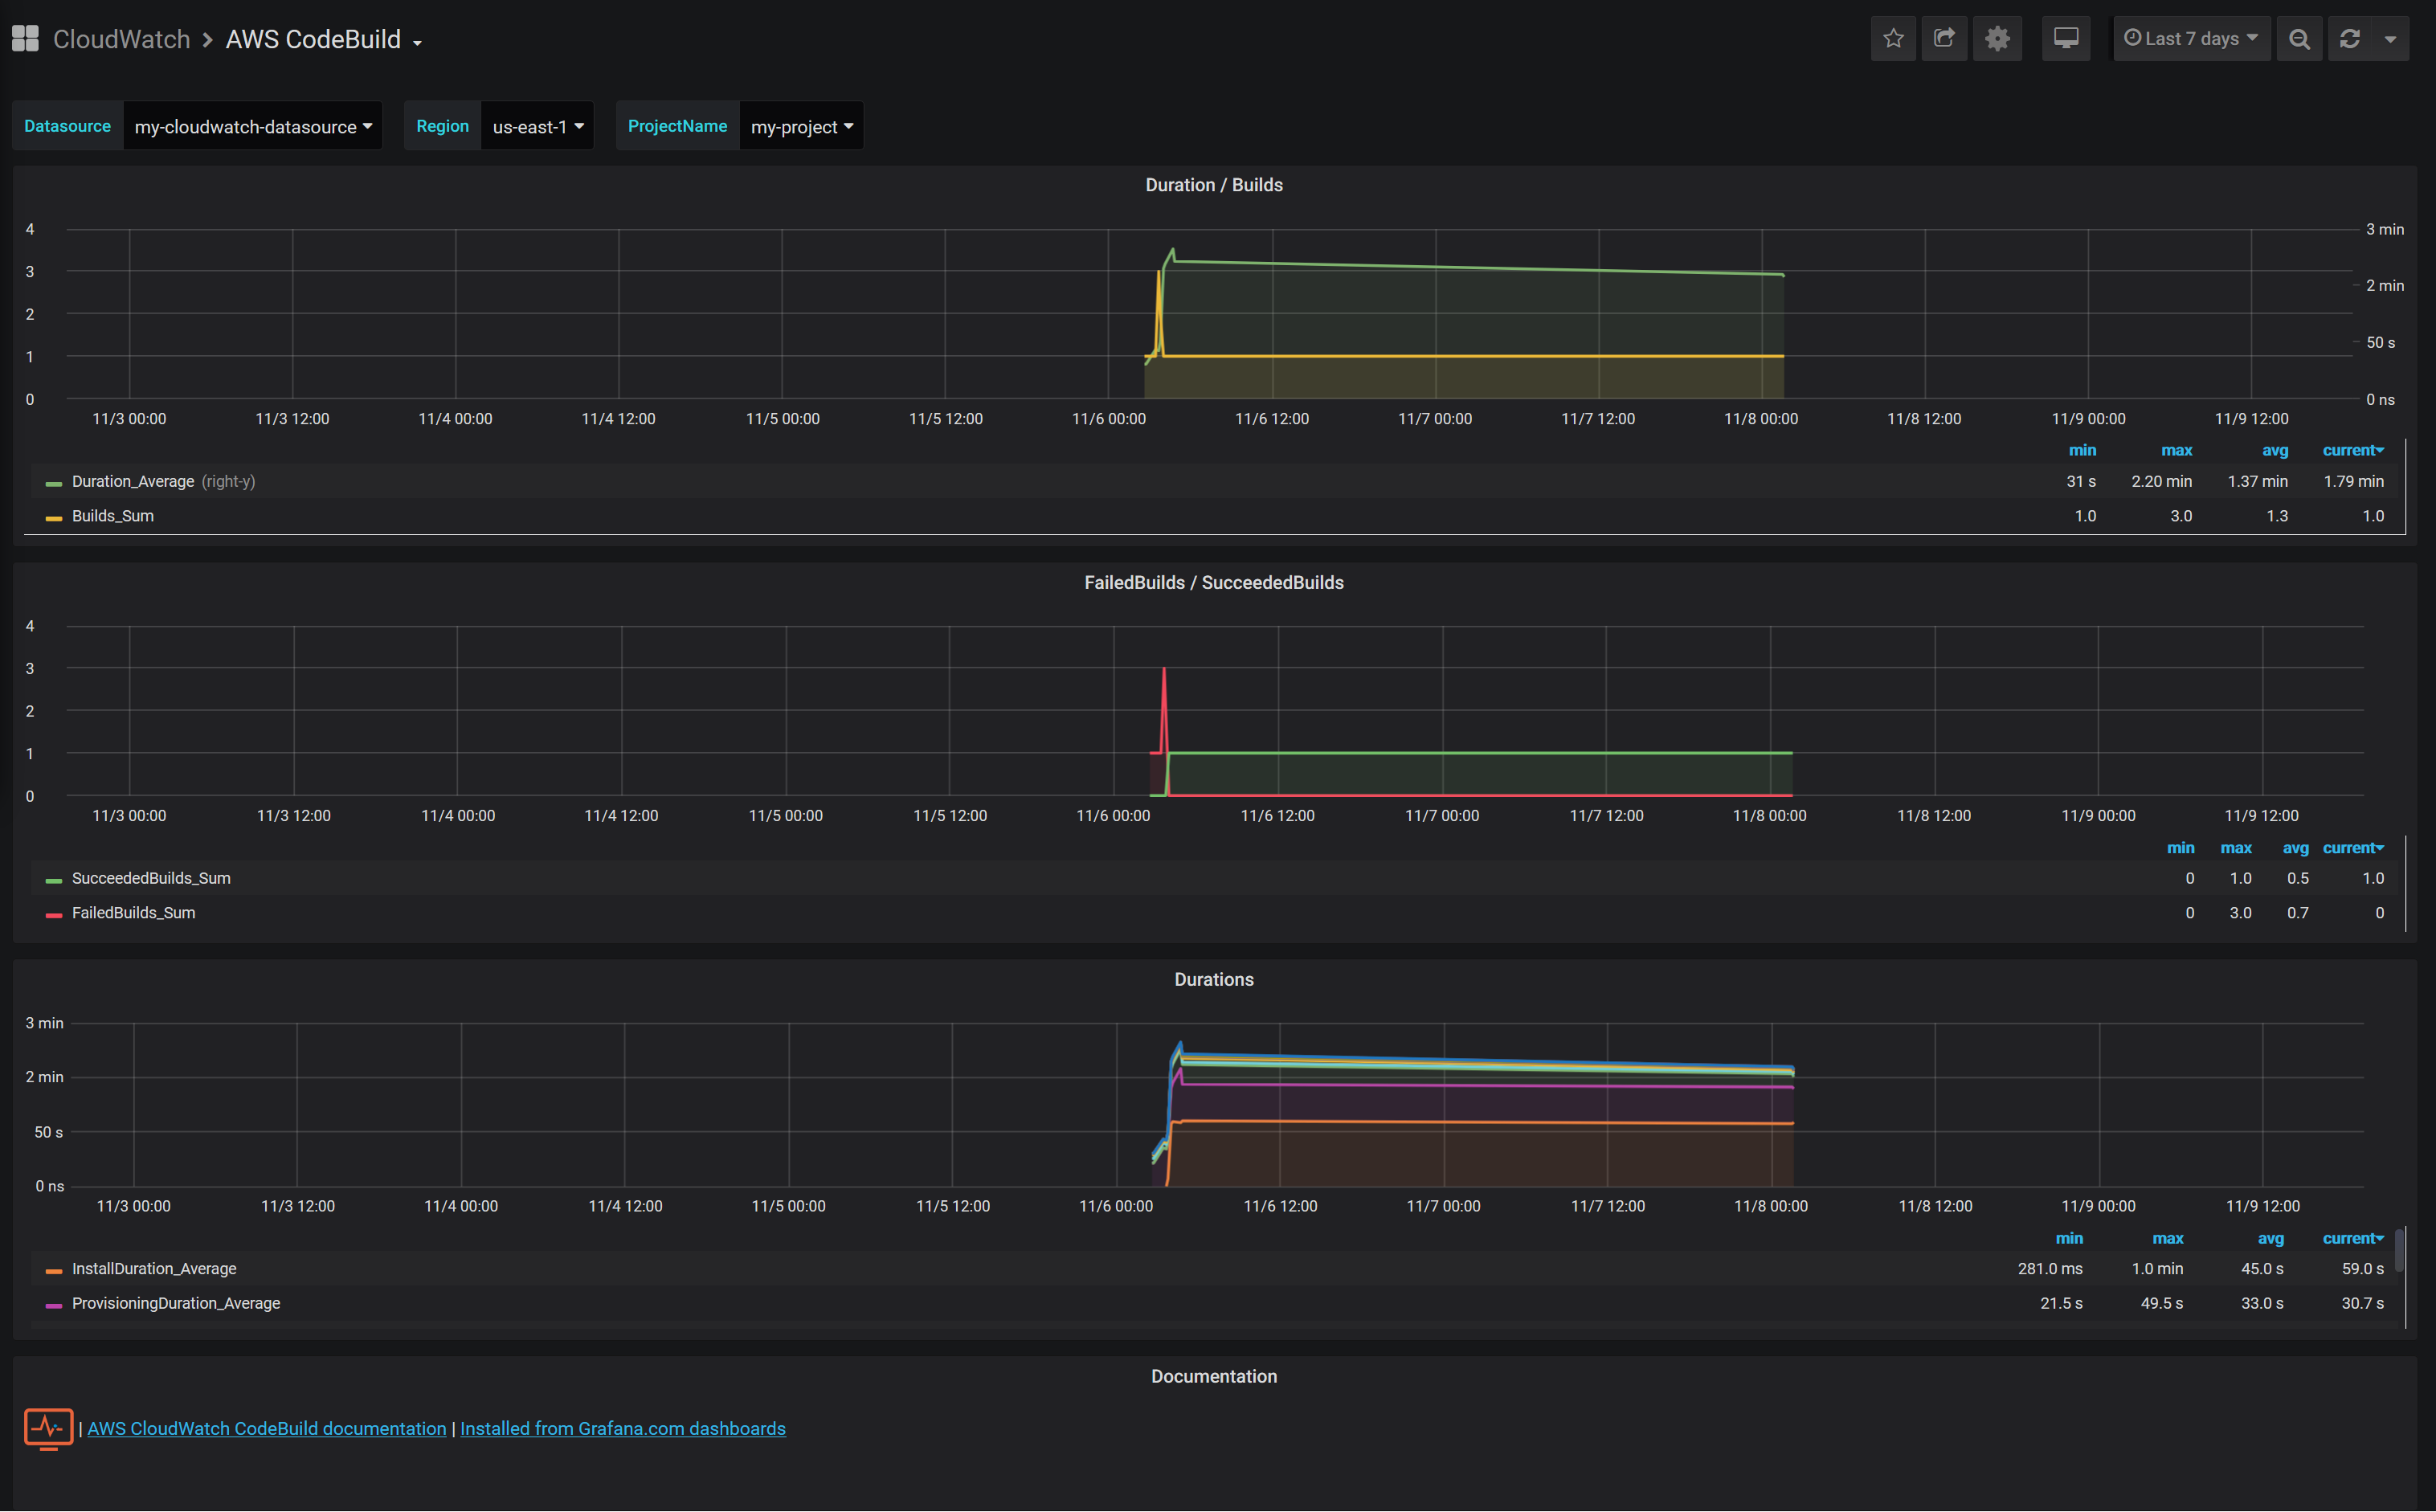
AWS CodeBuild
AWS Cognito
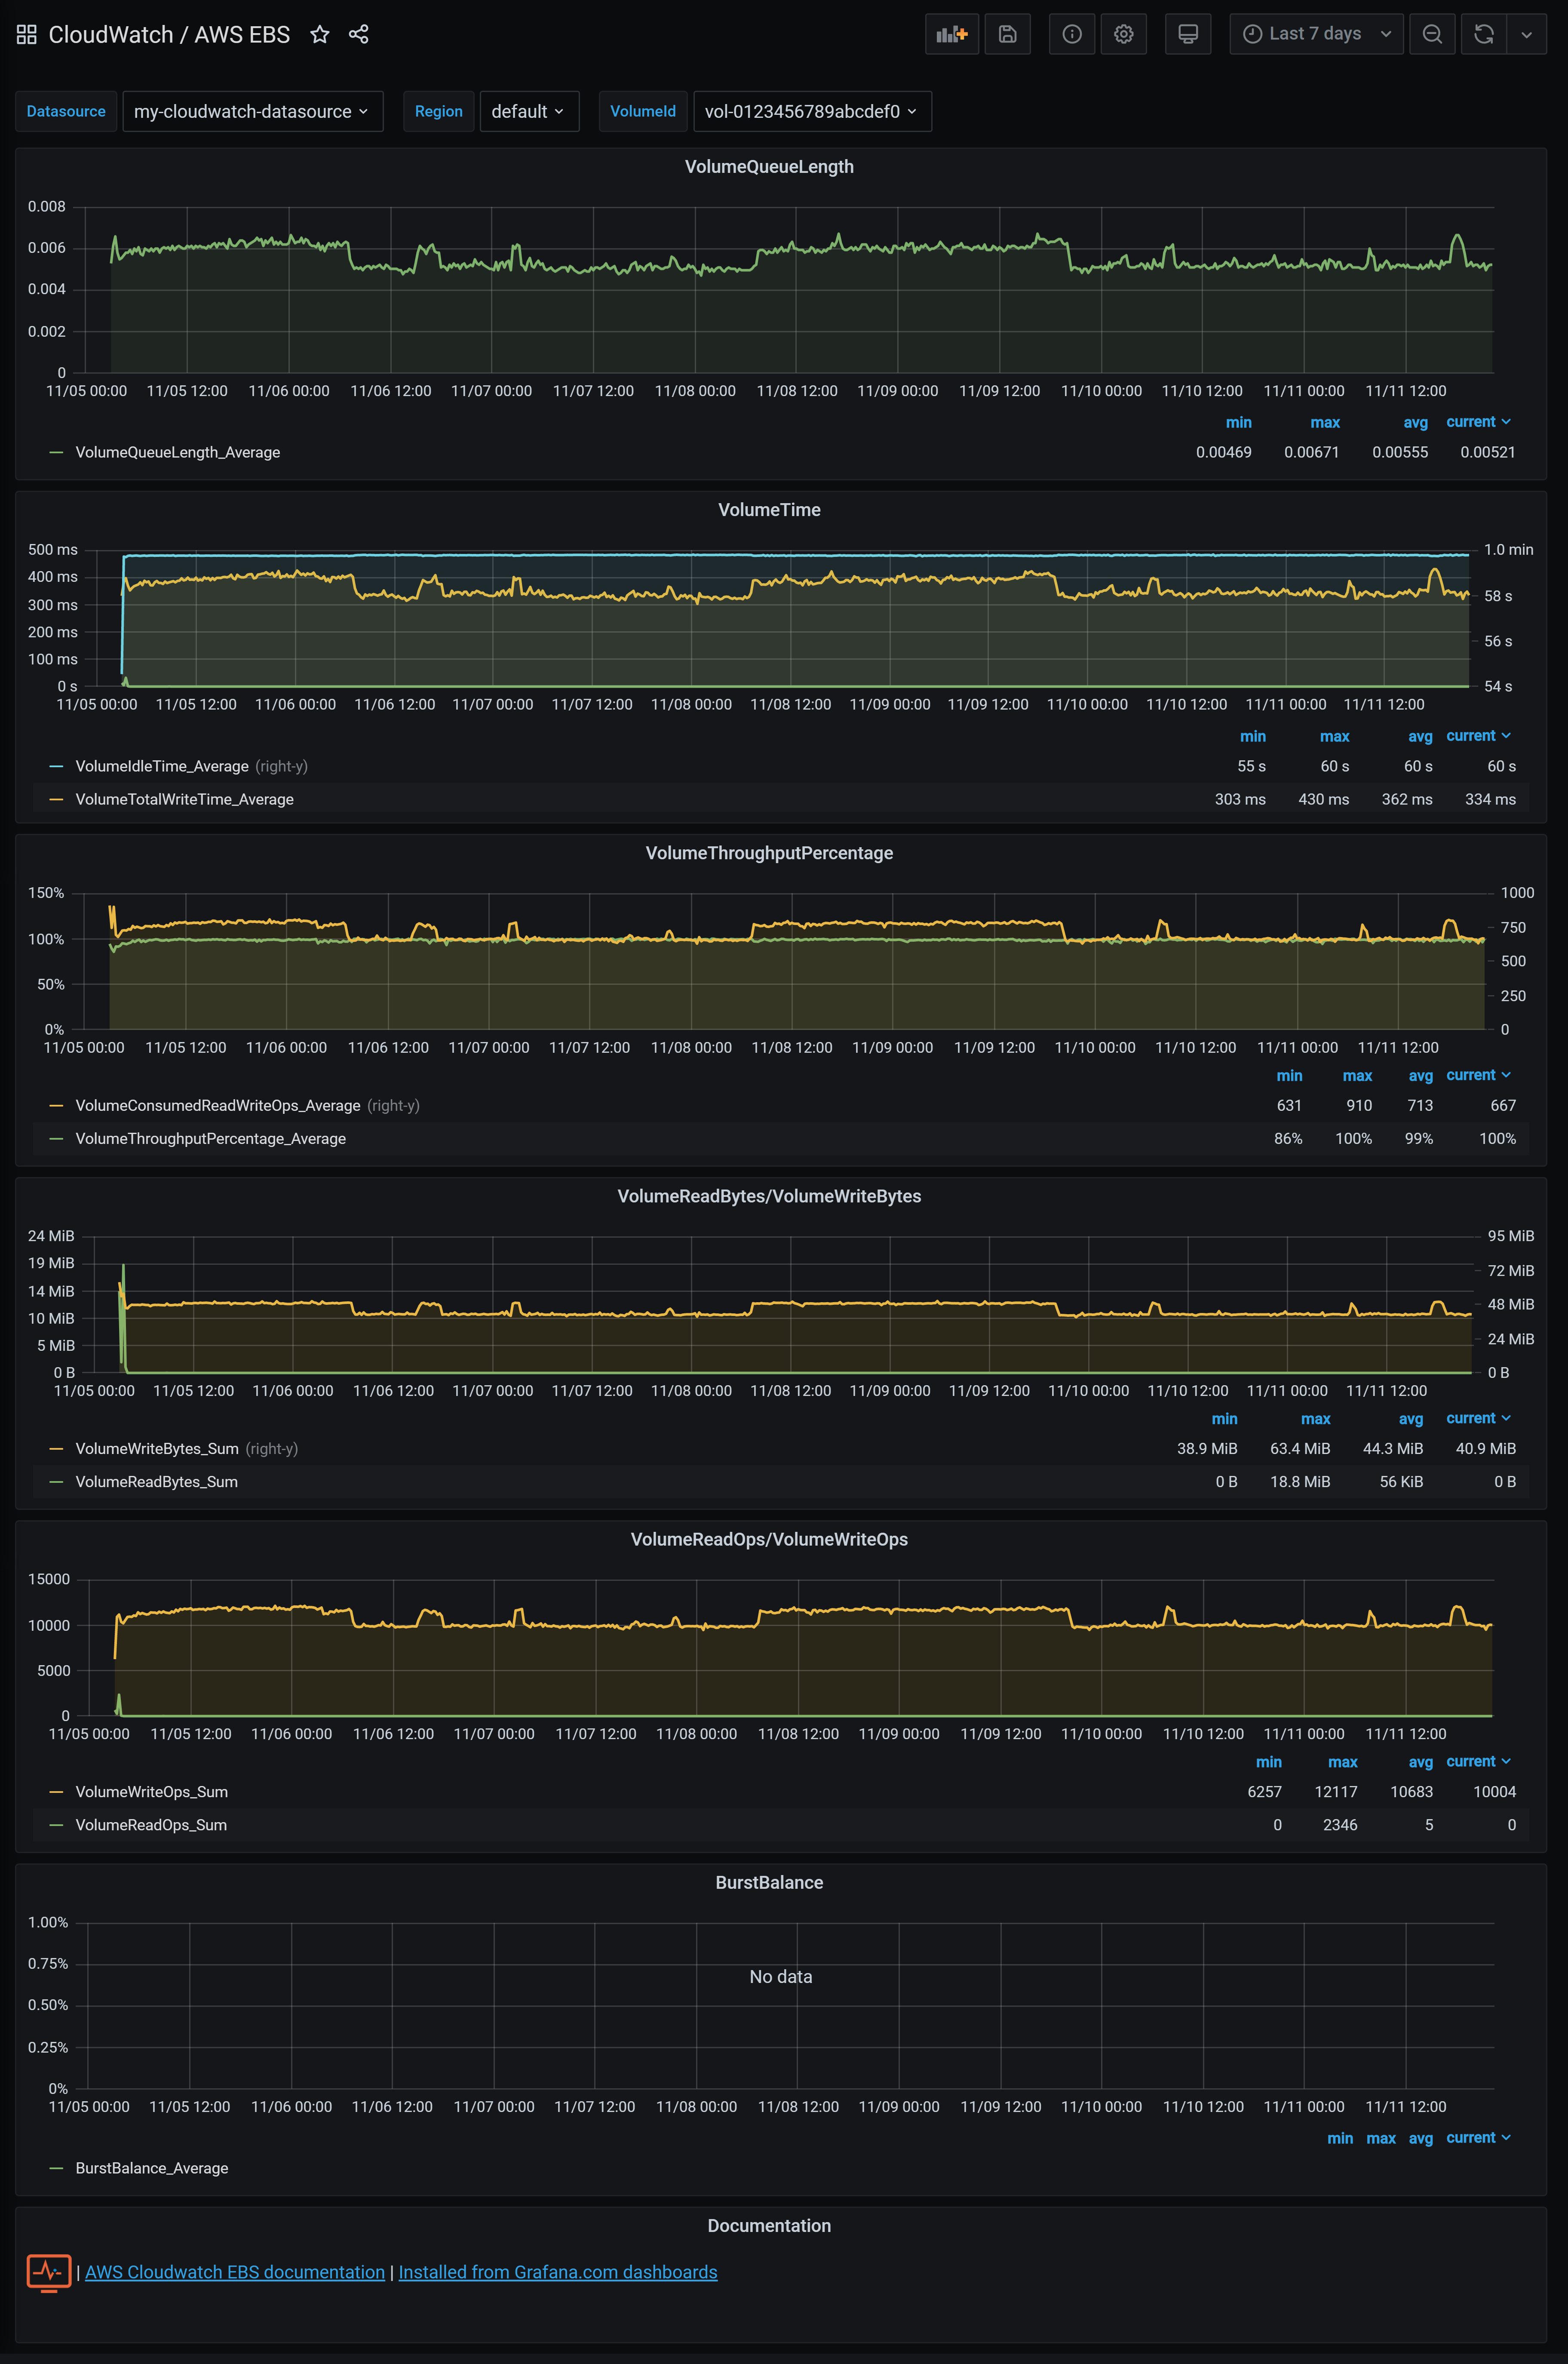
AWS EBS
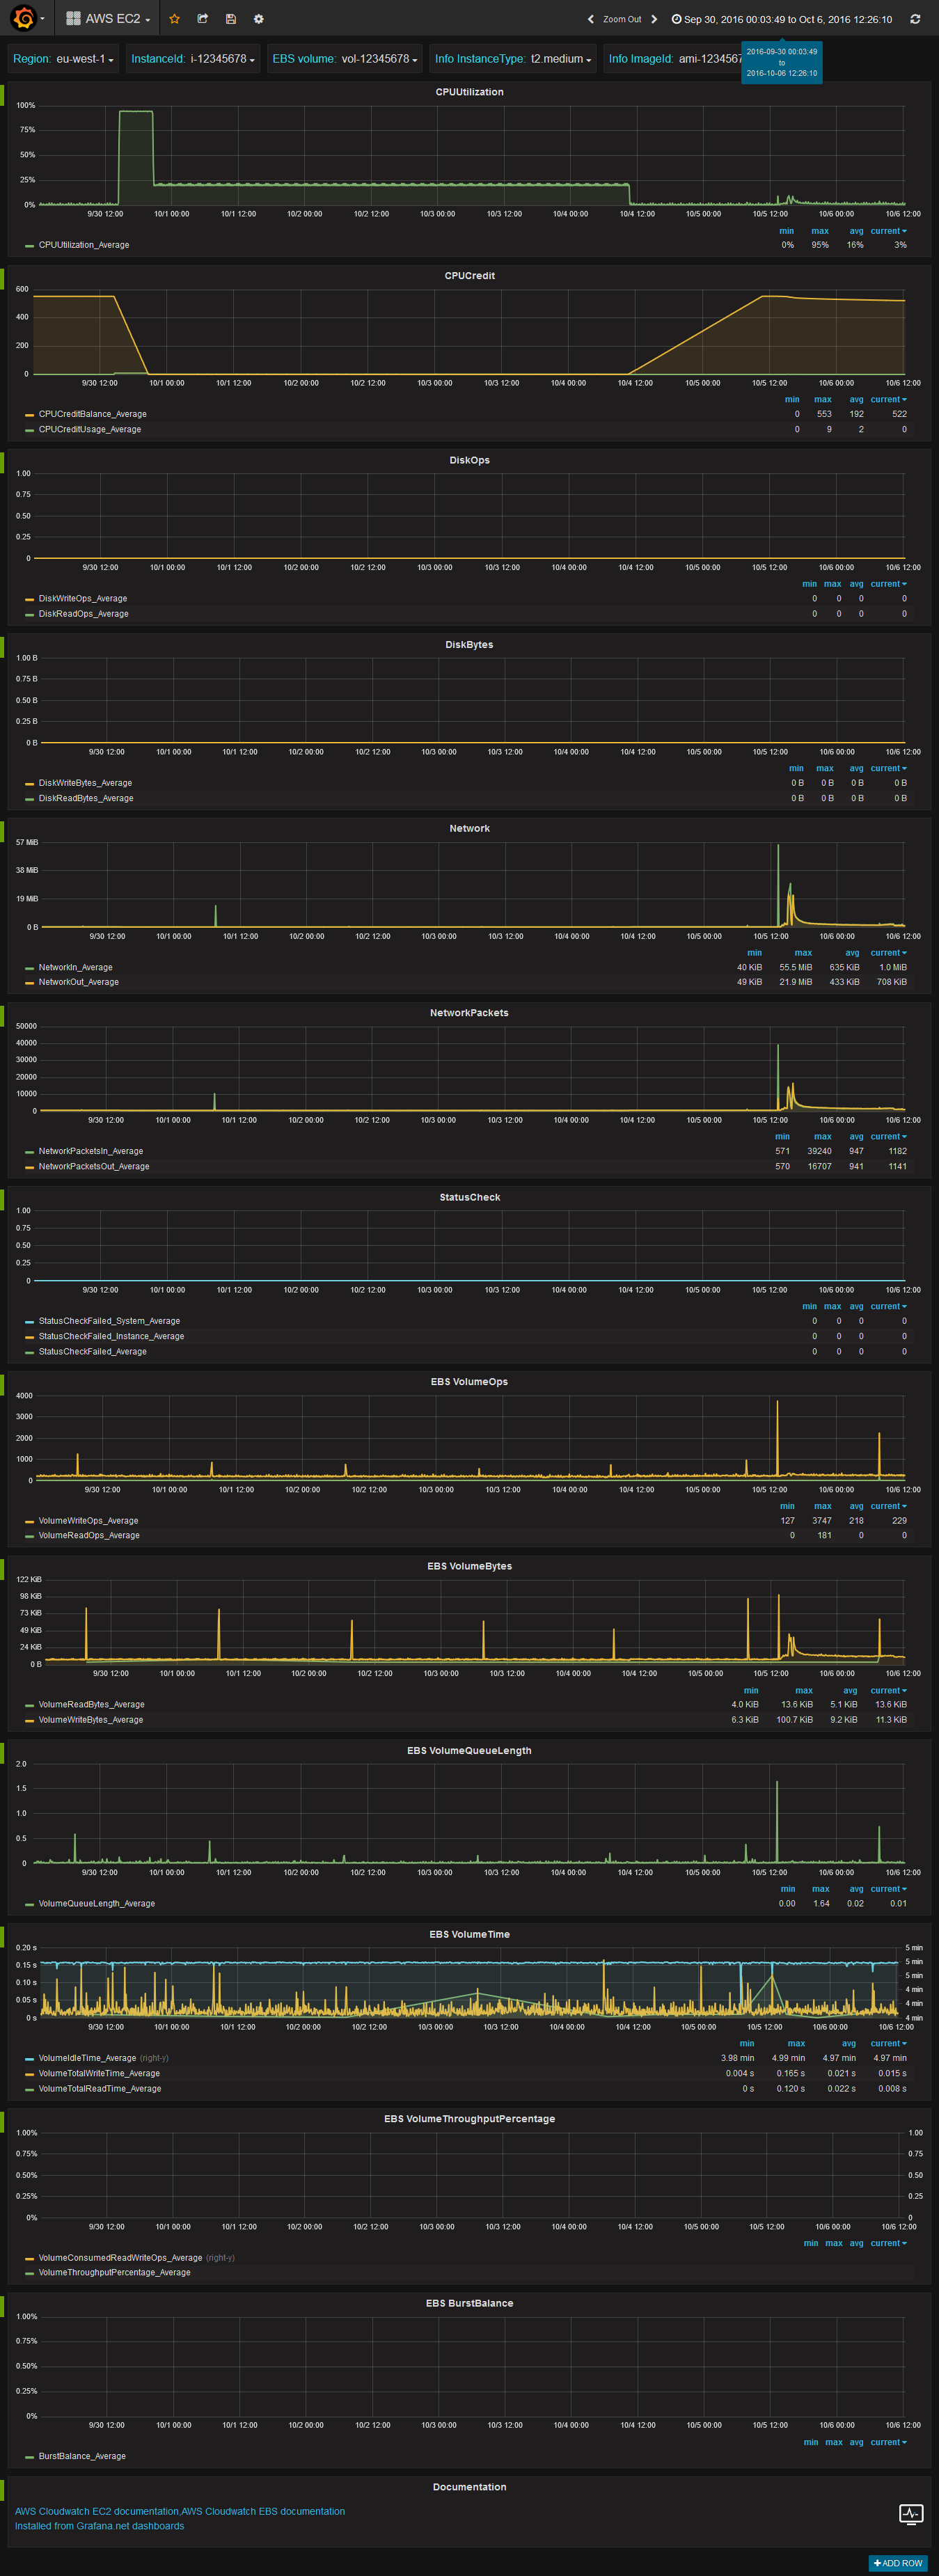
AWS EC2
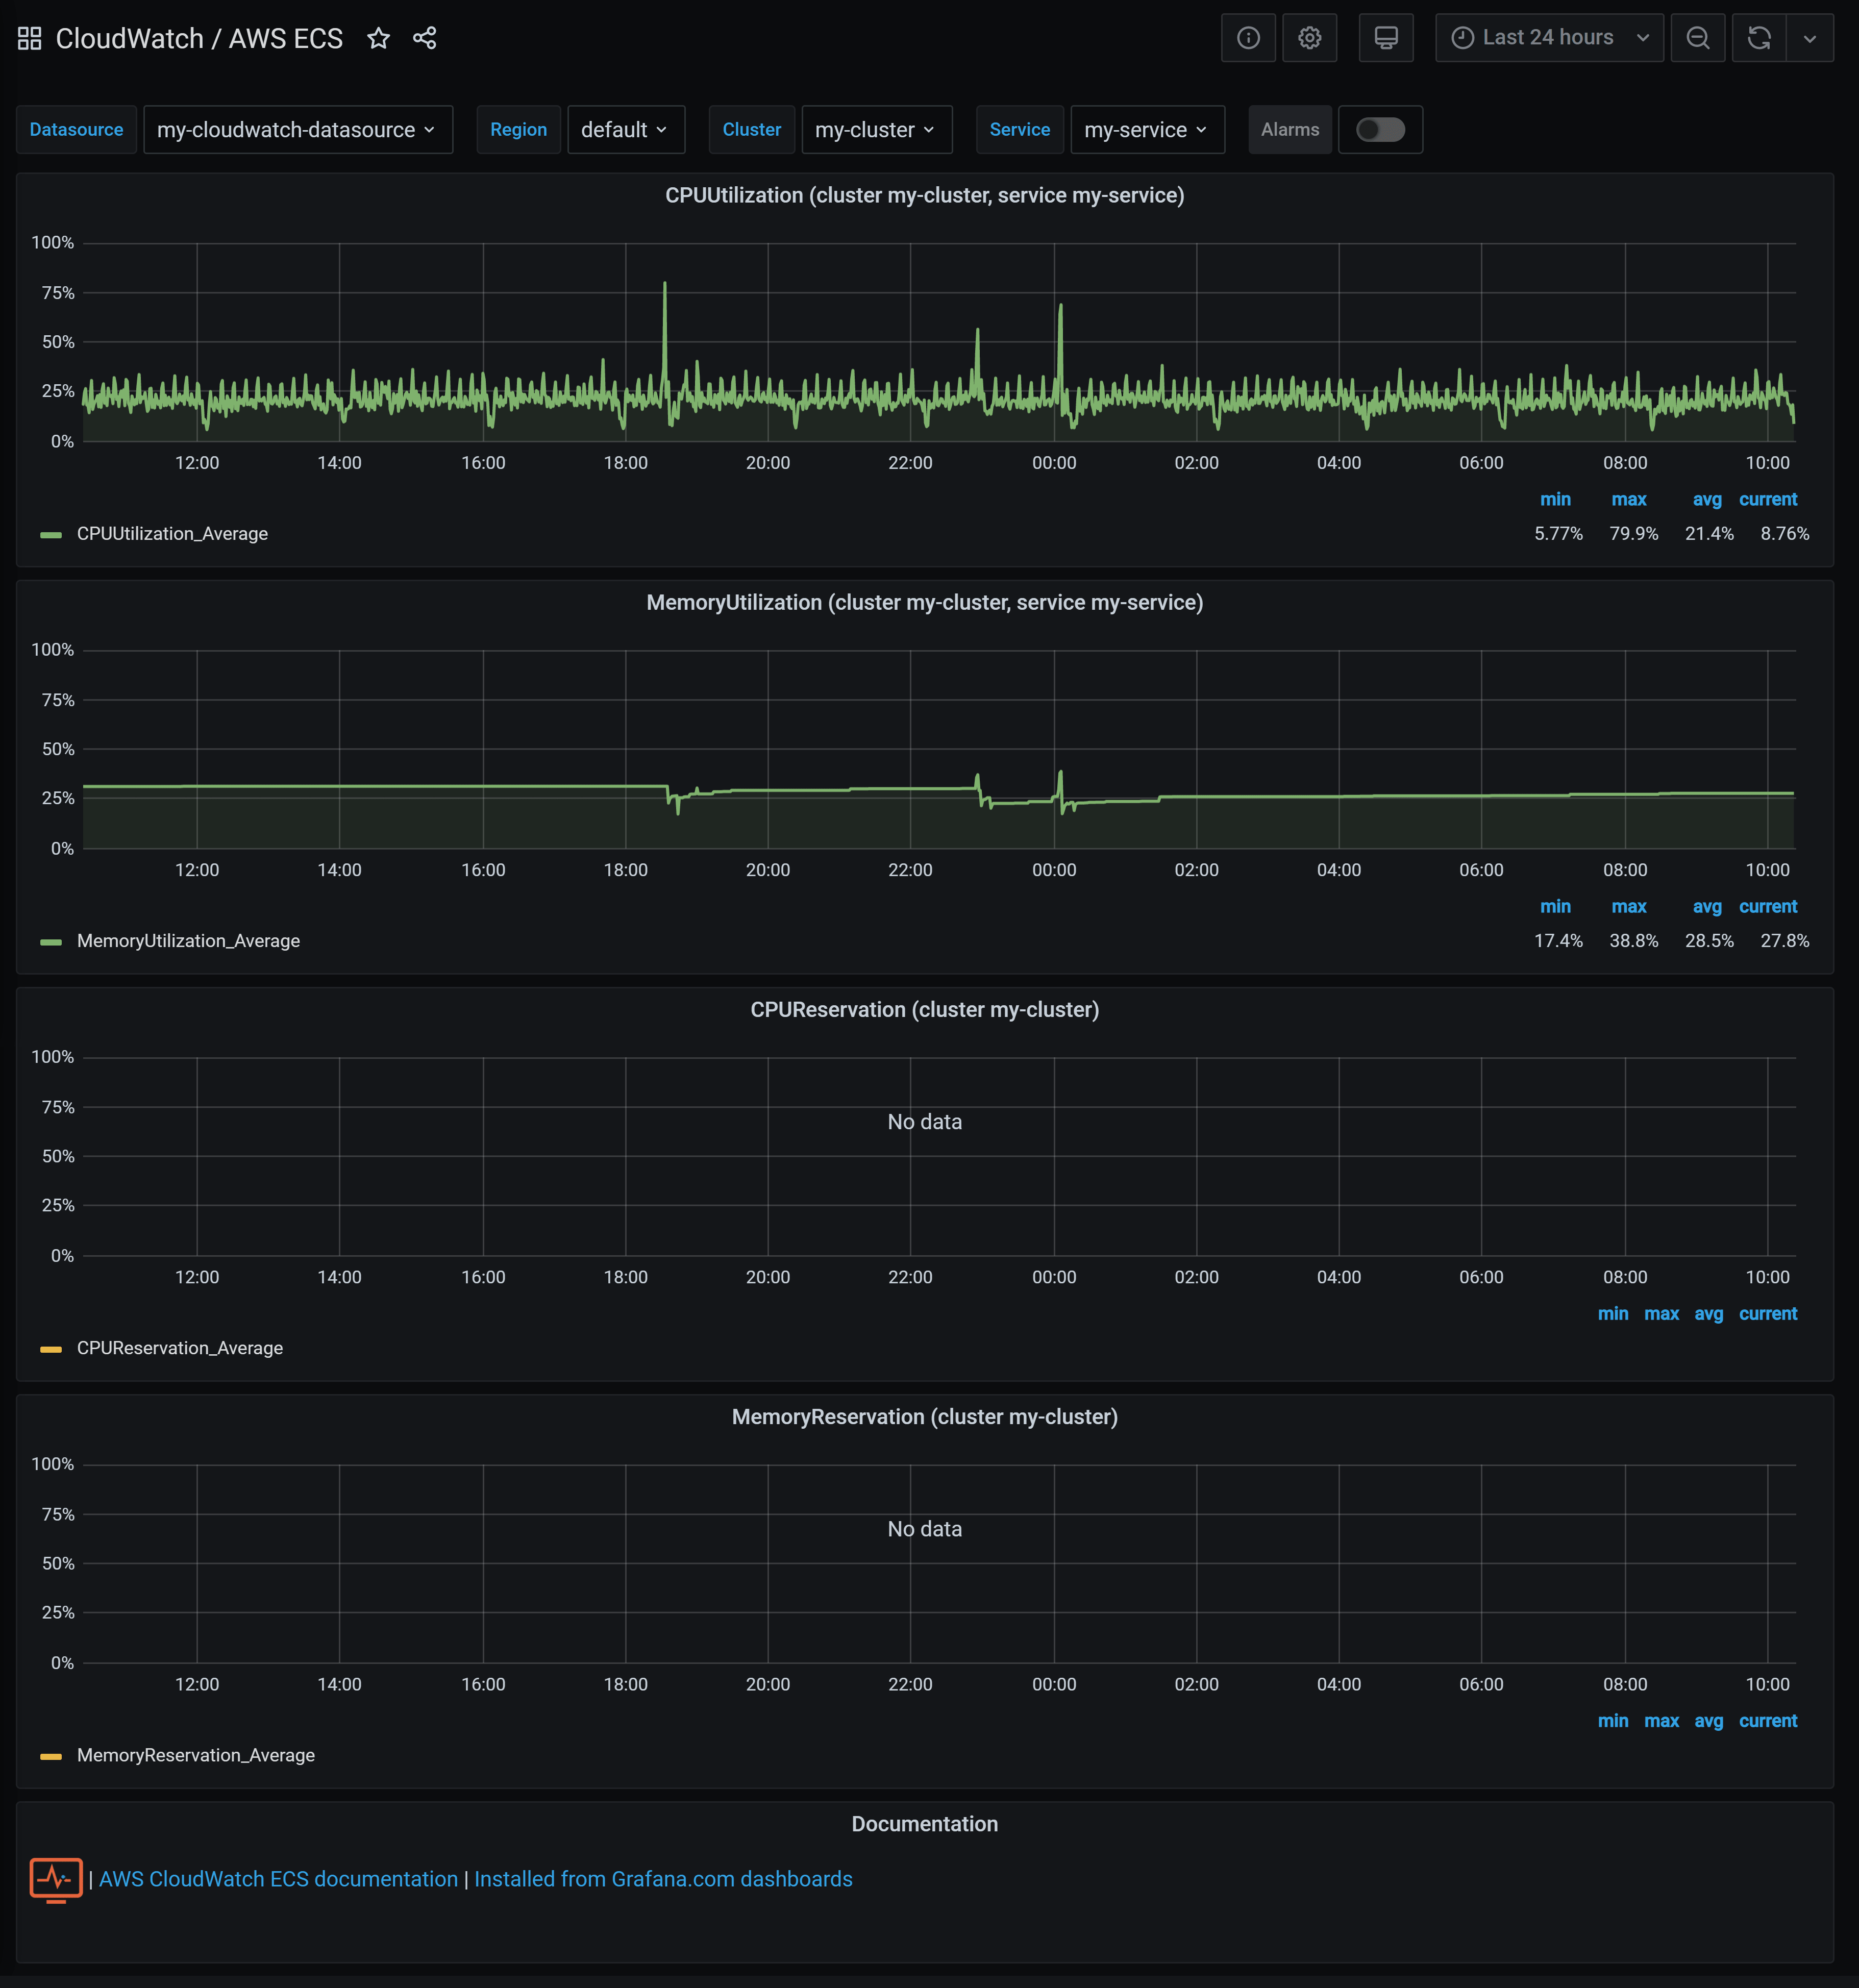
AWS ECS
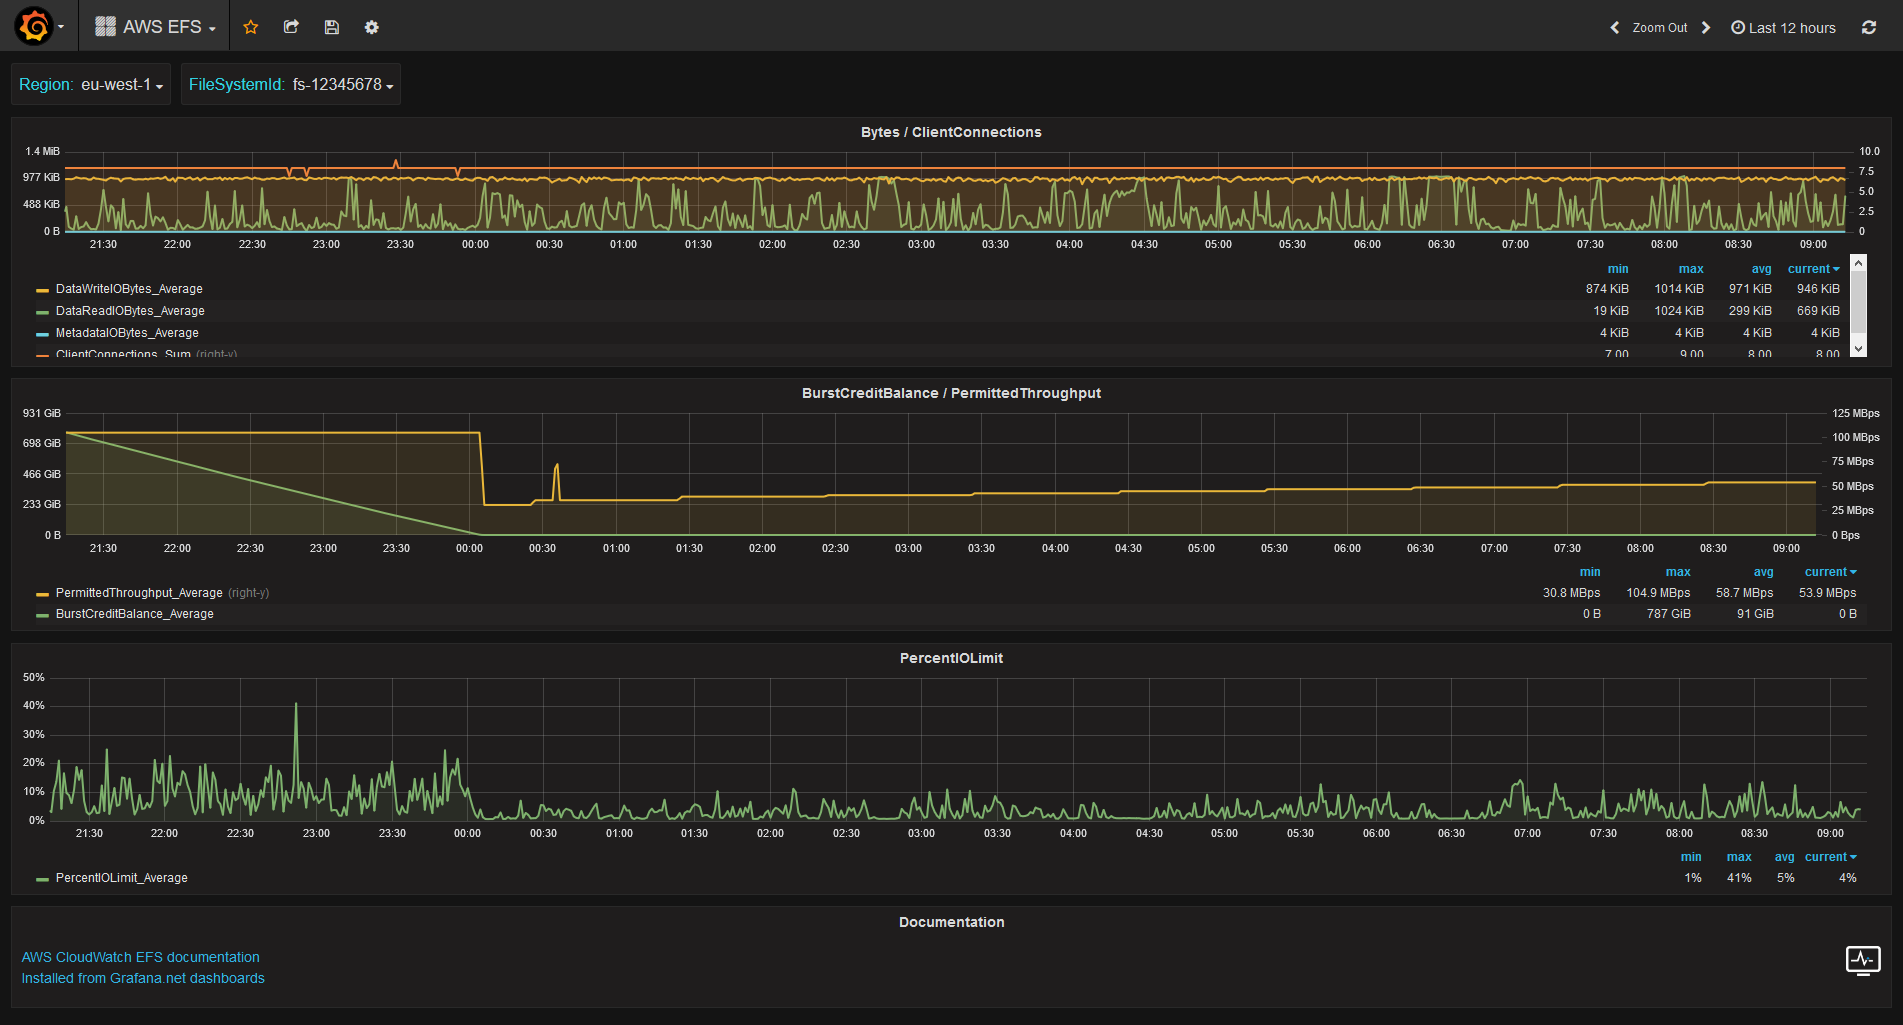
AWS EFS
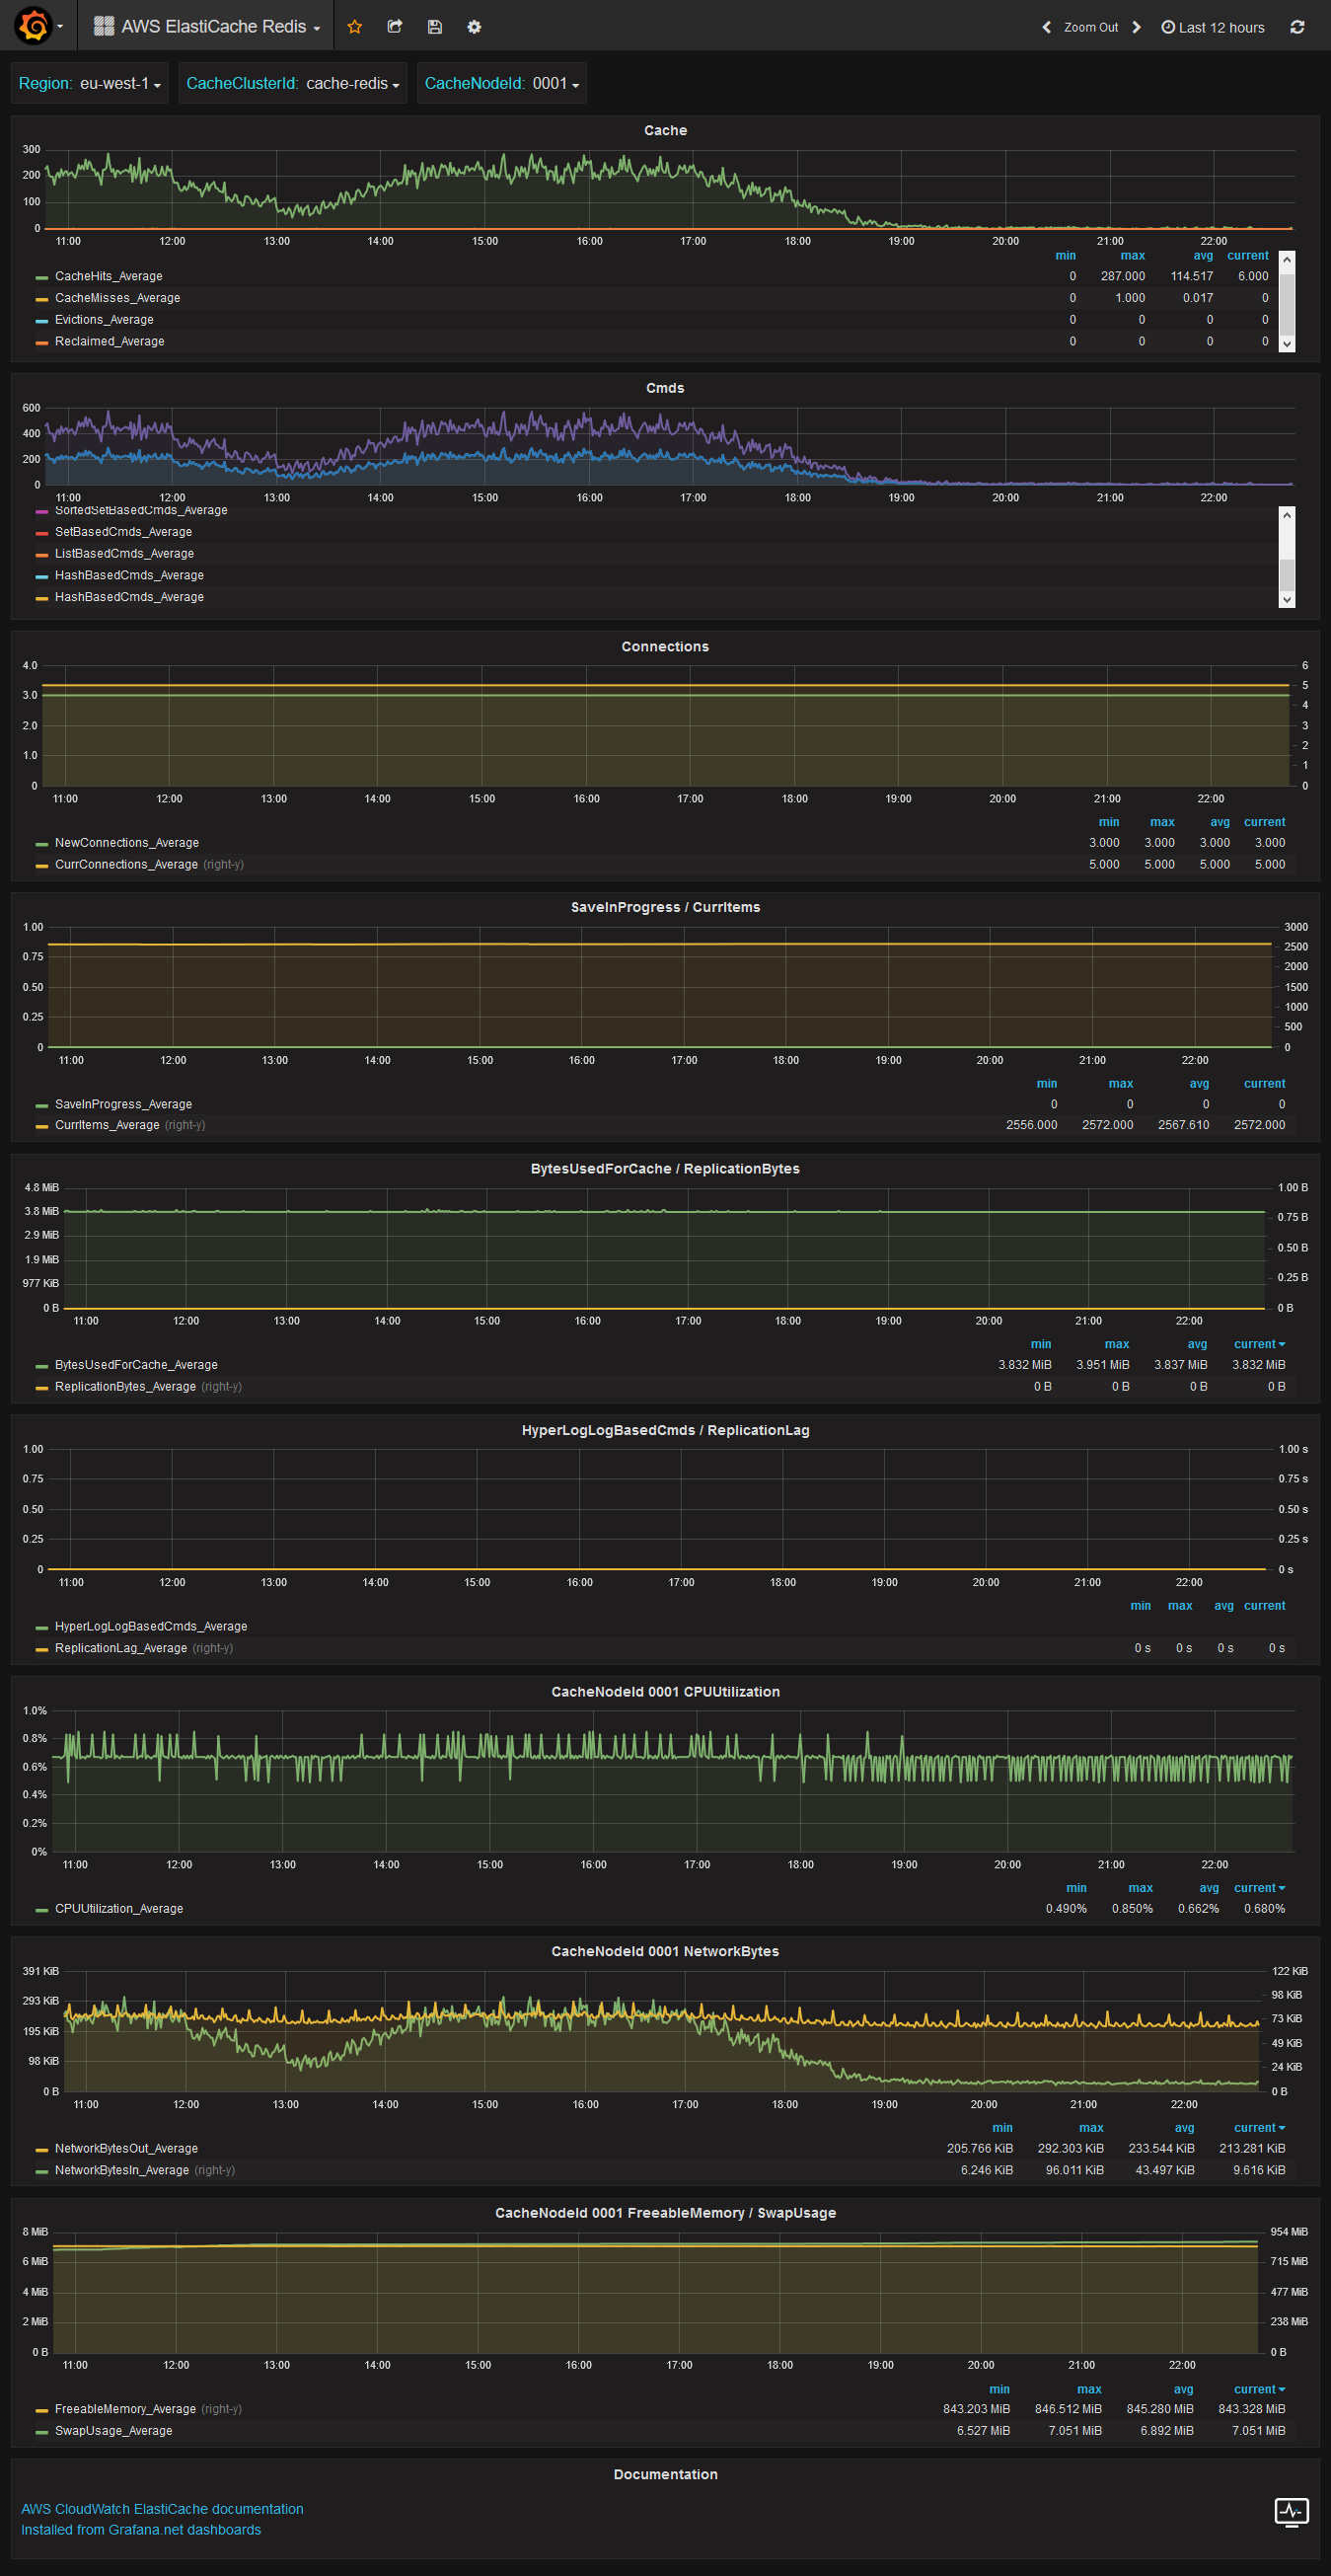
AWS ElastiCache Redis
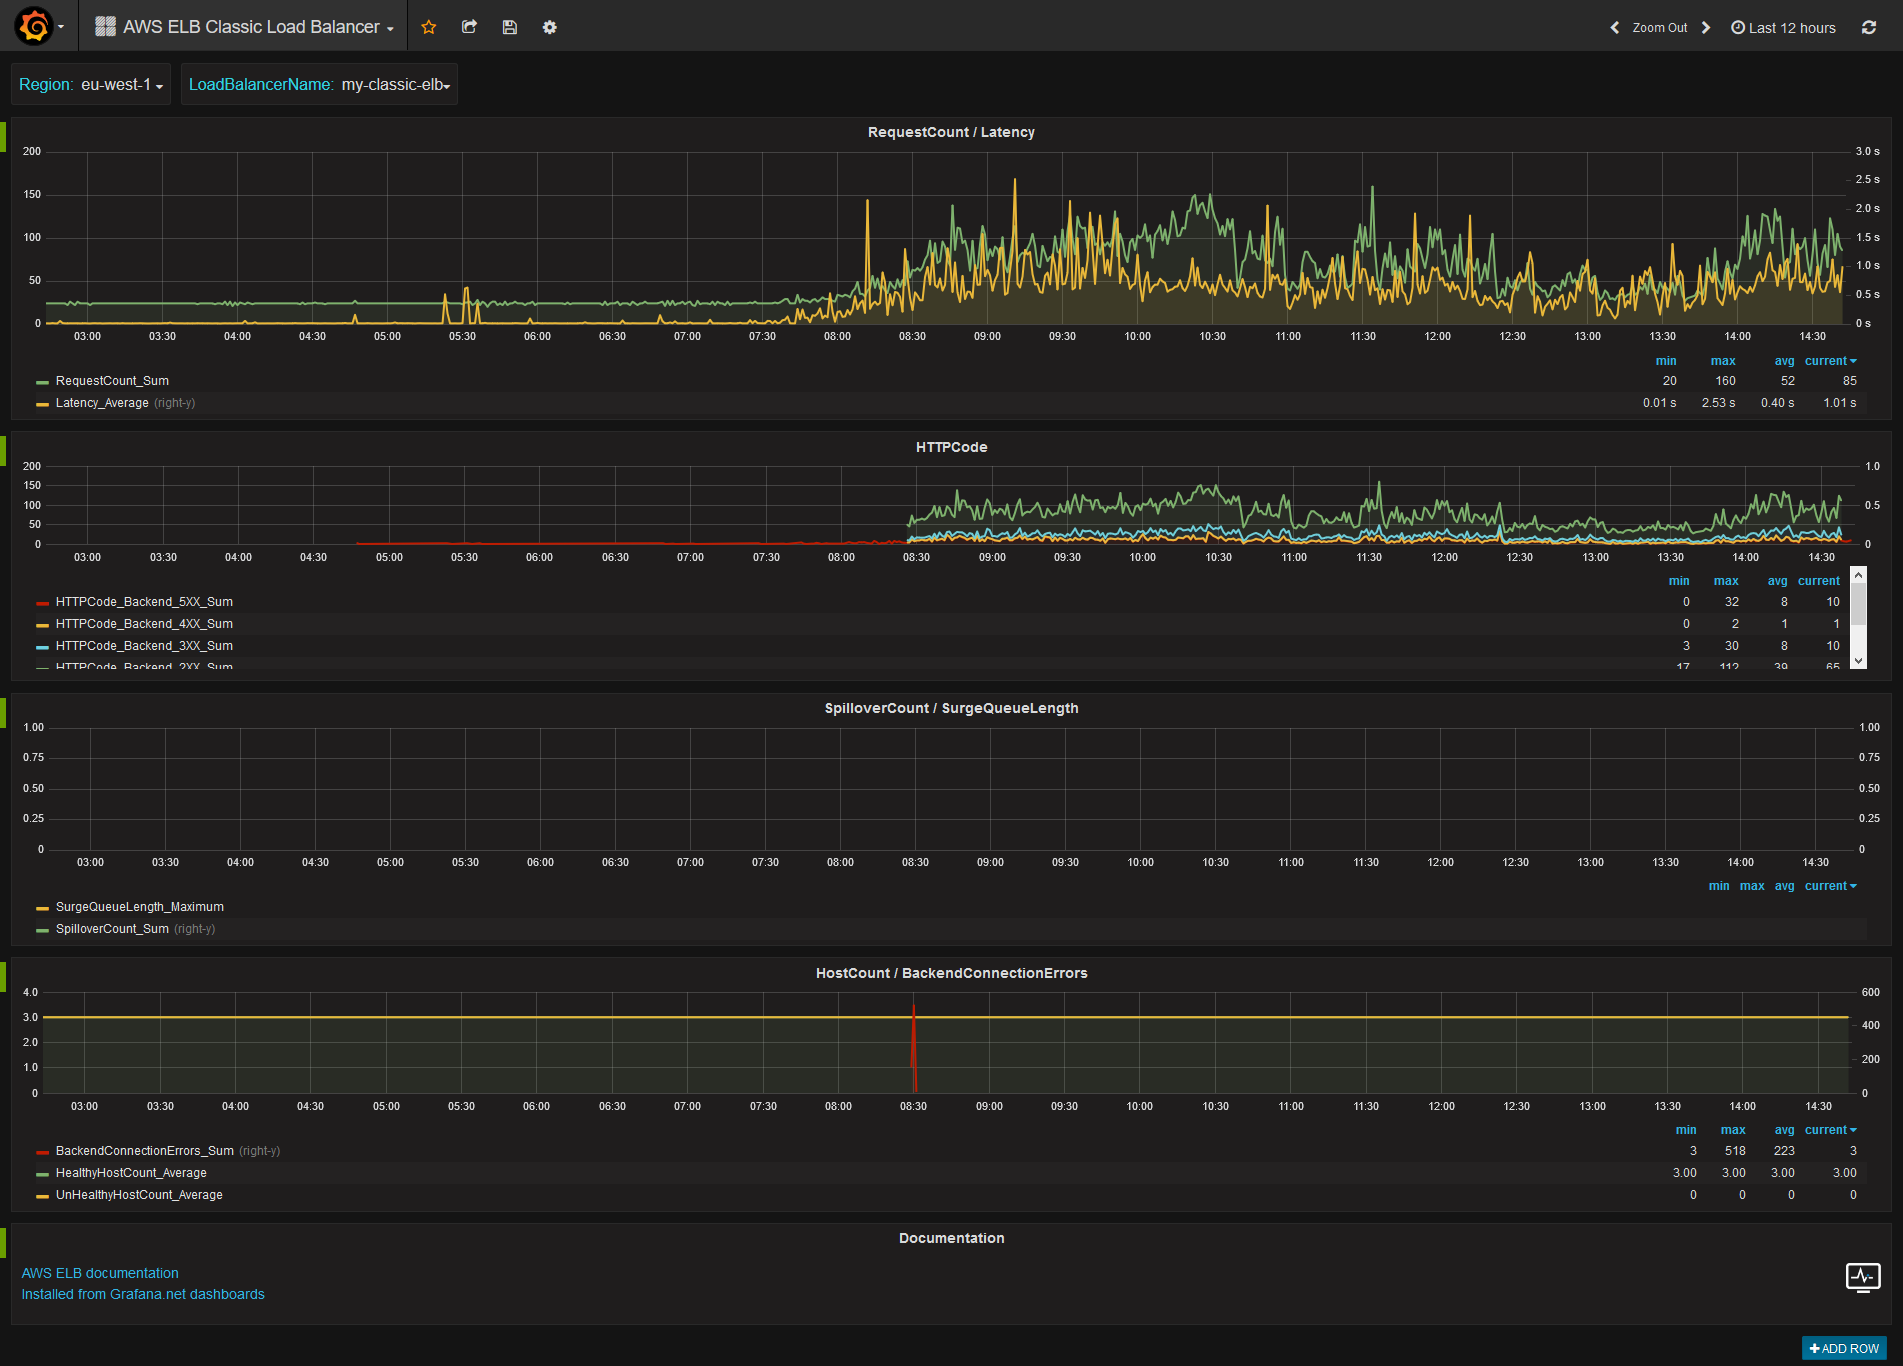
AWS ELB Classic Load Balancer
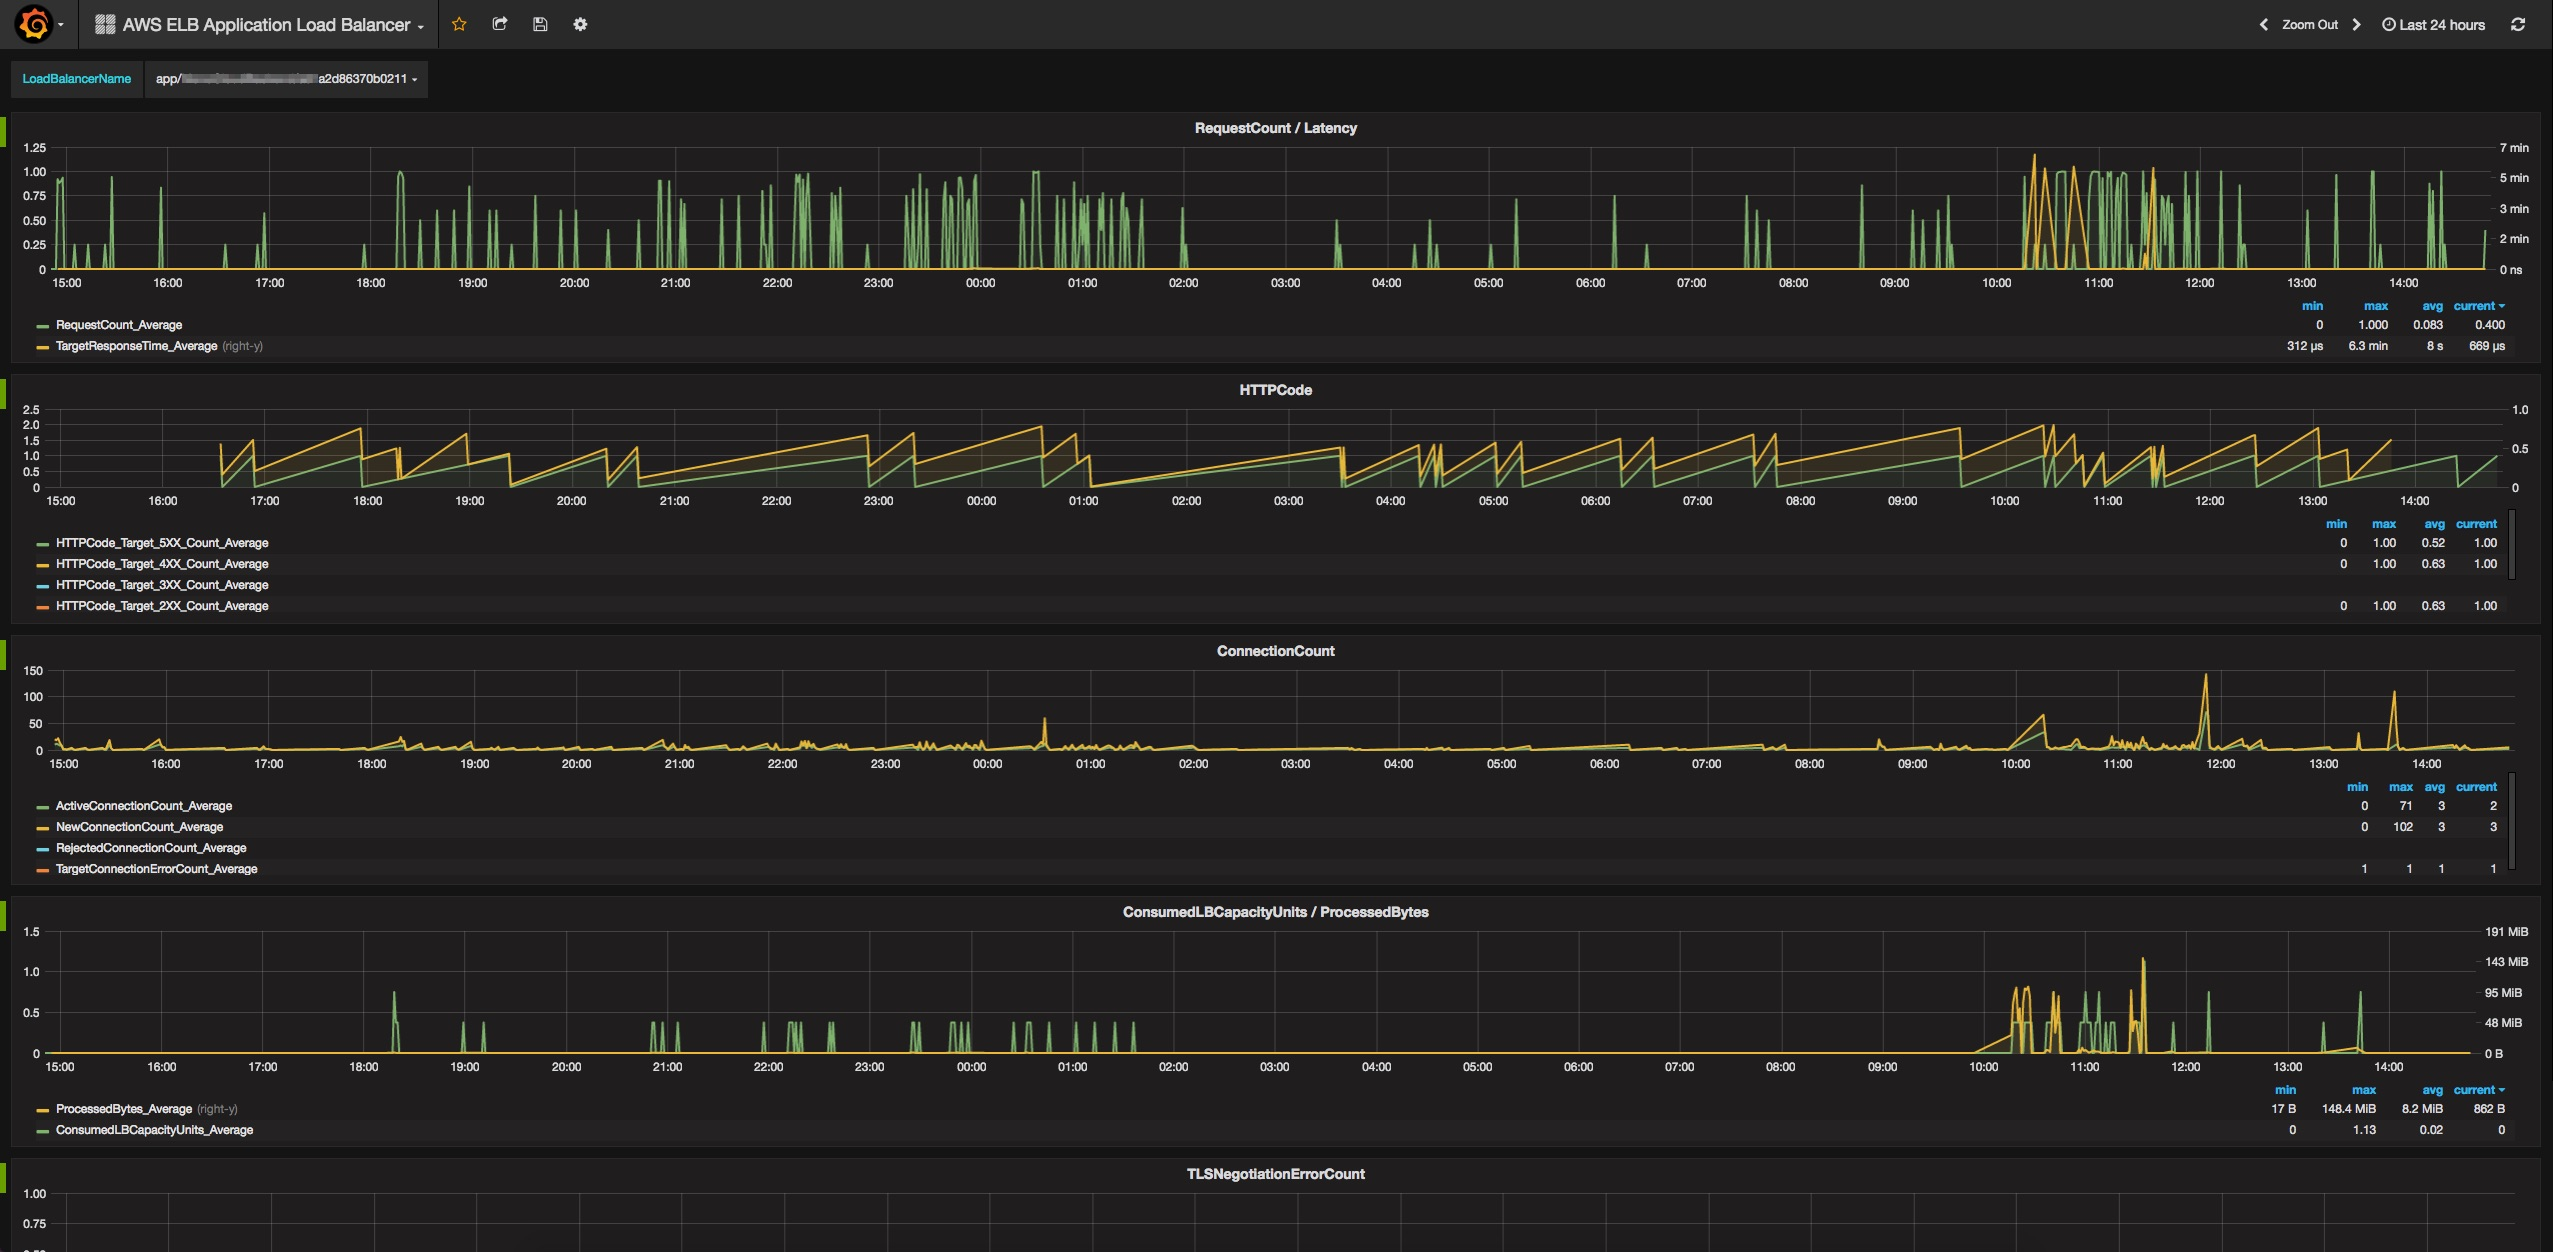
AWS ELB Application Load Balancer
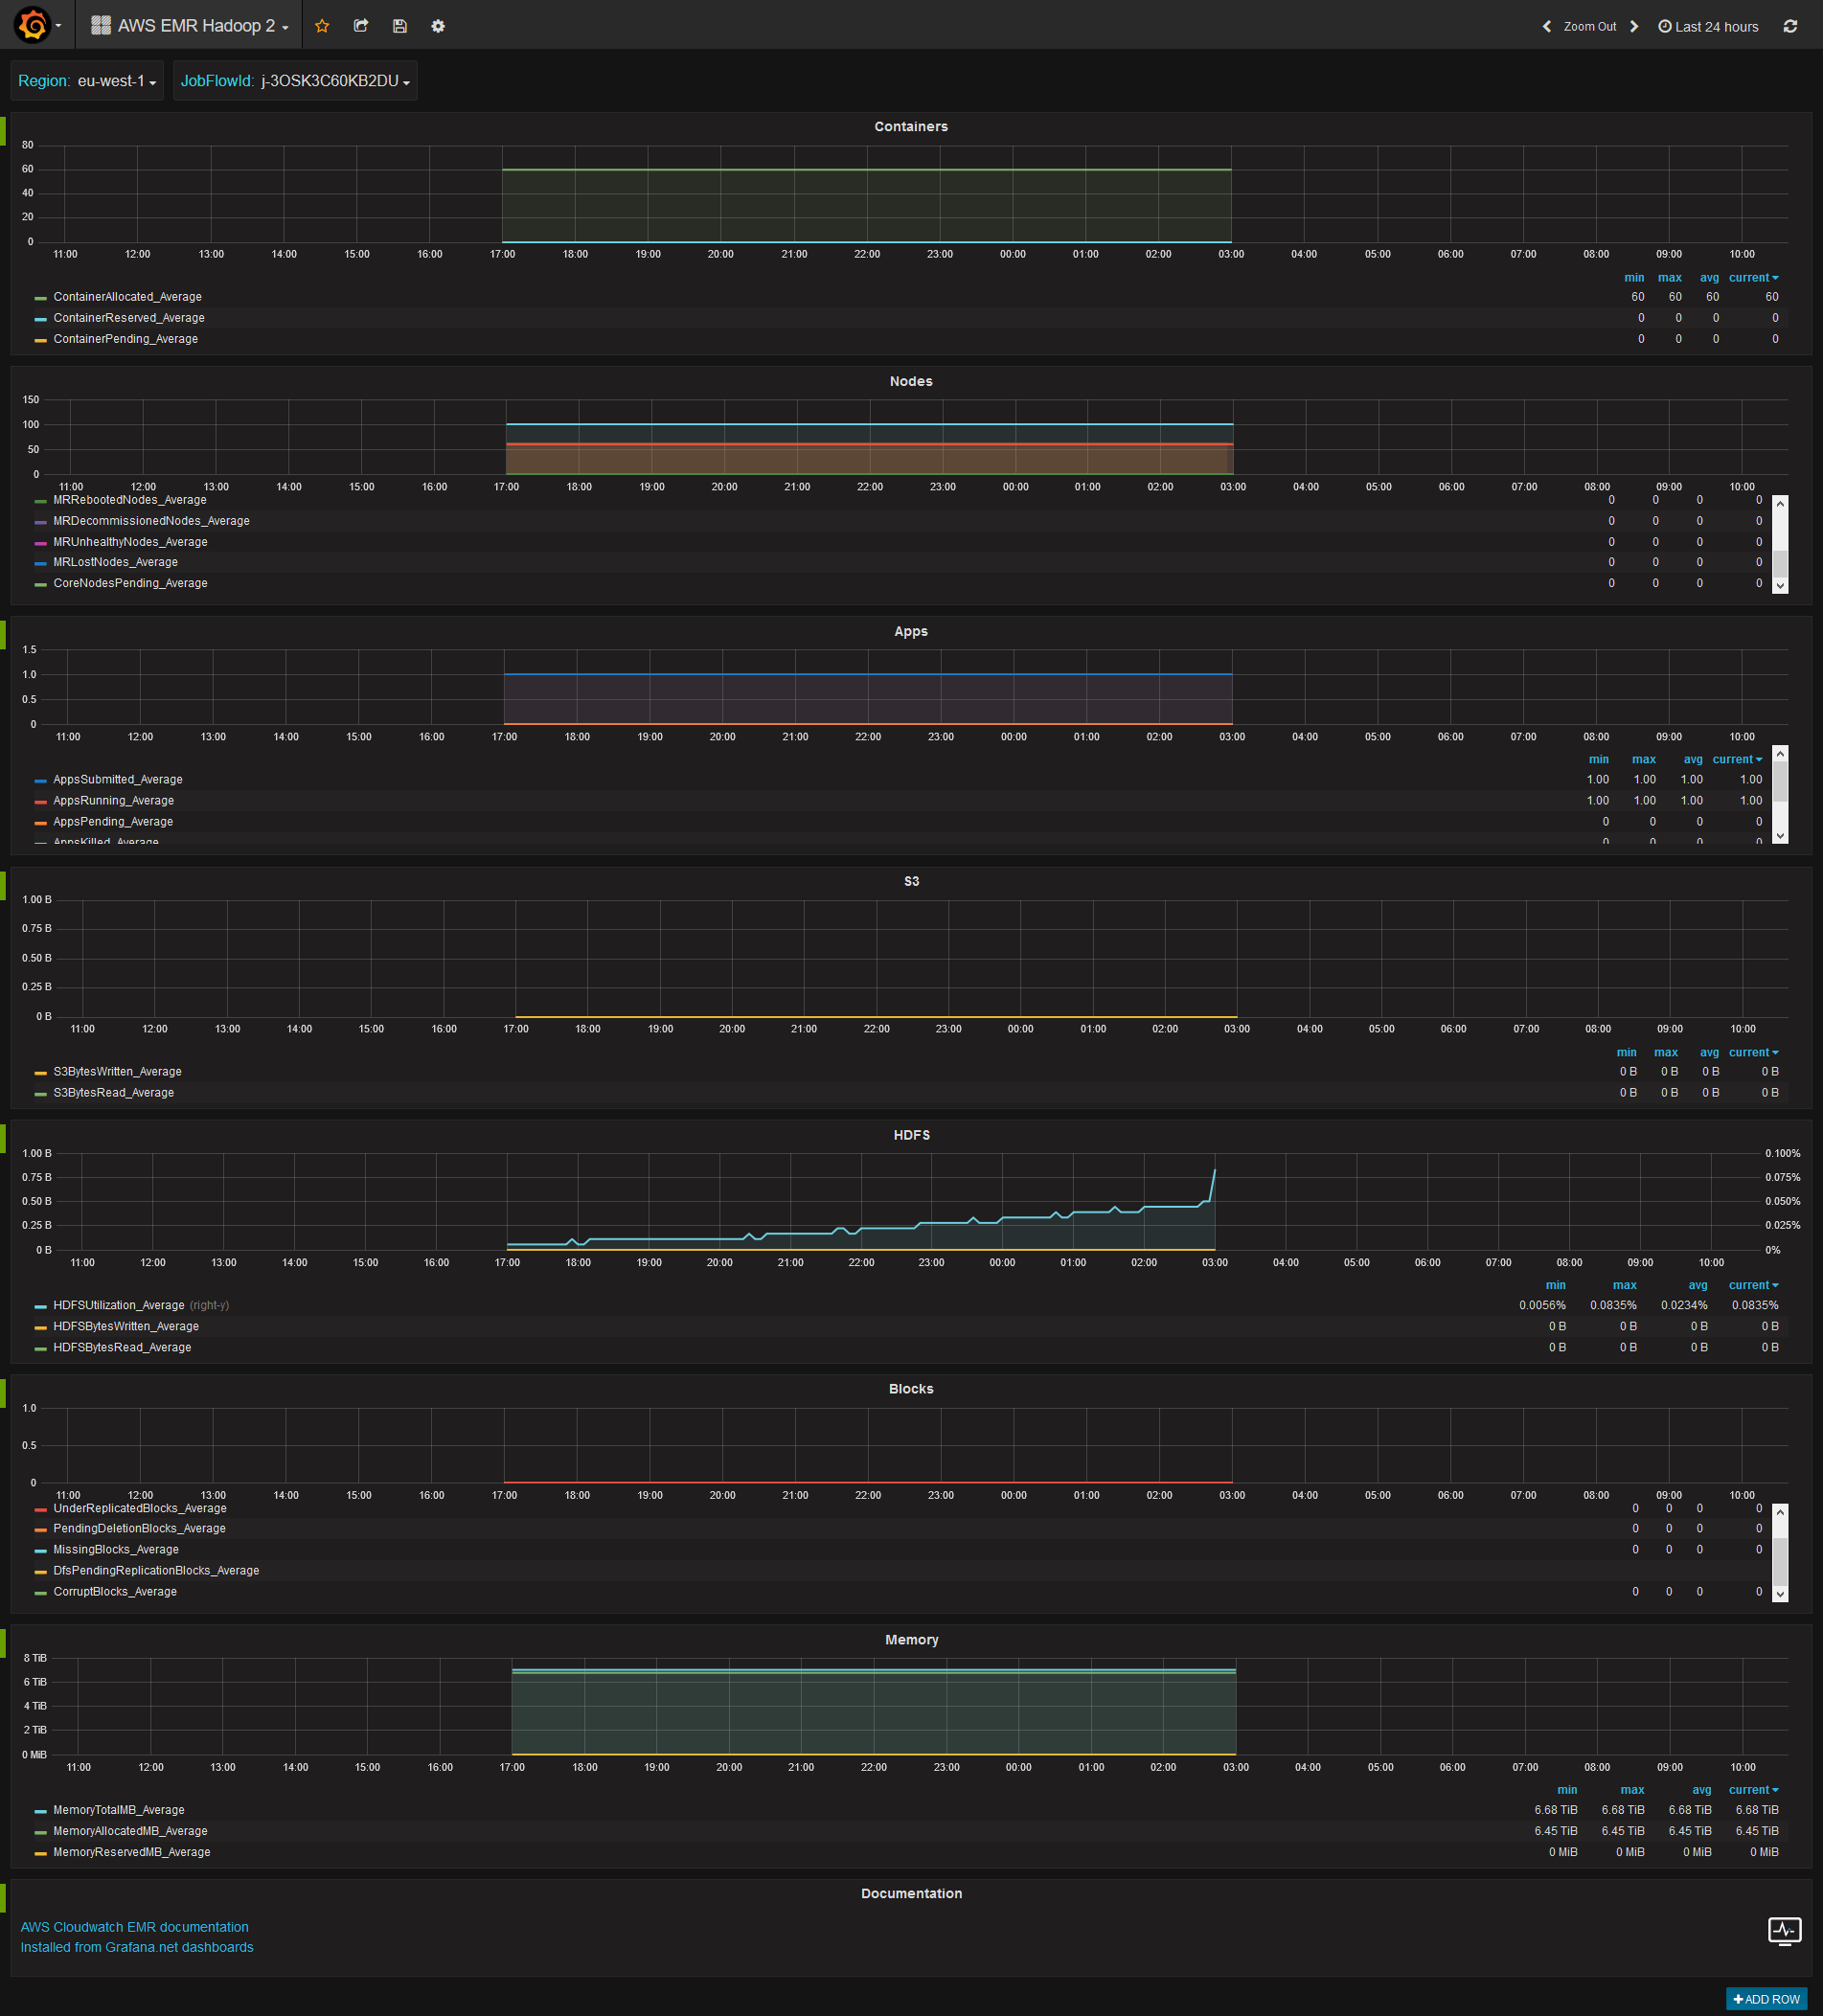
AWS EMR Hadoop 2
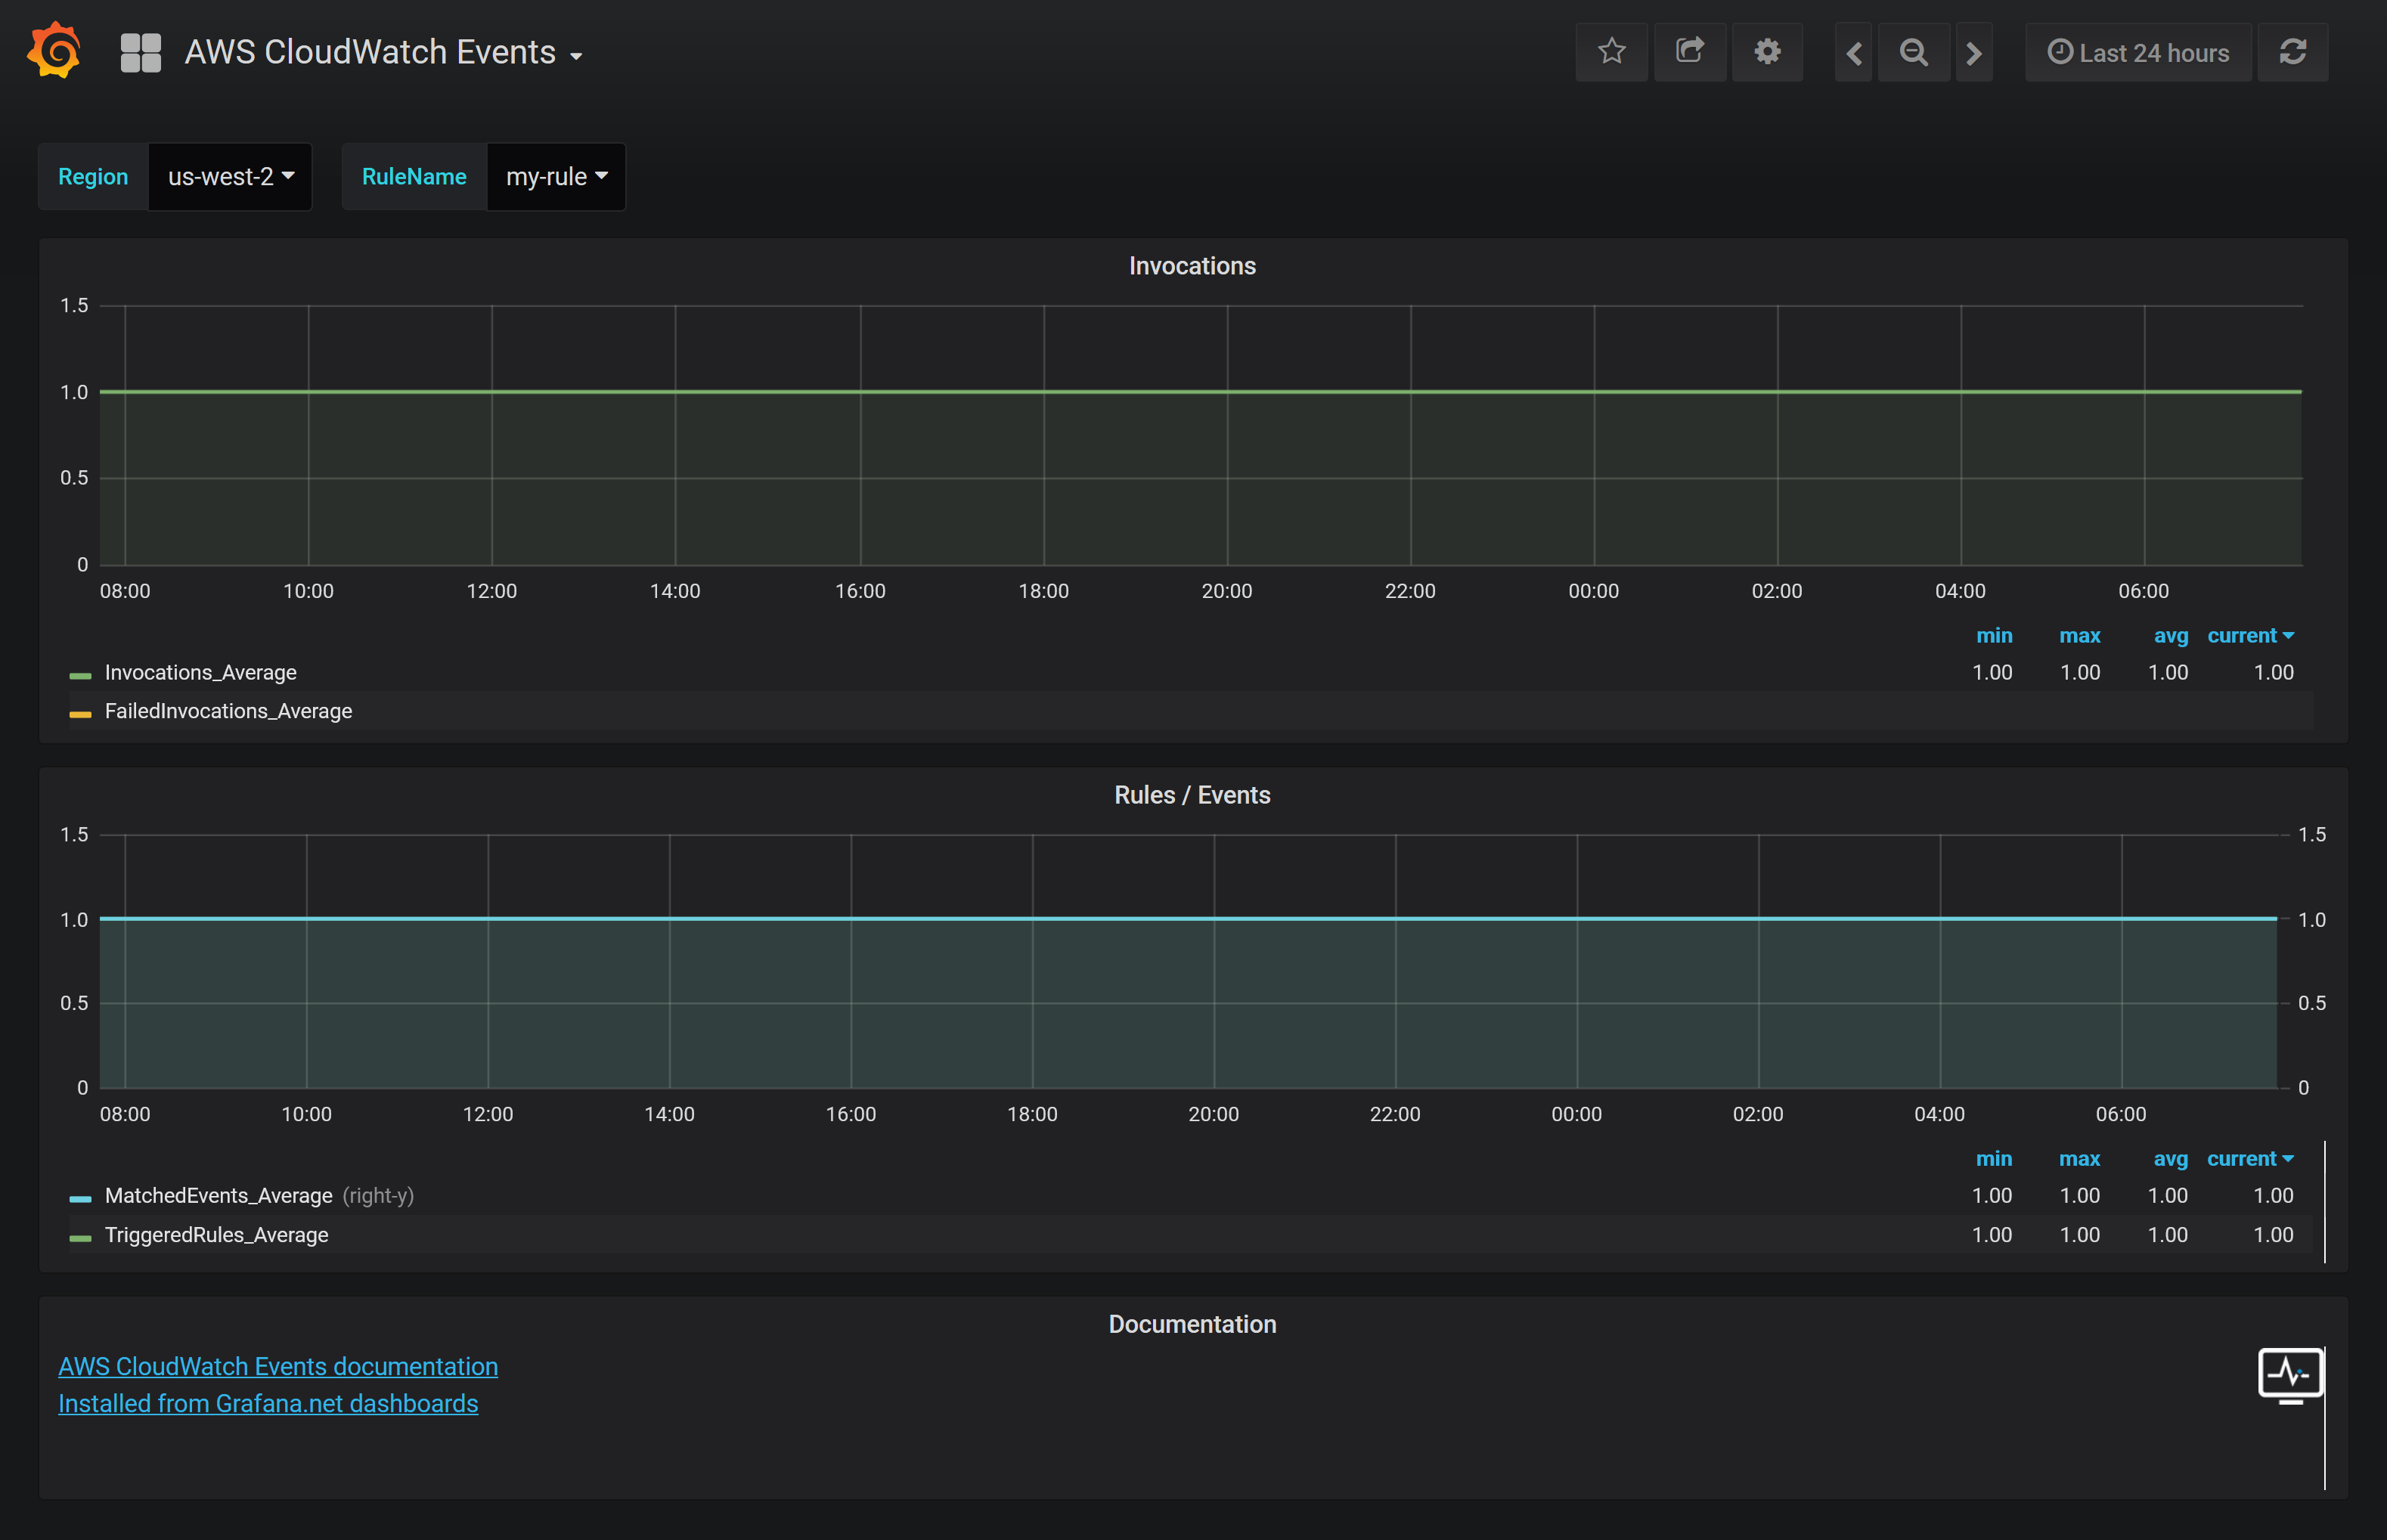
AWS Events
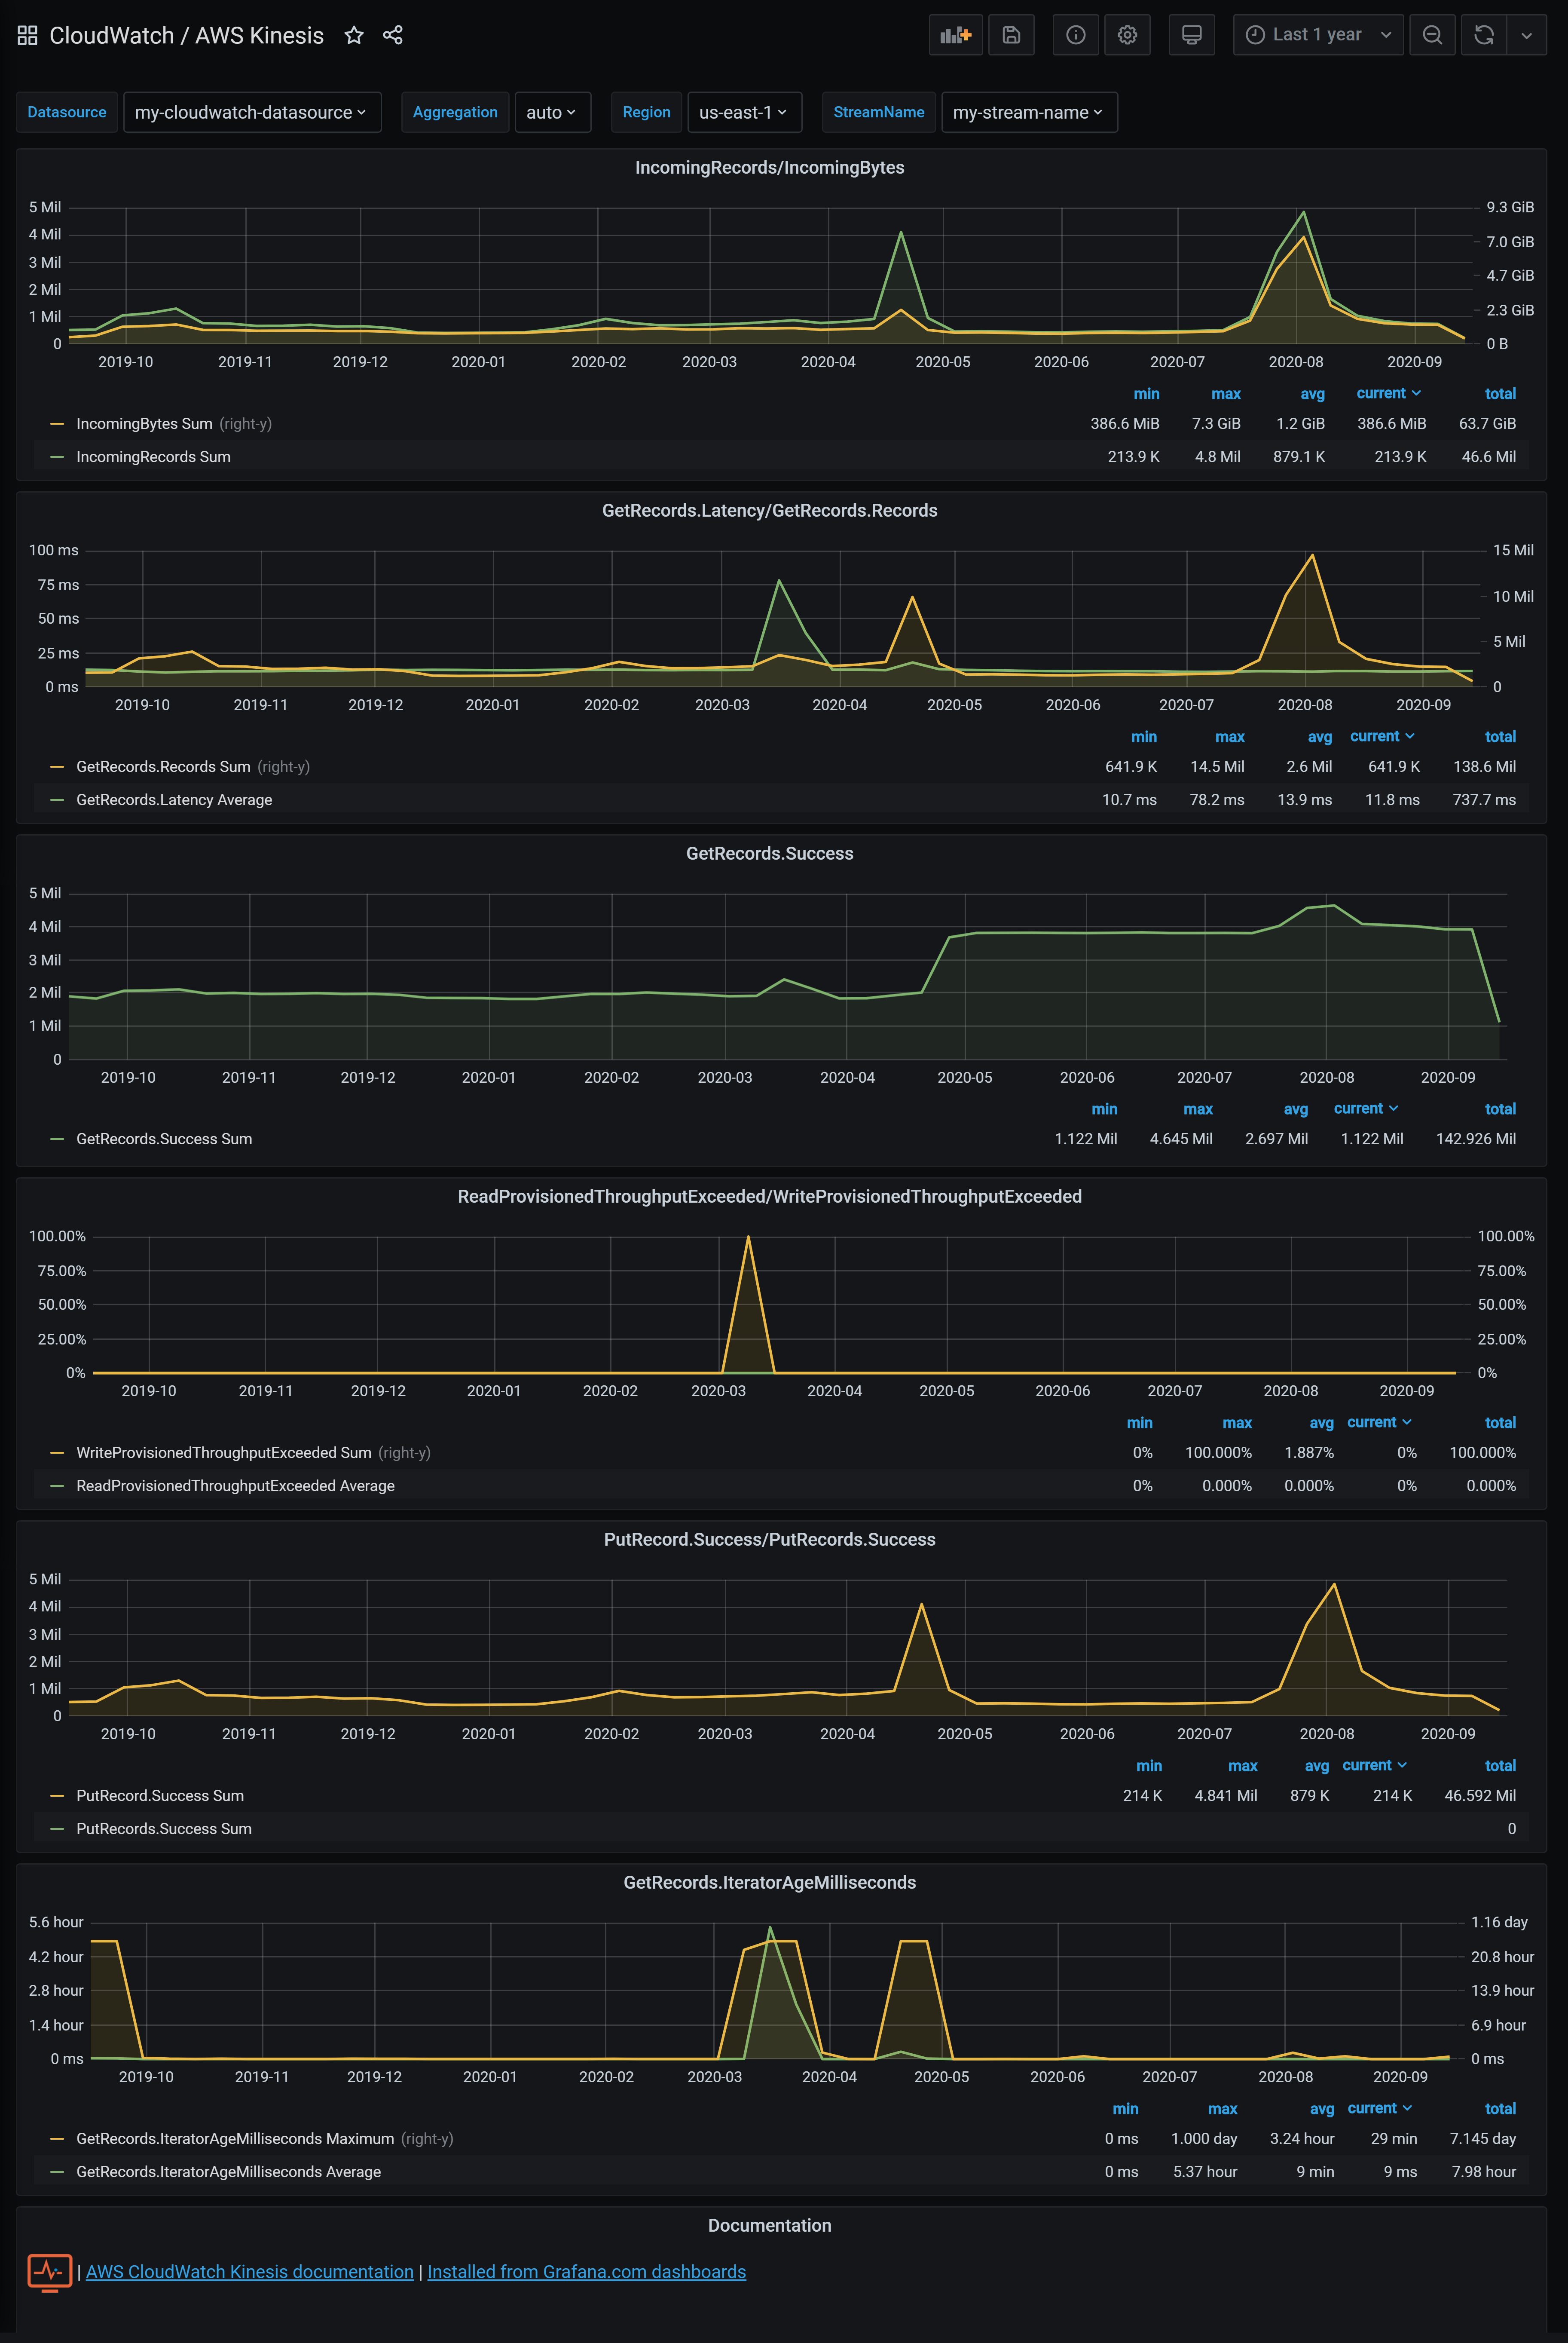
AWS Kinesis
AWS Lambda
AWS Logs
AWS RDS
AWS Redshift
AWS Route 53
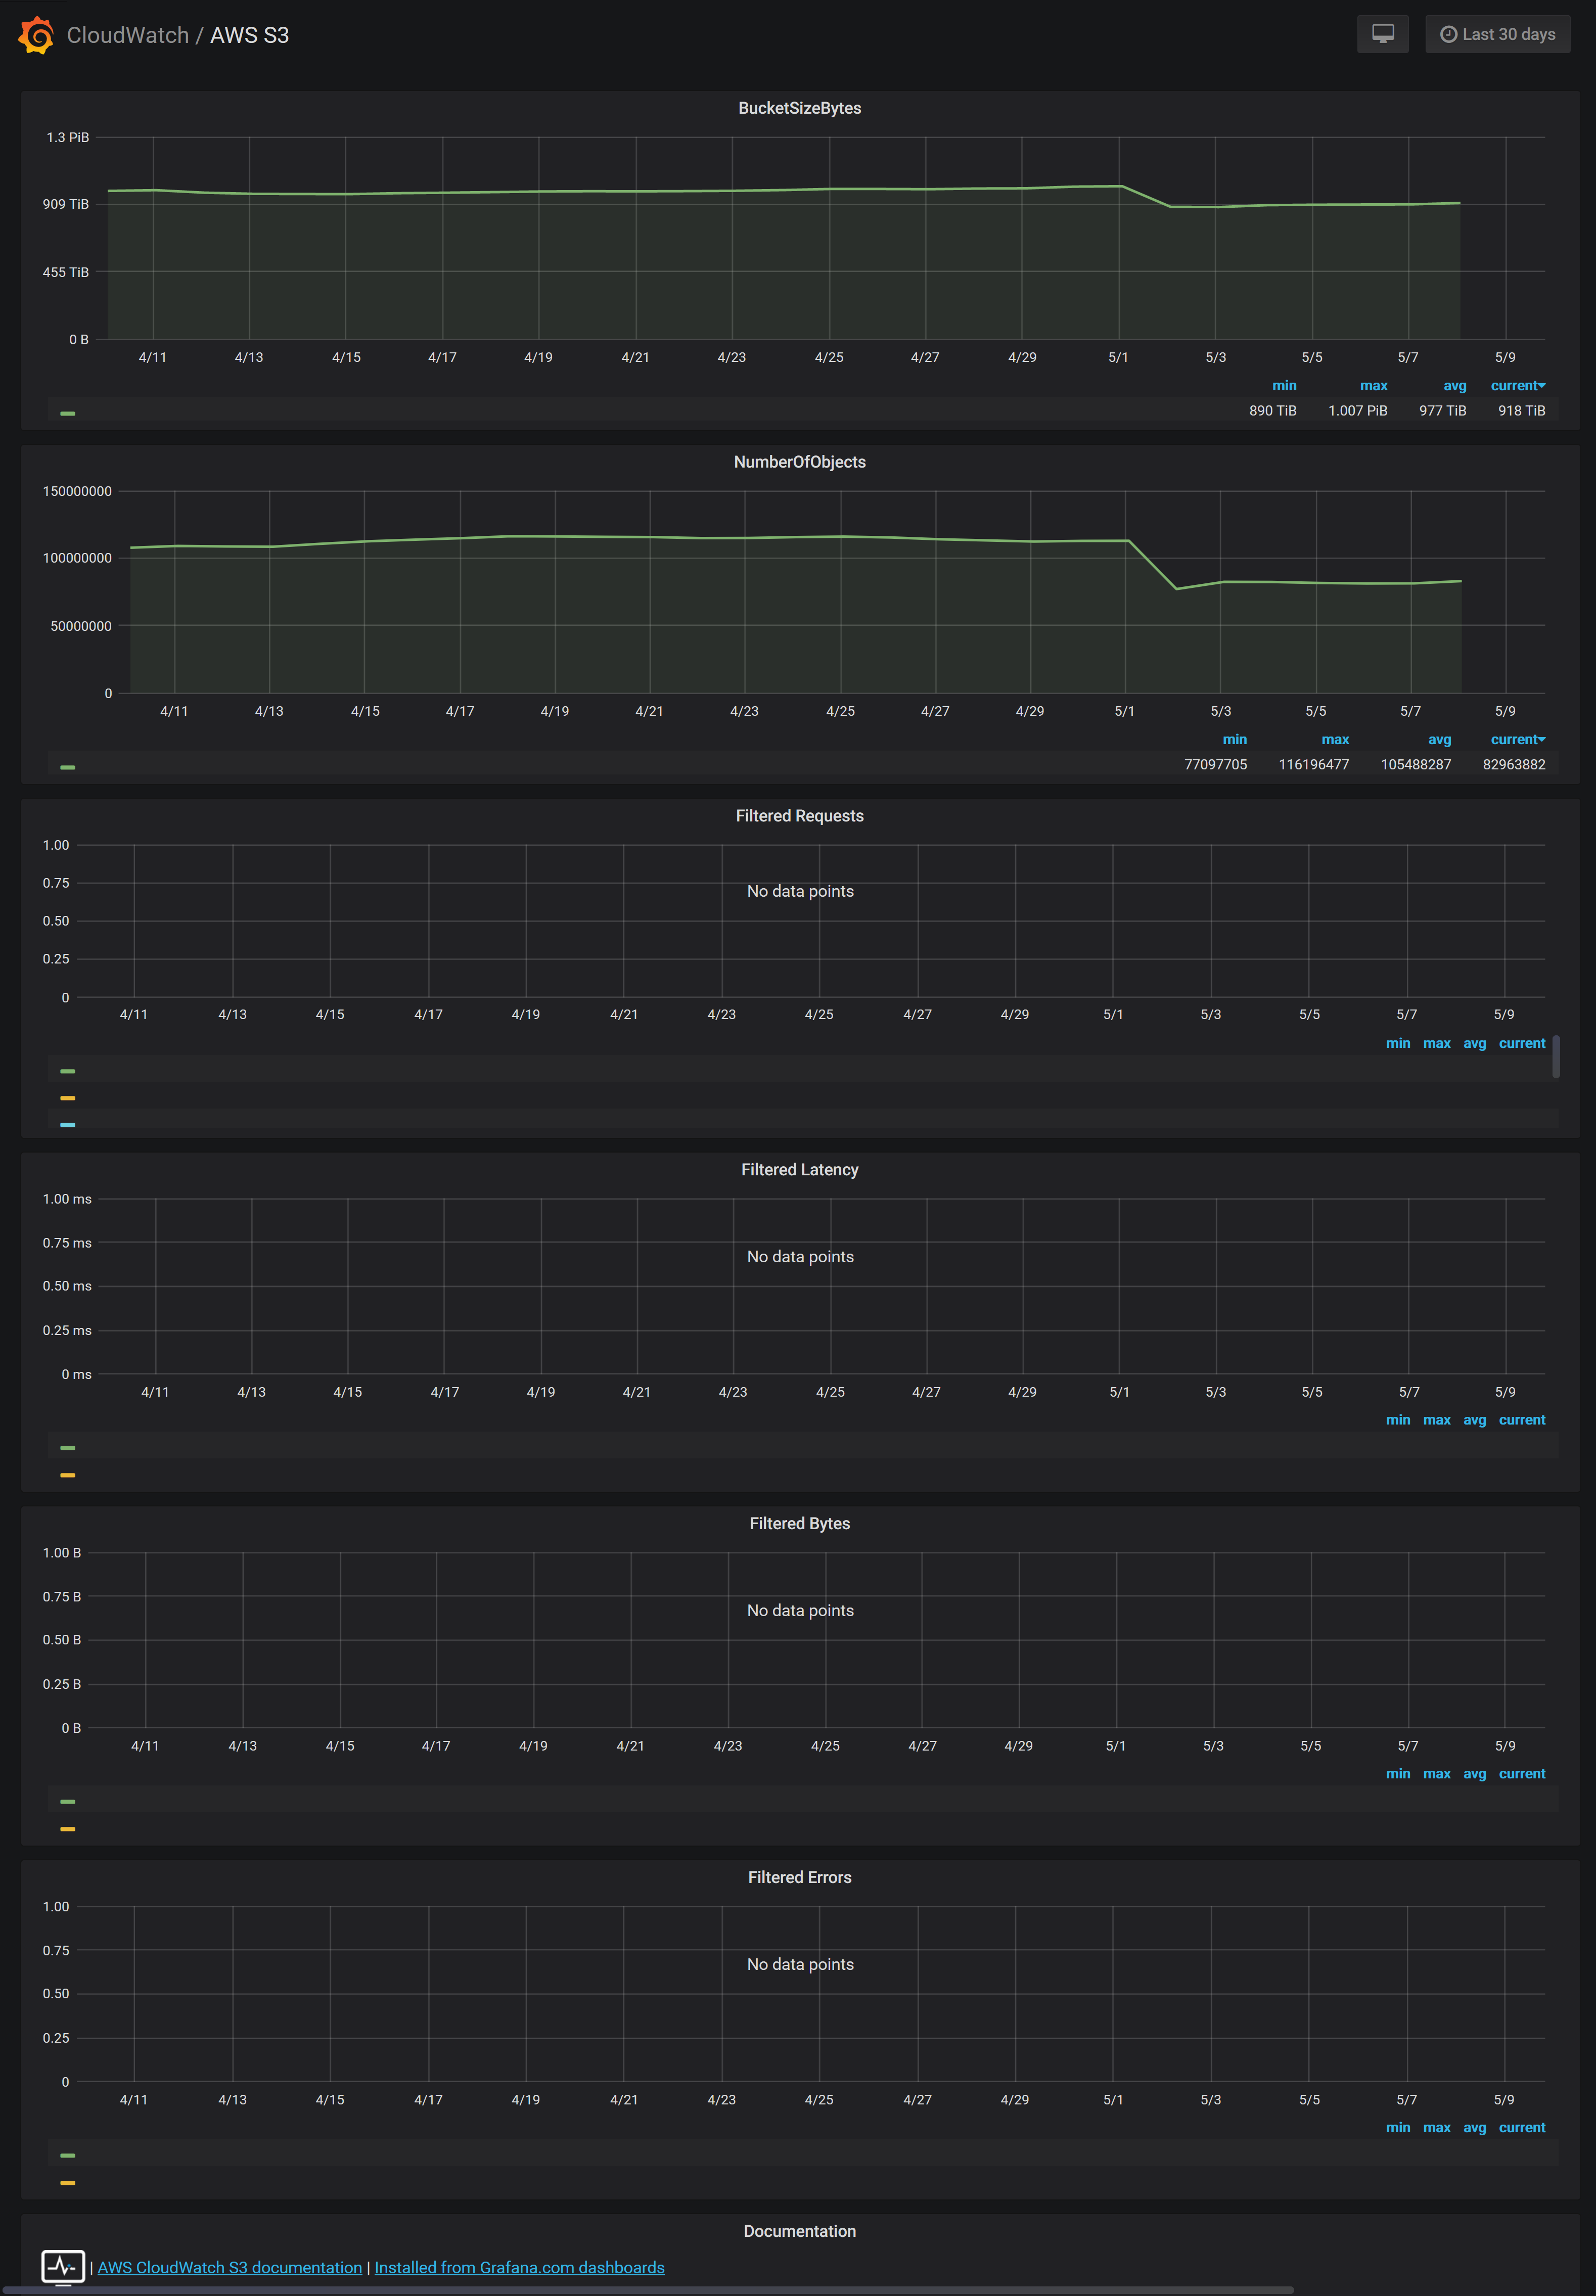
AWS S3
AWS SES
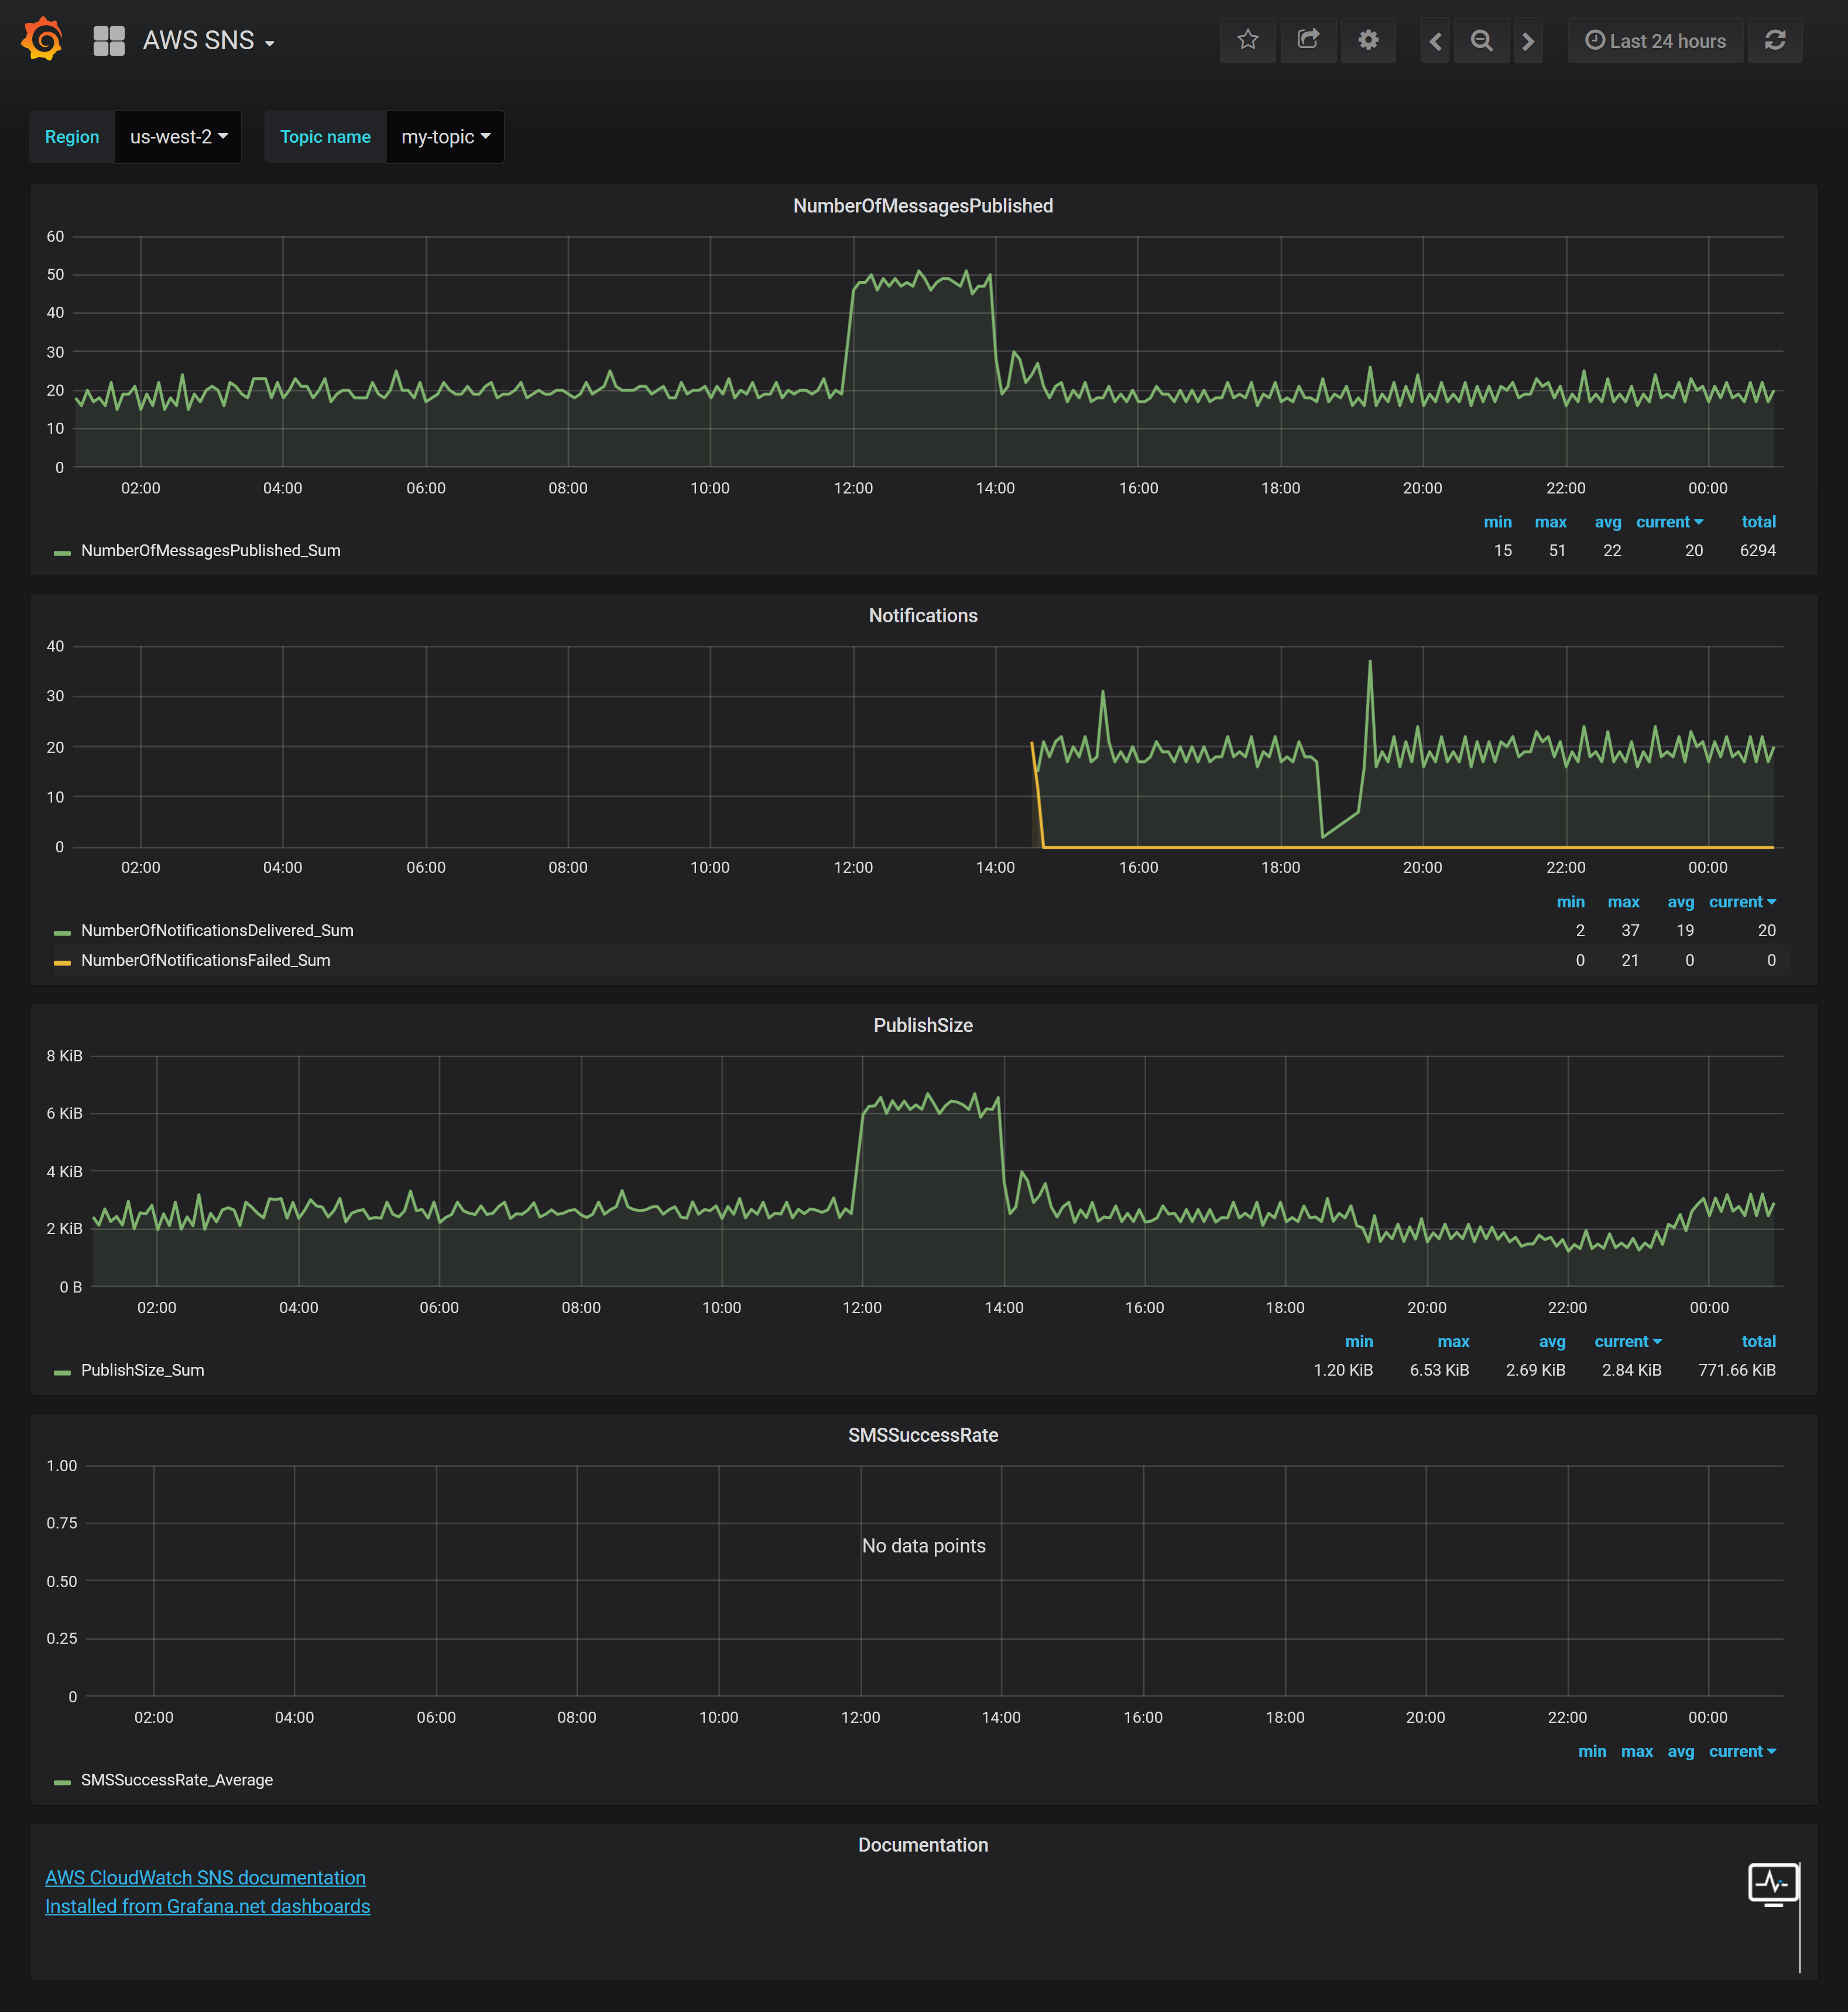
AWS SNS
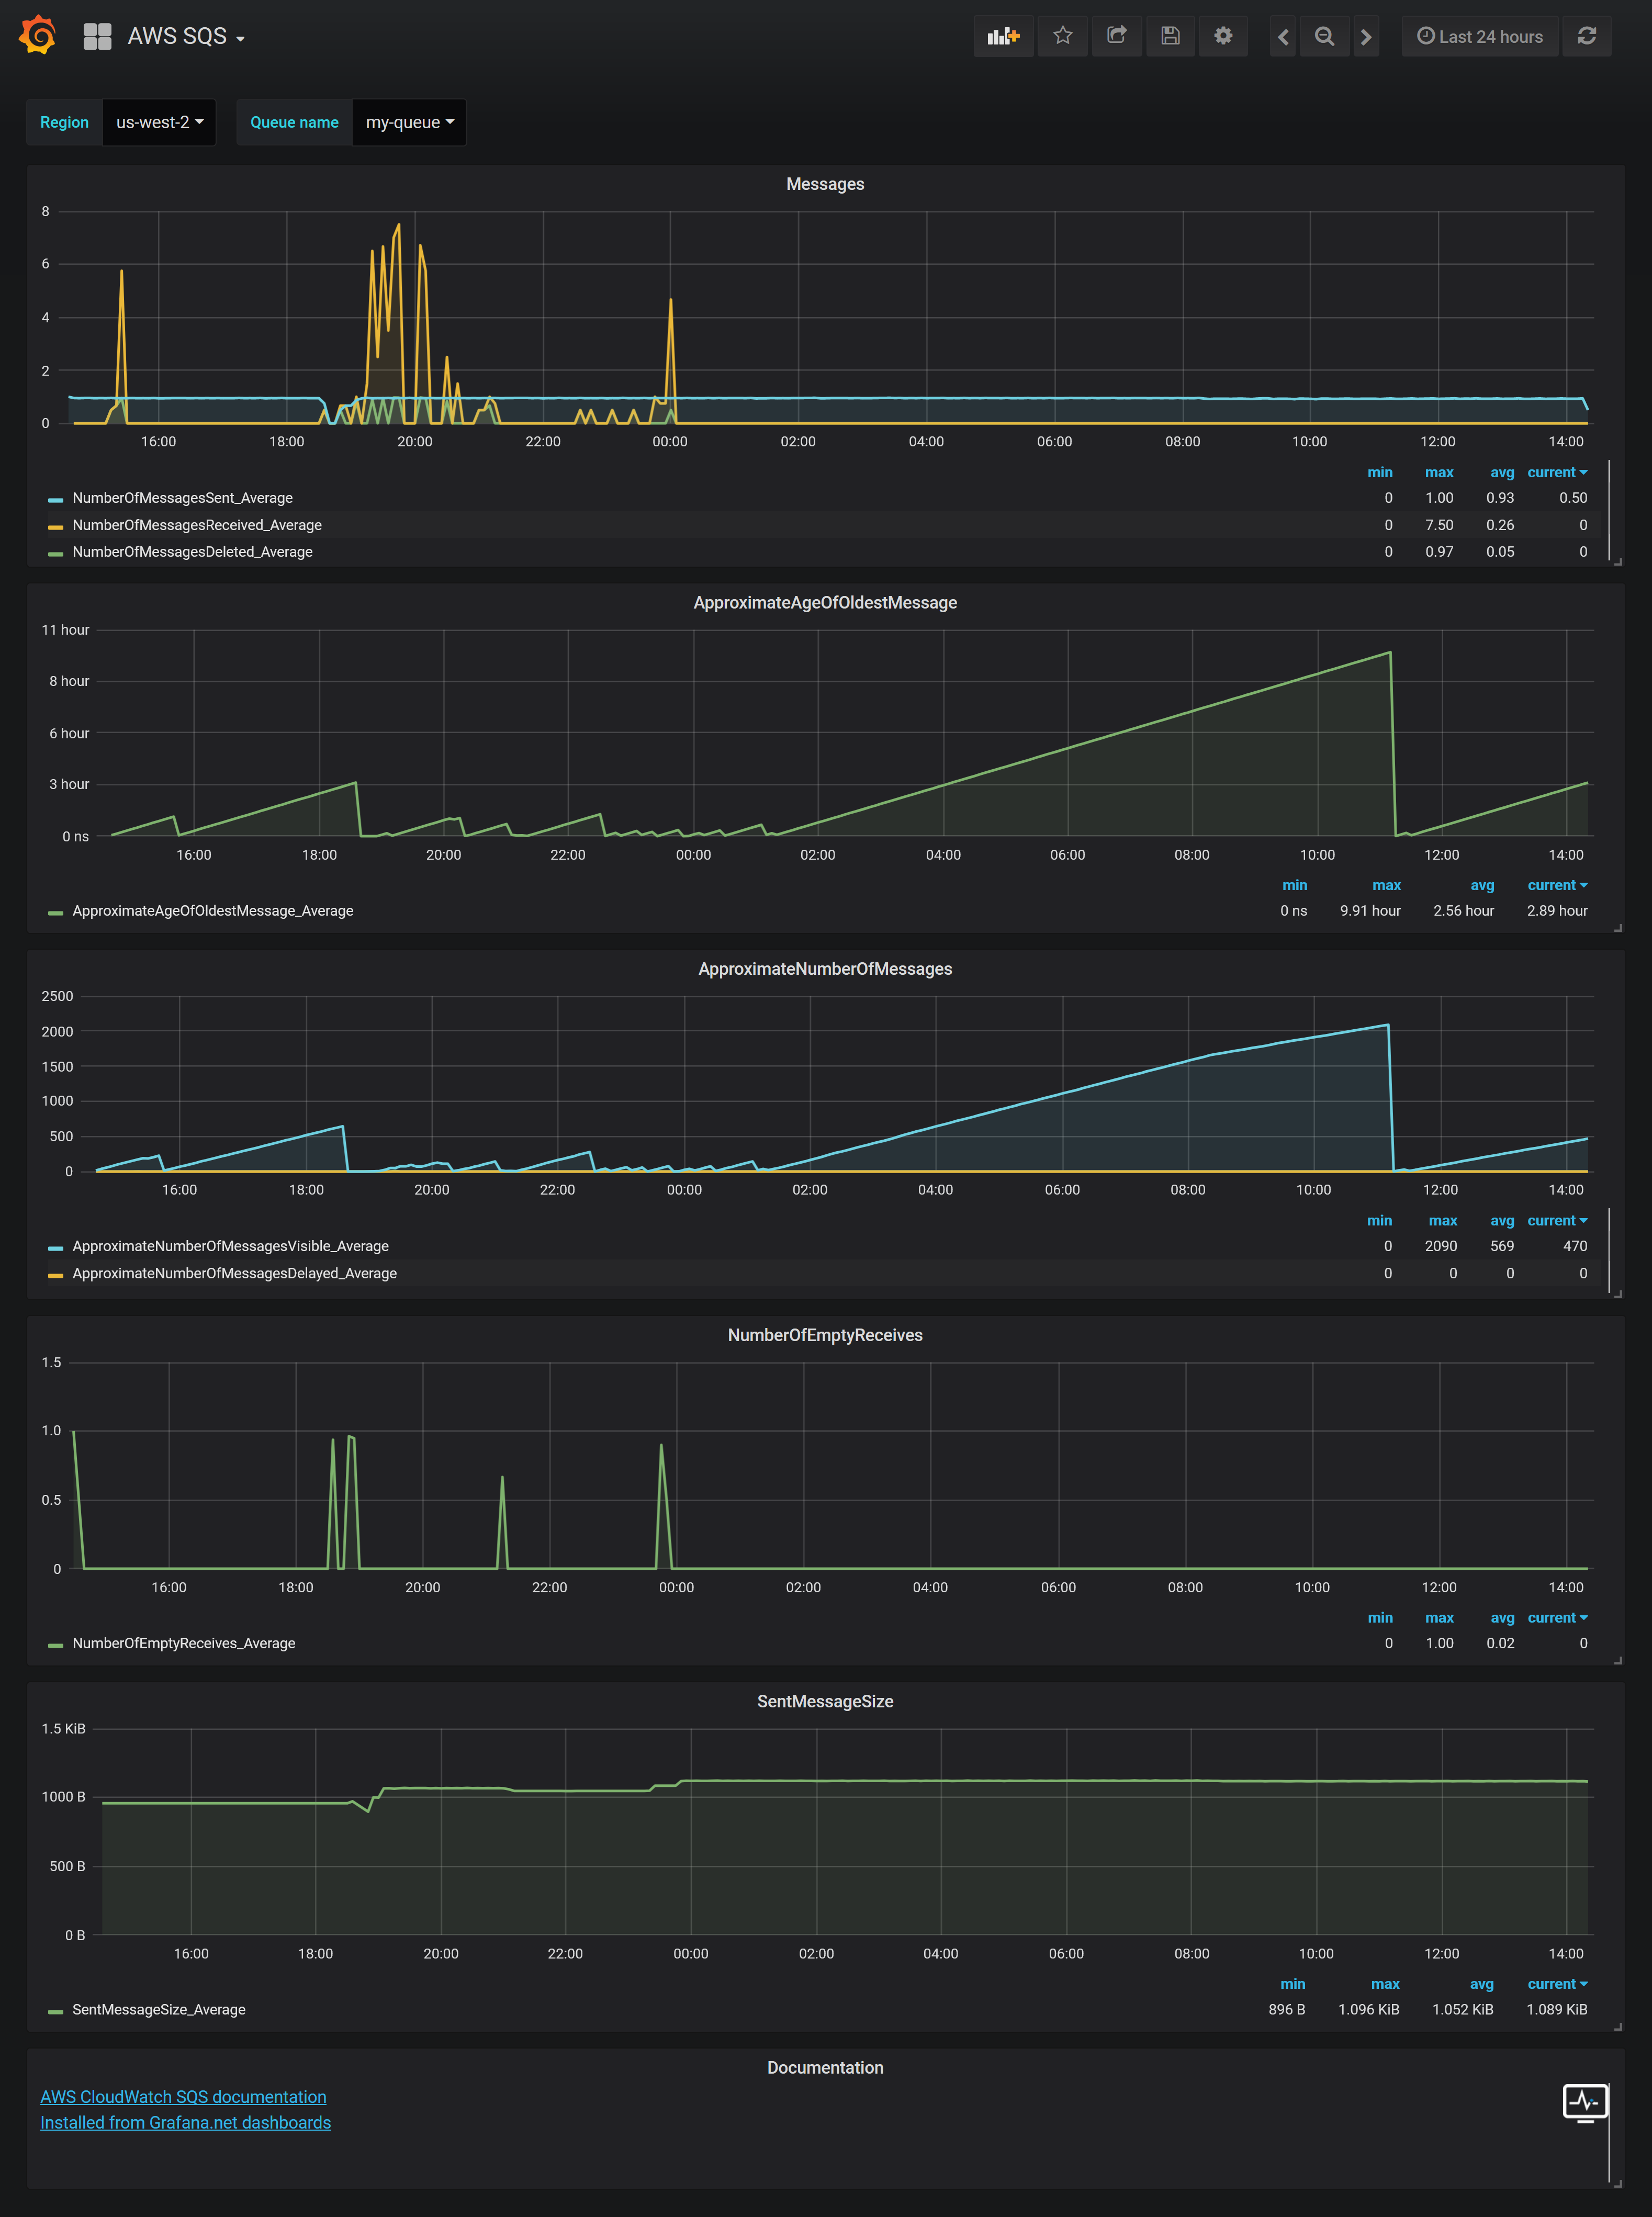
AWS SQS
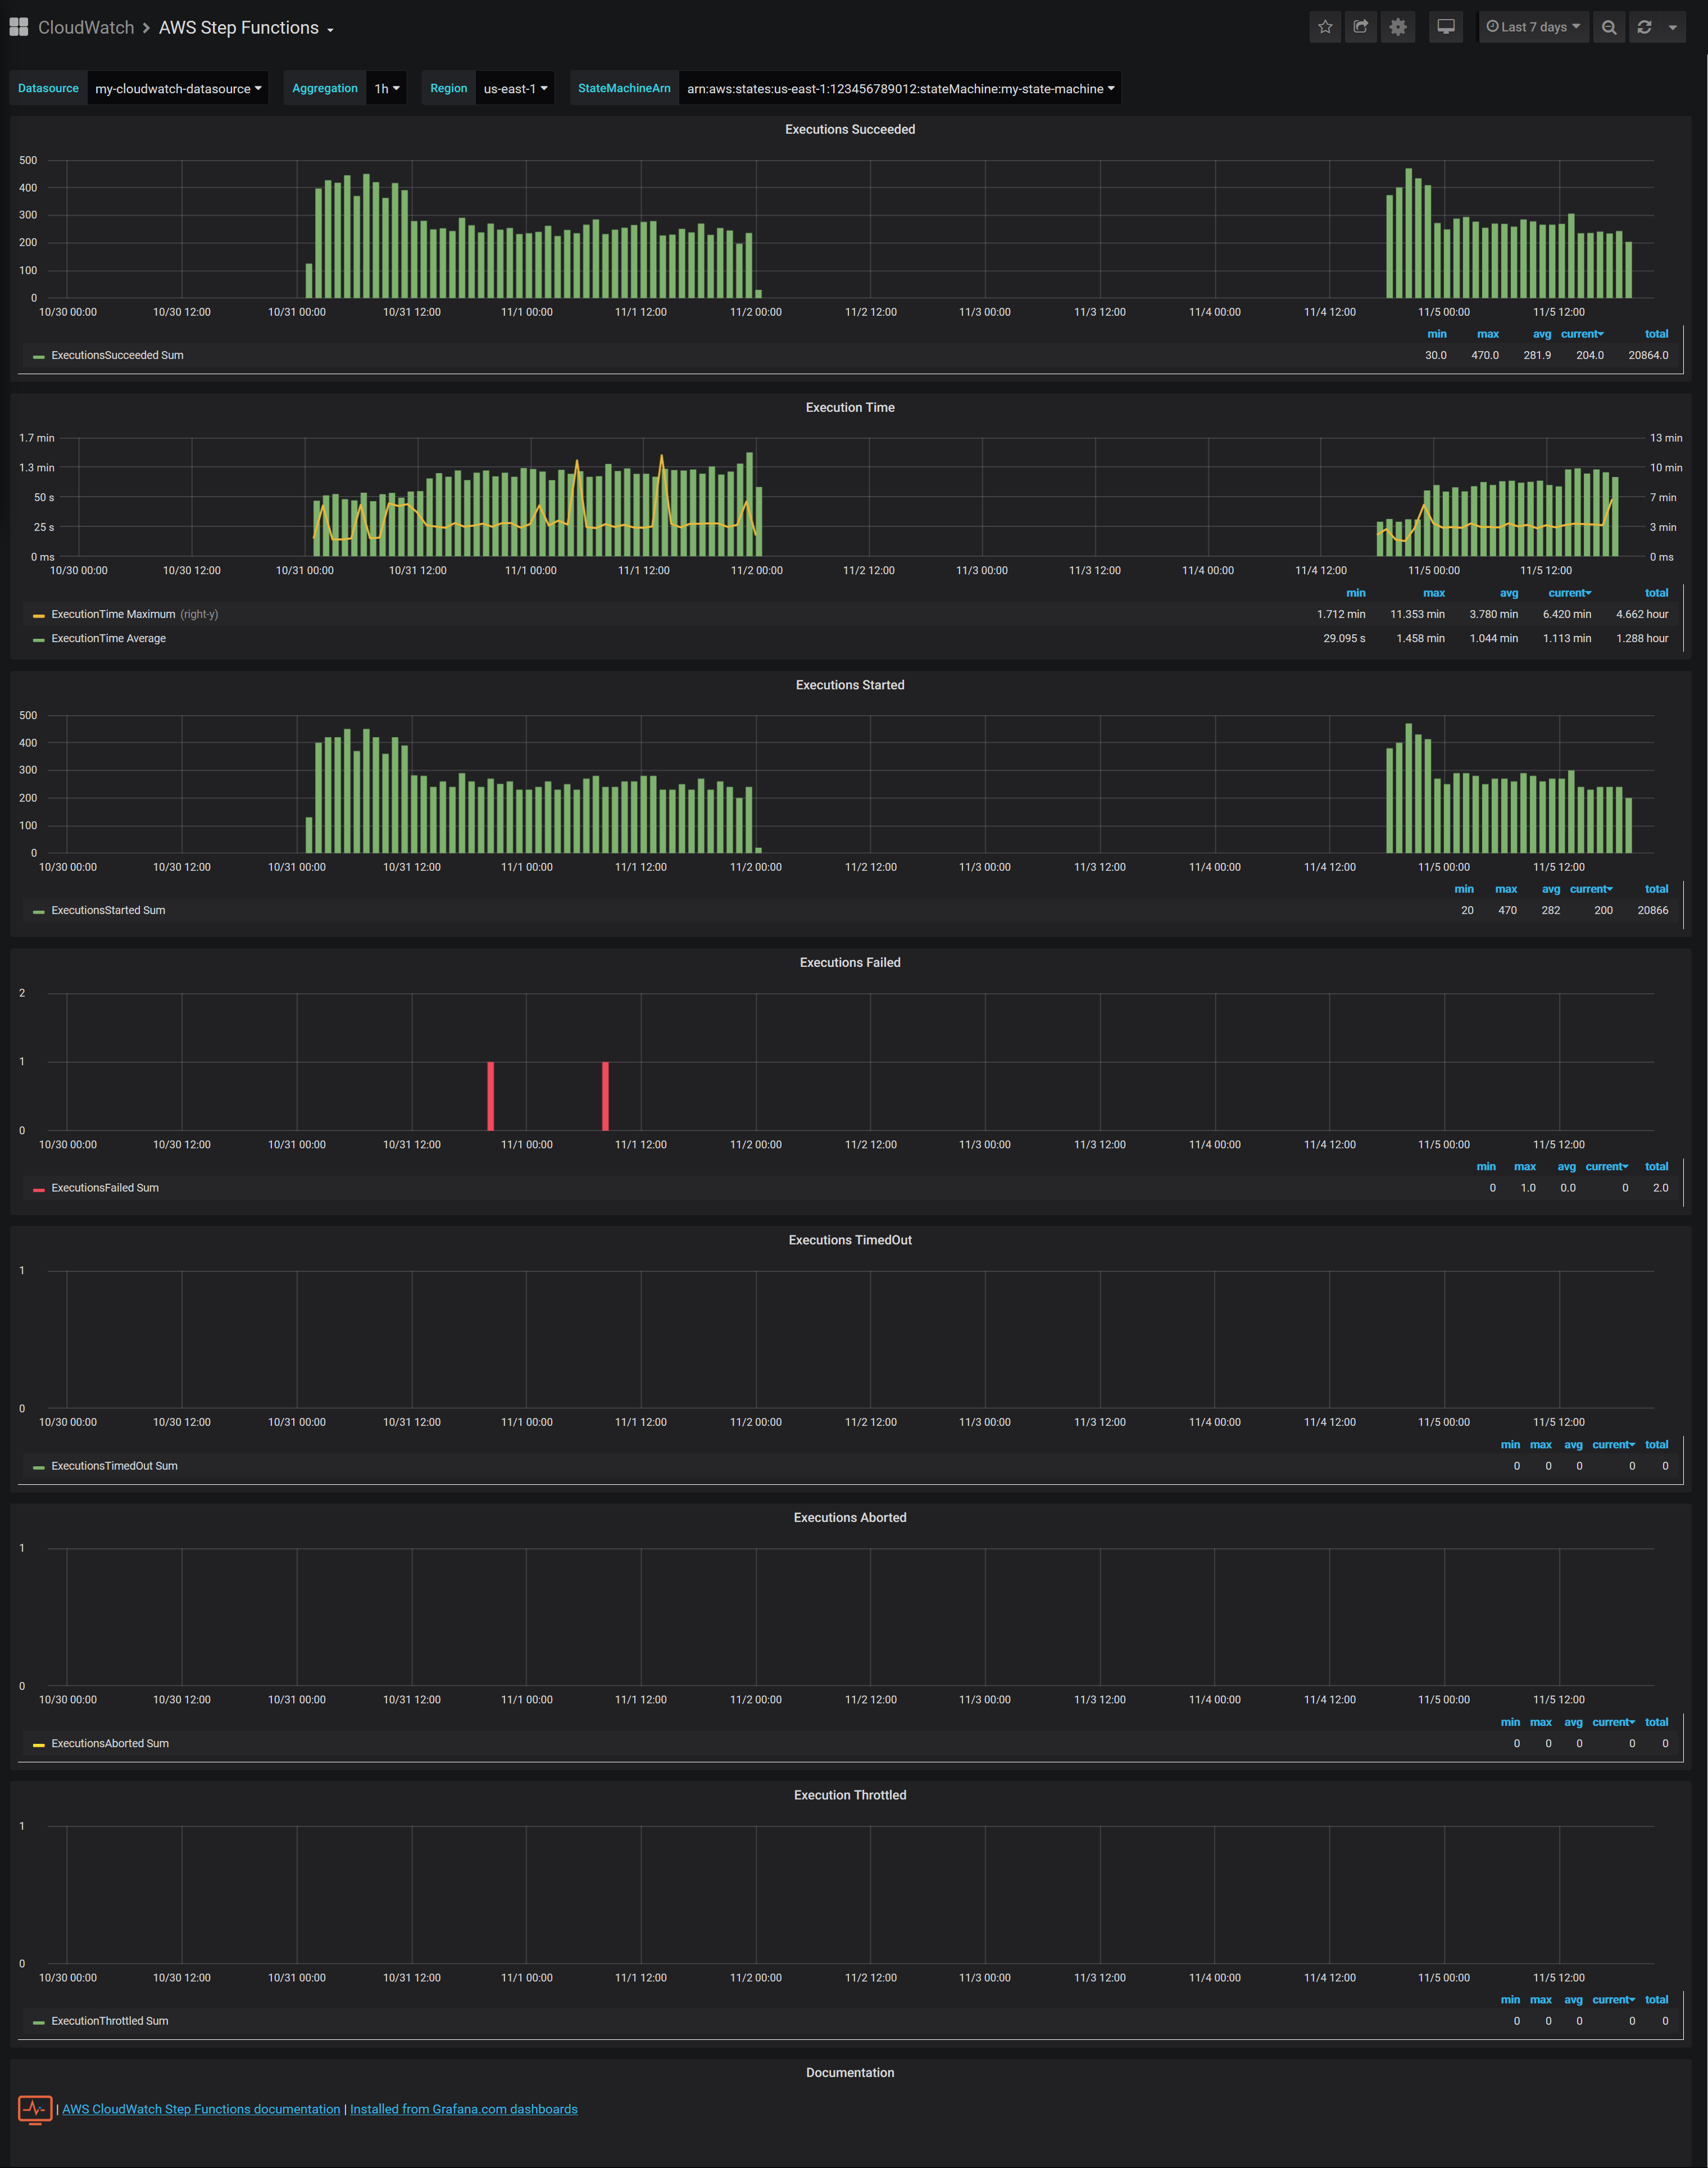
AWS Step Functions
AWS Storage Gateway
AWS VPN
Author
Devops Monitoring Expert, who loves monitoring systems and cutting/bleeding edge technologies: Docker, Kubernetes, ECS, AWS, Google GCP, Terraform, Lambda, Zabbix, Grafana, Elasticsearch, Kibana, Prometheus, Sysdig,...
Summary:
- 4 000+ GitHub stars
- 10 000 000+ Grafana dashboard downloads
- 60 000 000+ Docker images downloads
Professional devops / monitoring / consulting services: