Generates a pretty, directed graph of Taskwarrior projects, tags, and tasks. After the graph has been generated, it's opened using either xdg-open (under GNU/Linux) or open (under macOS).
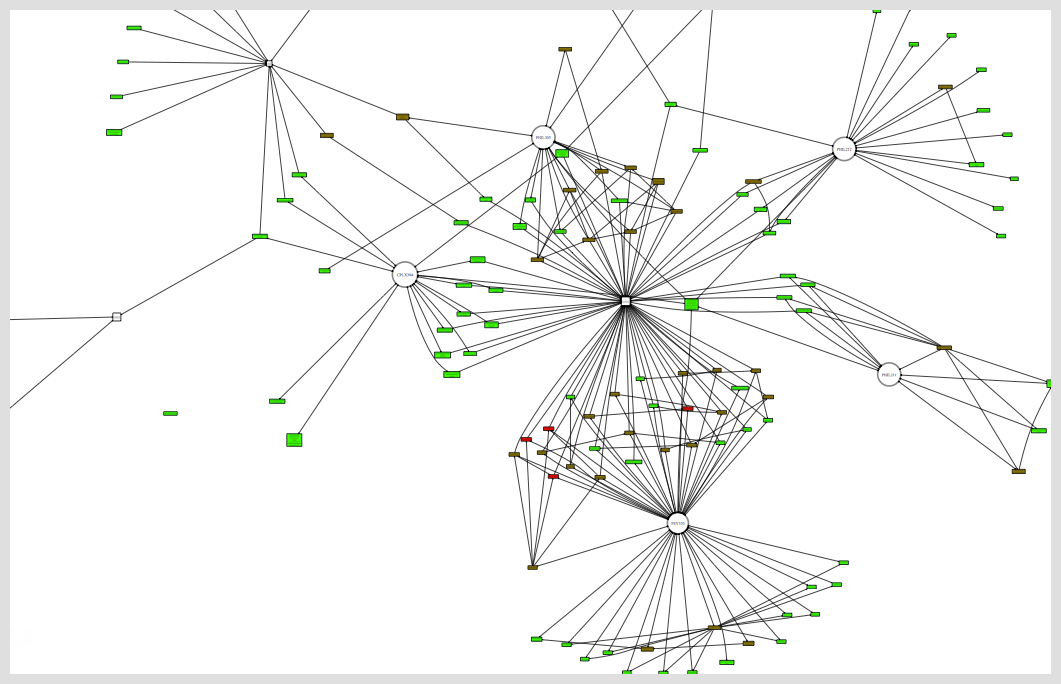
Things end up looking kinda like this:
Arrows show implication, so they point from projects to tasks, and from tasks to tags. That is, projects include tasks and tasks include tags.
Projects are represented by large circles, tasks by colored rectangles, and tags by uncolored squares.
-
Either of the
xdg-openoropencommands, present by default on most GNU/Linux or macOS installs, respectively. -
Python
-
Taskwarrior
-
Graphviz's
digraphcommand.
When placed in your $PATH, taskgv.py <filter> opens a graph of your business, filtered by Taskwarrior <filter>.
This command can be integrated with Taskwarrior by either running task config alias.gv execute taskgv.py or adding the line alias.gv=execute taskgv.py to your .taskrc.
In either case, the result will be the ability to call taskgv with the command task gv.
This script is derived from graphdeps.py.
