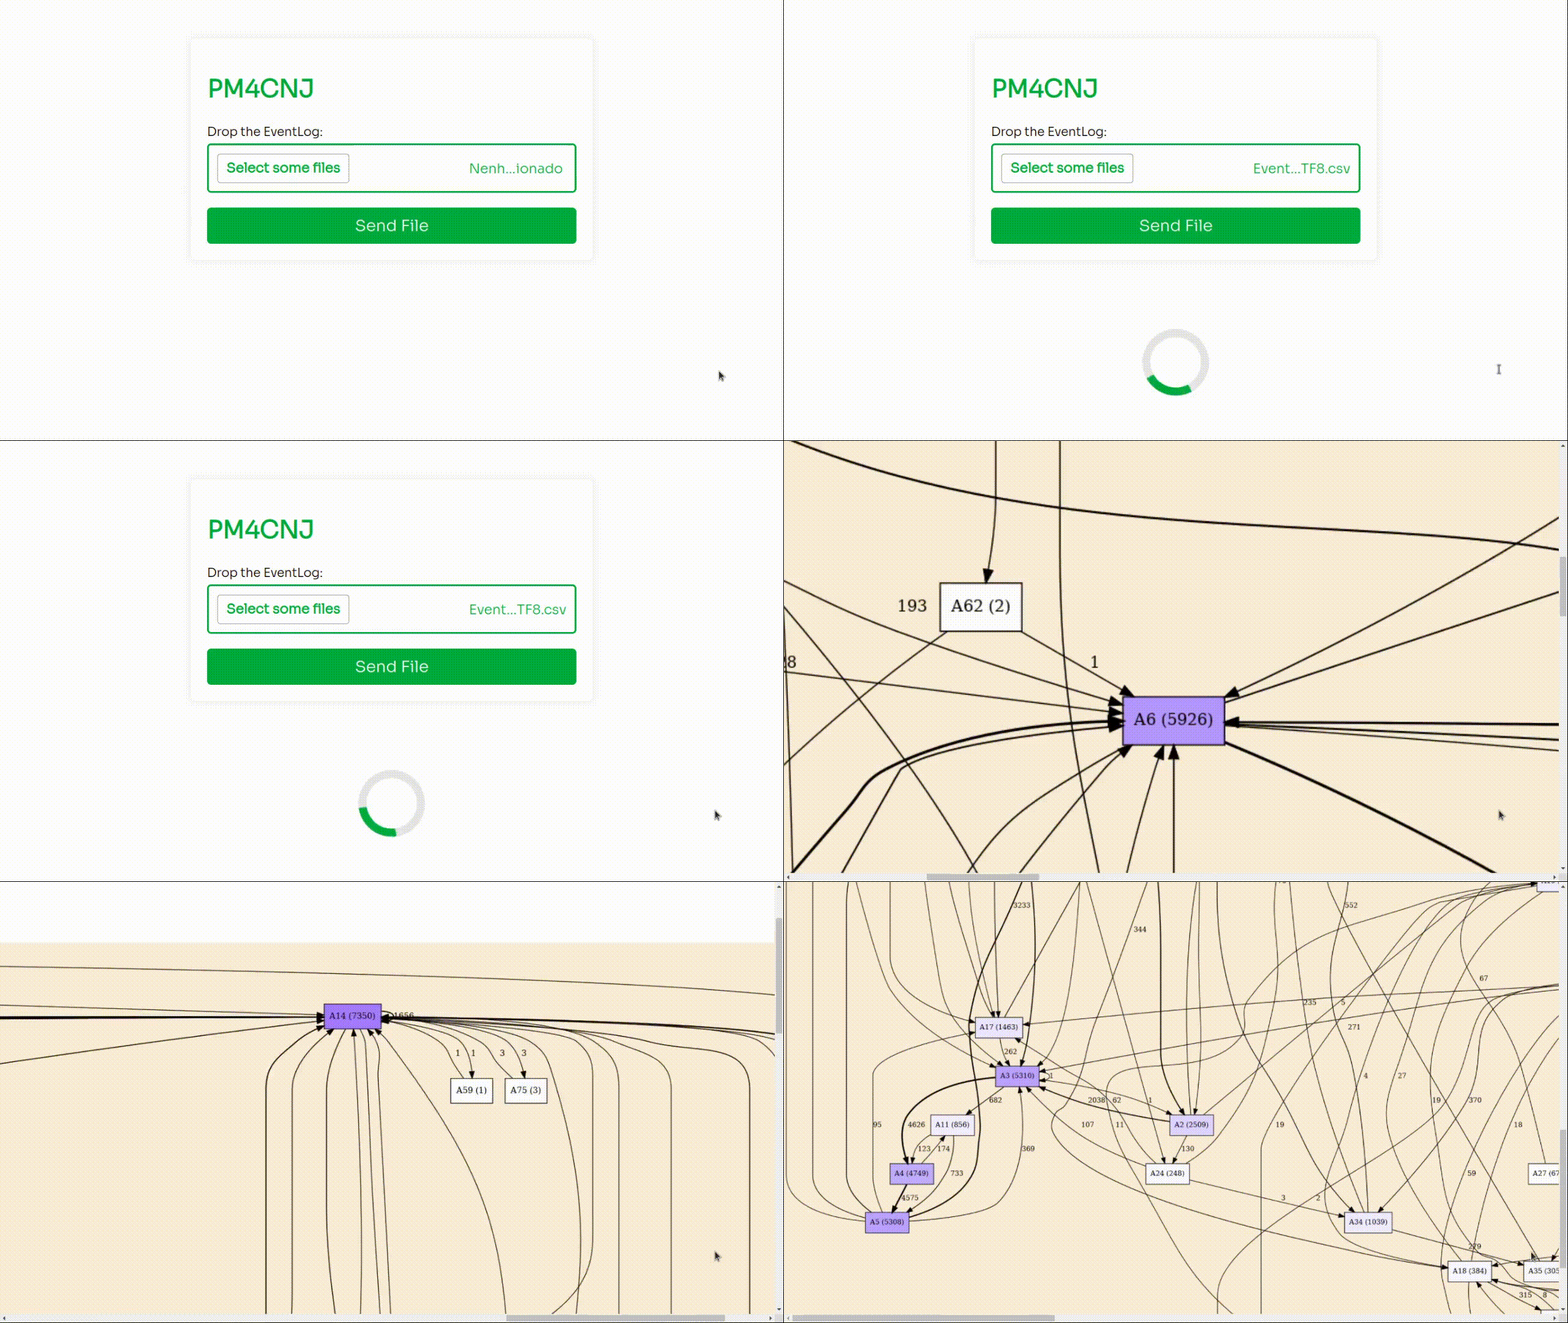
Web application that, from a .csv file sent, processes and generate an svg image with the Directly Follows Graph (DFG), from EventsLogs
- Follow the steps below to make the Client active.
- Follow the steps below to make the Server active.
- Do both running at the same time.
- Enter the route http://localhost:4200/ in your browser.
- Drop one .csv file, following this pattern:
Case ActivityCode Start End 657797 A1 2016/06/01 07:25:09.000 2016/06/01 07:53:49.000 657797 A2 2016/06/01 07:53:50.000 2016/06/01 07:55:29.000 657797 A3 2016/06/01 07:55:30.000 2016/11/01 10:55:50.000 ... ... ... ... - Ps: .csv sep will be ";".
- Click on "Send File".
- Wait for the backend to generate the EventLog.
- Wait for the backend to generate the DFG.
- Analyze the DFG that will appear on the same page.
sudo apt-get install graphviz # for unix-based osfor Windows or OSX, see https://graphviz.org/
cd client
#  Use the NVM - Node Version Manager - to choice the version 14.19.0
curl -o- https://raw.githubusercontent.com/nvm-sh/nvm/v0.39.1/install.sh | bash
nvm install 14.19.0
nvm use 14.19.0
#  Install the angular-cli and others dependences
npm install -g @angular/cli
npm install
#  Run the client
ng serve -o# Enter in your virtural env
cd server
pip install -r requirements.txt
flask run- pages/components Angular
- Integration with the backend
- Forms to send csv to backend
- Component to visualize svg image
- Routes Flasks
- Get csv image from frontend
- Transforms csv to Eventlog
- Aply process discover DFG in Eventlog
- Create SVG from DFG results in text
- Architecture Blueprints to Flask
- Architecture Scalable to Angular
- Have a tab with general information about the data
- Implement filtering functions on the data
| Eric de Lima |
