Sidhant Chopra
The purpose of this package is to allow for flexible, programmatic and interactive plotting of brain connectivity data within Rstudio - negating the need to swap to other visualization tools and allowing for reproducible integration of visualization with analysis scripts that are written in R.
The primary plotting functions: brainconn() and brainconn3D(). The
primary user input into these function is a connectivity matrix. Several
brain atlases come pre-installed and users can also provide a custom
atlas (see vignette).
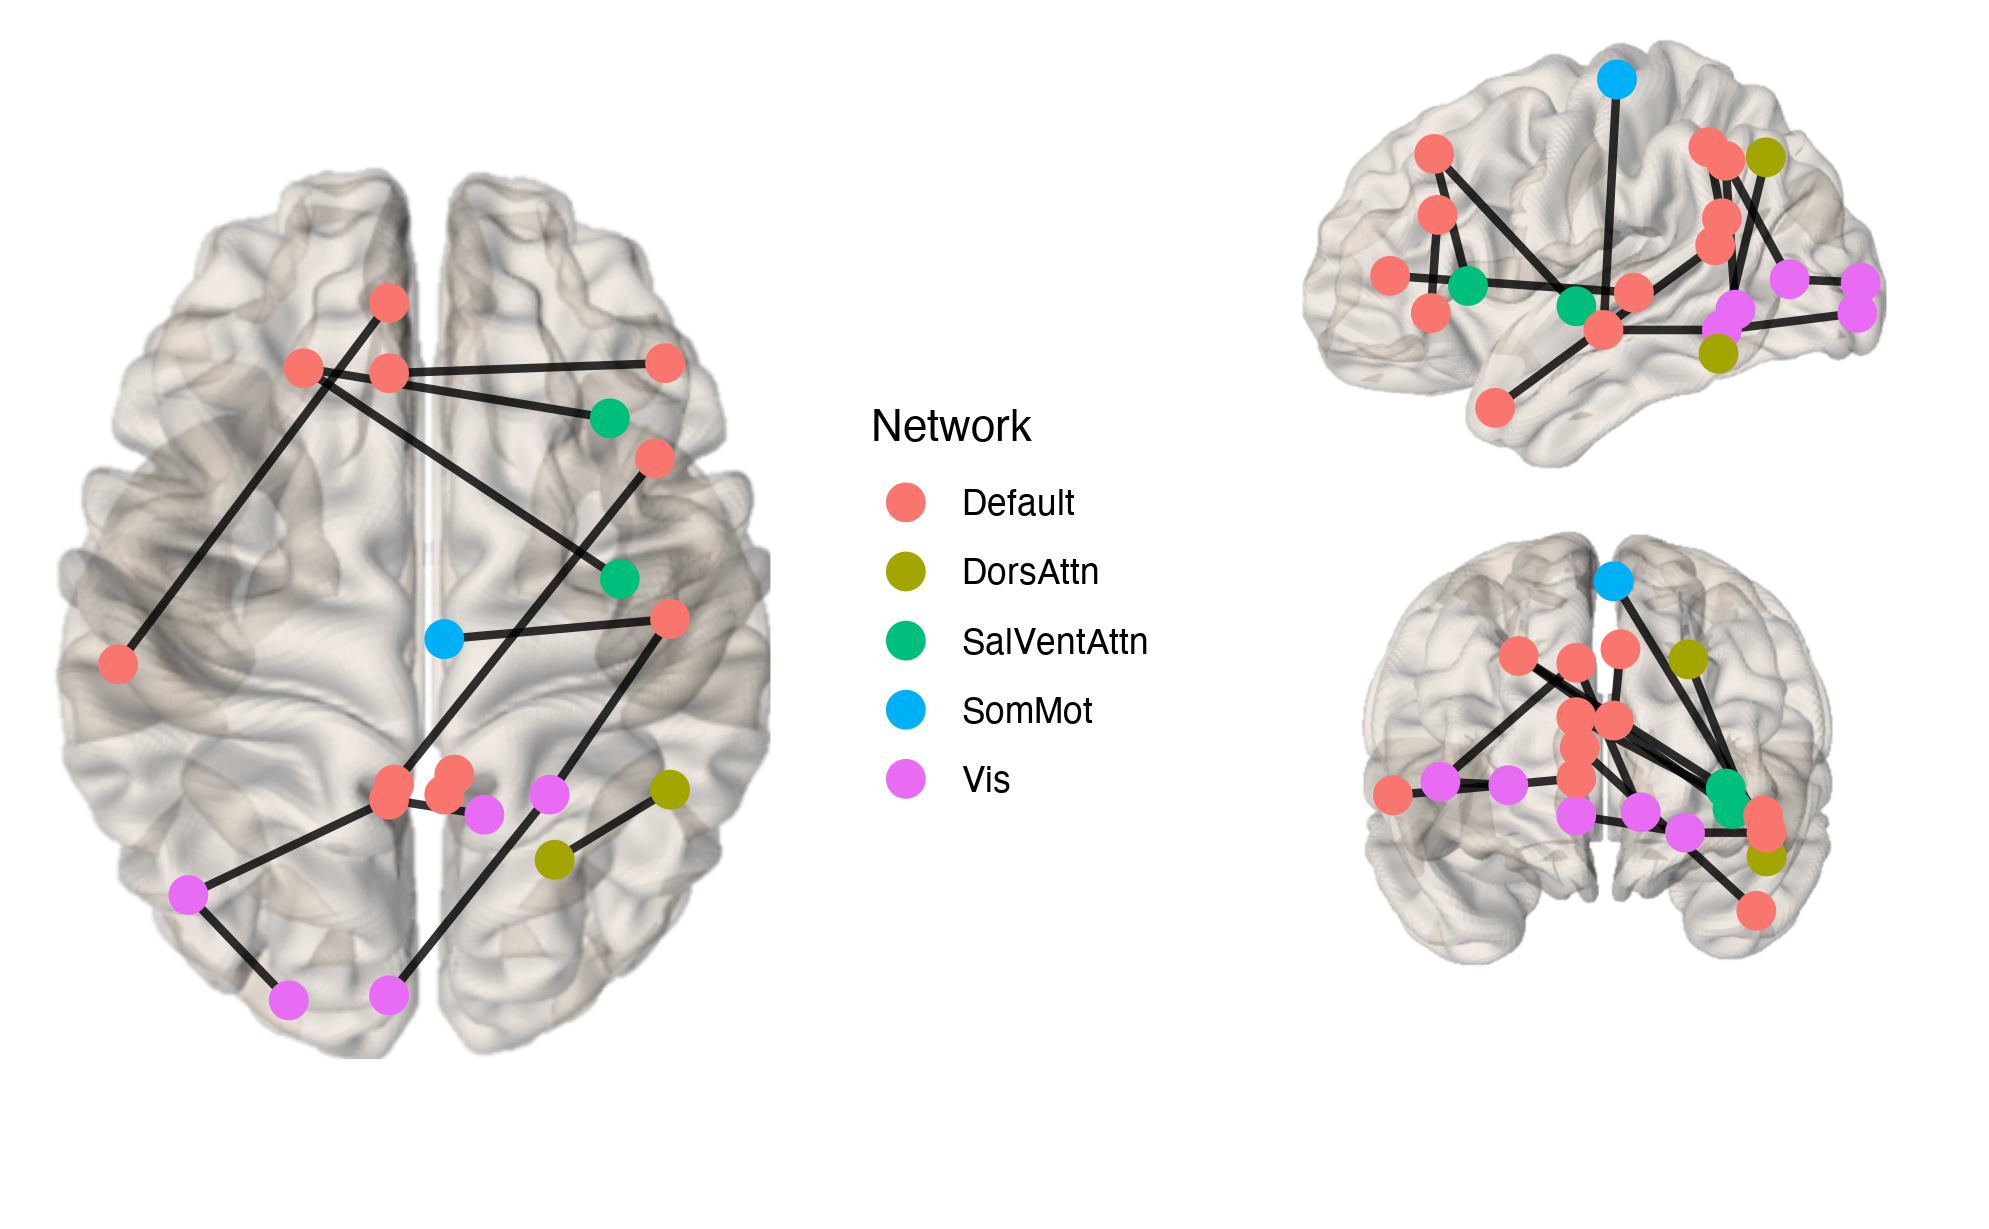
The brainconn() function allows users to input a binary/weighted and
directed/non-directed (i.e. symmetric) connectivity matrix which can be
plotted onto MNI coordinates using ggraph.
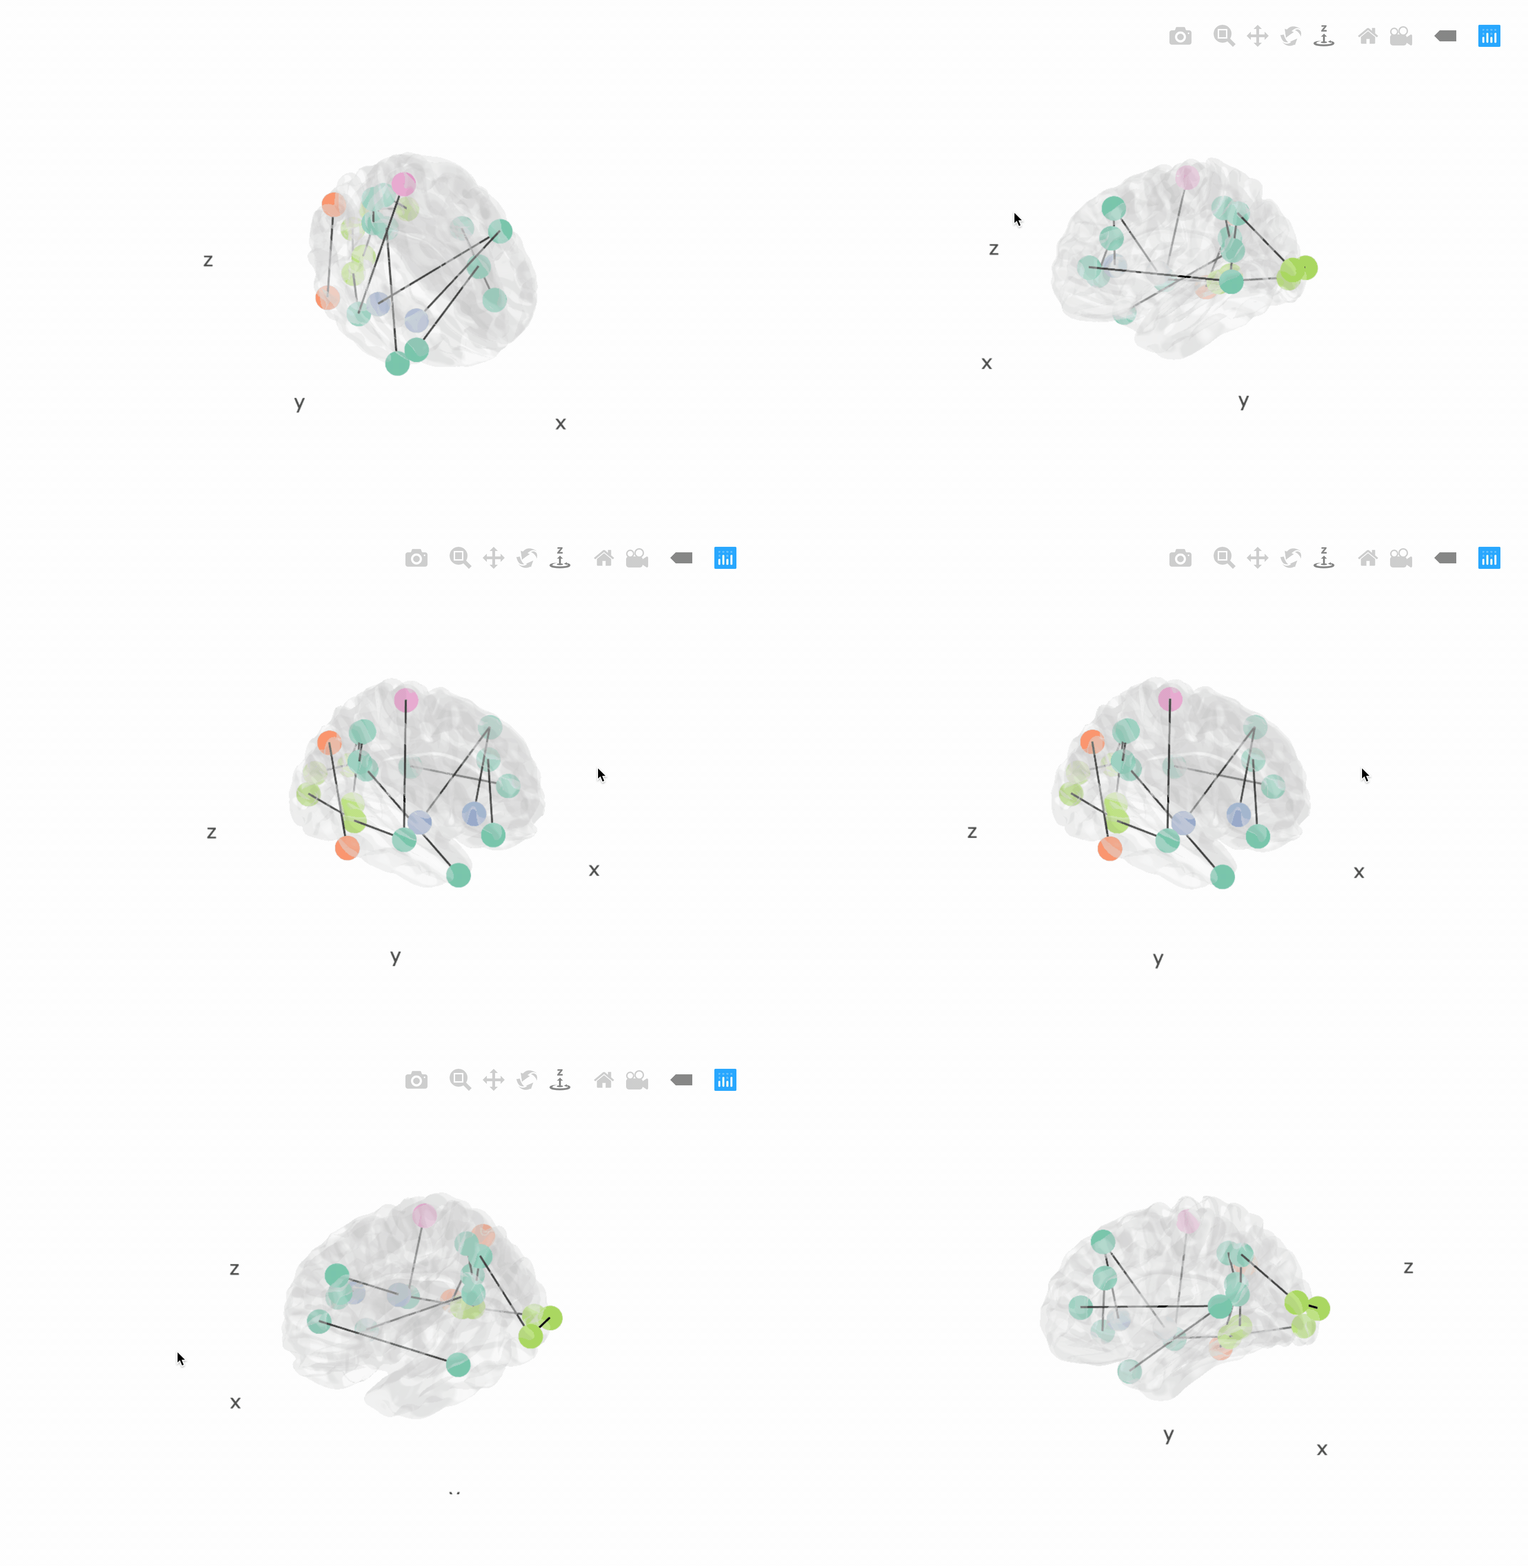
The brainconn3D() allows users to input a binary and non-directed
connectivity matrix which is plotted in a 3D and interactive way using
plottly.
The atlases currently included with in the package can be listed using
the list_atlases() function: aal116, aal90, craddock200, dk68,
dk82_aspree, dkt62, gordon_333, shen_268, shen_368,
schaefer1000_n7, schaefer1000_n17, schaefer300_n7,
schaefer300_n17 (and all other iterations of the schaefer atlases).
Custom atlases can be easily added as long as you have centroid
coordinates in MNI space, see
vignette.
The check_atlas() function checks that custom atlases meet the
requirements of the plotting functions.
The package can be installed using devtools.
install.packages("remotes")
remotes::install_github("sidchop/brainconn")
The functions are now installed, and you may load them when you want to use them.
The package also has a vignette, to help you get started. You can access it here, or via R:
library(brainconn)
vignette("brainconn")
The primary user input is a connectivity matrix (conmat).
brainconn(atlas ="schaefer300_n7", conmat=example_unweighted_undirected, view="ortho")Modifiable features for brainconn include: view, node.size,
node.color, edge.width, edge.color, edge.alpha,
background.alpha, labels and others (see vignette)
x <- example_unweighted_undirected
p <- brainconn3D(atlas ="schaefer300_n7", conmat=x, show.legend = F)
p
Included below is a gif of the interactive output (see vignette for more information):
Modifiable features for brainconn3D include: node.size,
node.color, edge.width, edge.color, adge.alpha,
background.alpha, labels and others (see
vignette)
Don’t hesitate to ask for support or new features using github issues.
- ggseg & ggseg3D: Plotting tool for brain atlases, in ggplot/plotly
- brainGraph: Graph theory analysis of brain MRI data
- fsbrain: Provides high-level functions to access (read and write) and visualize surface-based brain morphometry data (e.g. cortical thickness) for individual subjects and groups.
- NBR: Network Based R-statistics for Mixed Effects Models
- fslr: FSL-R Interface package
If you end up using brainconn() in a publication, please cite our
paper, for which brainconn was created : Sidhant Chopra, Loïc Labache,
Elvisha Dhamala, Edwina R Orchard, Avram Holmes (2023). A Practical
Guide for Generating Reproducible and Programmatic Neuroimaging
Visualizations ApertureNeuro.
https://doi.org/10.52294/001c.85104


