🎶 Predicting Billboard's Year-End Hot 100 Songs using audio features from Spotify and lyrics from Musixmatch
Each year, Billboard publishes its Year-End Hot 100 songs list, which denotes the top 100 songs of that year. The objective of this project was to see whether or not a machine learning classifier could predict whether a song would become a hit (known as Hit Song Science) given its intrinsic audio features as well as lyrics.
The goal of this project is to see if a song's audio characteristics and lyrics can determine a song's popularity. Data and analytics aside, music listeners around the world probably have seen music trends change over time. Although each listener has custom interests in music, it is pretty clear when we listen to a hit song or soon to be hit song (consider Old Town Road). And over time, we see the characteristics of hit songs change. So, rather than using our intuition or "gut-feeling" to predict hit songs, the purpose of the project is to see if we can use intrinsic music data to identify hits.
Hit Song Science can help music producers and artists know their audience better and produce songs that their fans would love to hear. Artists can better know what lyrics to write and tune the meaning of their song to what their fanbase would enjoy. Additionally, audio engineers can work with musicians to tweak intrinsic music qualities to make a song more popular catchy and likable.
Also, it can highlight unknown artists whose music is characteristic of top songs on the Billboard Hot 100. This allows underground artists (i.e. Lil Tecca), who might not have the publicity help from an agency or a record label, to have a chance at gaining recognition.
A sample of 19000 Spotify songs was downloaded from Kaggle, which included songs from various Spotify albums. Additionally, Billboard charts from 1964-2018 were scraped from Billboard and Wikipedia.
Using Spotify's Audio Features & Analysis API, the following features were collected for each song:
- Mood: Danceability, Valence, Energy, Tempo
- Properties: Loudness, Speechiness, Instrumentalness
- Context: Liveness, Acousticness
Additonally, lyrics were collected for each song using the Musixmatch API. I took a bag-of-words NLP approach to build a highly sparse (86%) matrix of unique words.
After cleaning the data, a dataset of approx. 10000 songs was created.
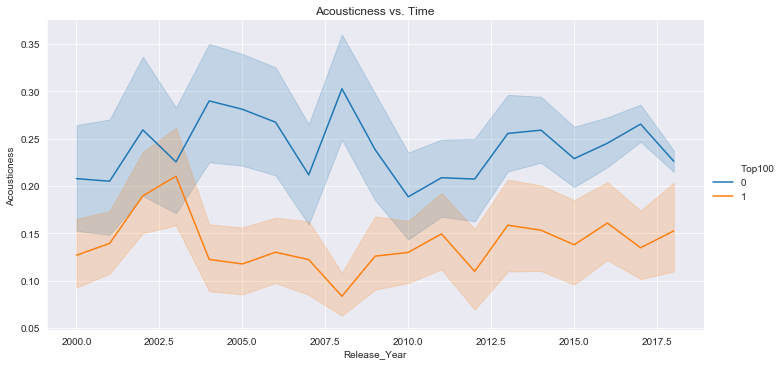
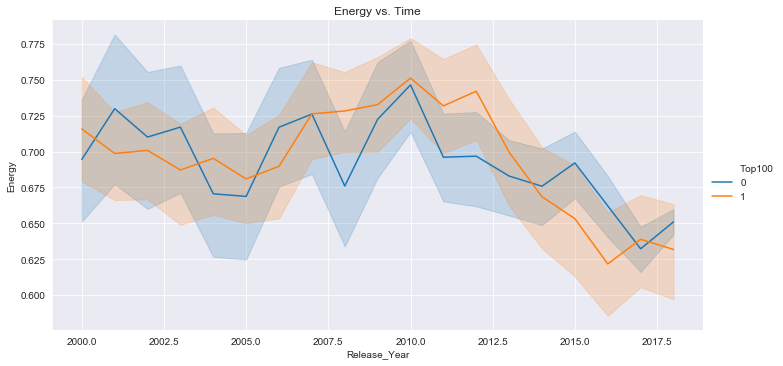
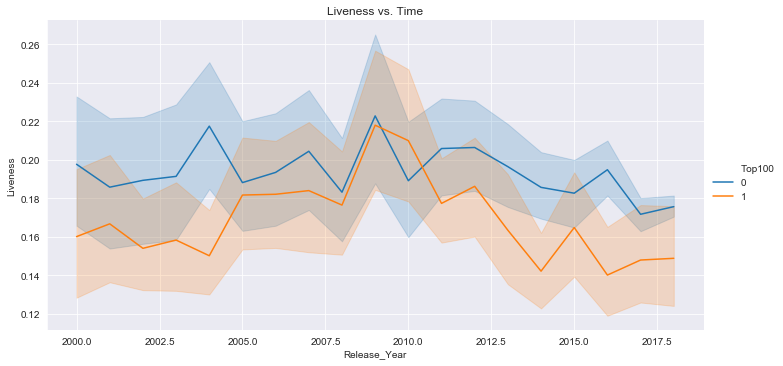
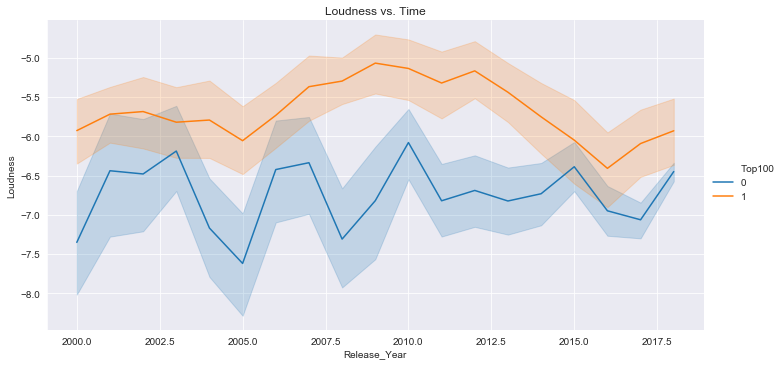
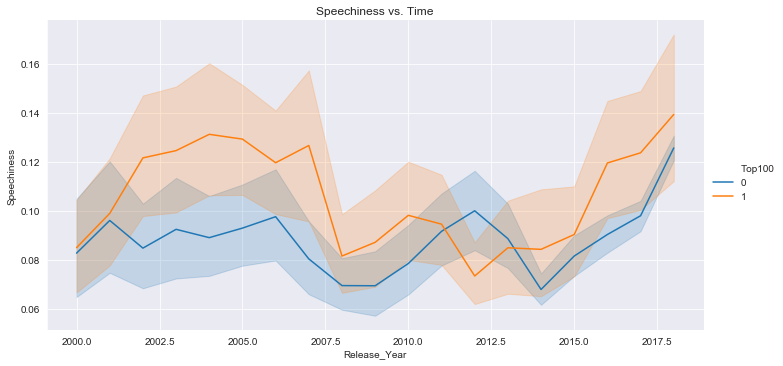
The above graphs clearly show that audio features evolve over time. More importantly, the separability of data in certain graphs such as Acousticness vs. Time and Loudness vs. Time indicates potentially significant features that can help distinguish between the two classes.
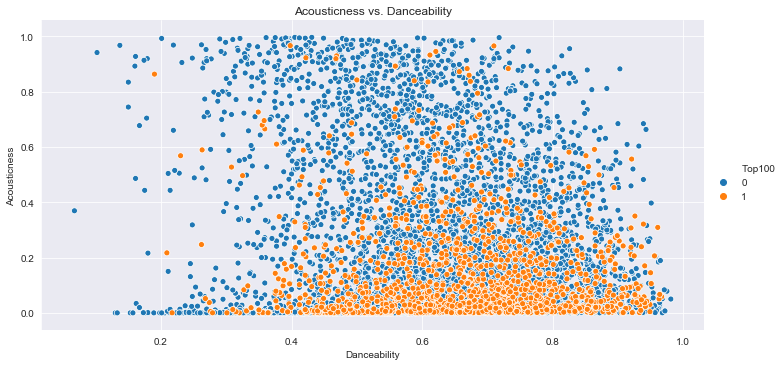
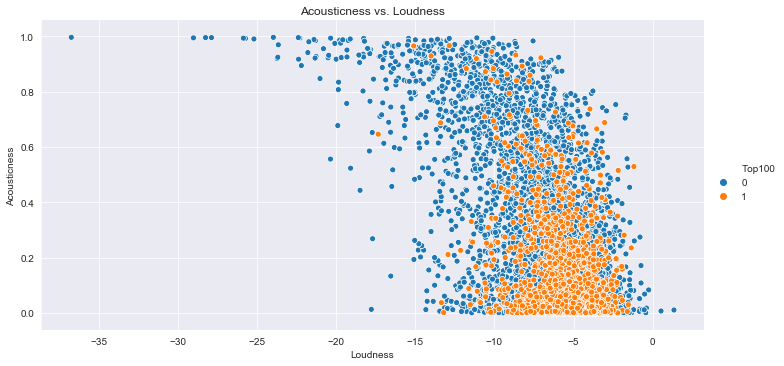
The above graphs show the separability in the data when compared across two unique Spotify features; this suggests that data may separate across an n-dimensional feature space. Given this, the problem can alternatively be posed as an unsupervised learning problem where clustering methods can classify the data.
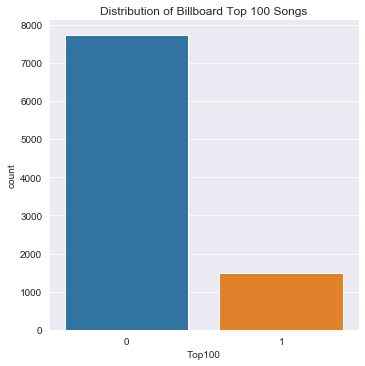
Given the unbalanced nature of the dataset, any model chosen would automatically yield high accuracy. So, in addition to aiming for high accuracy, another objective of modeling is to ensure a high AUC (so that TPR is maximized and FPR is minimized). The AUC tells us how well the model is capable of distinguishing between the two classes.
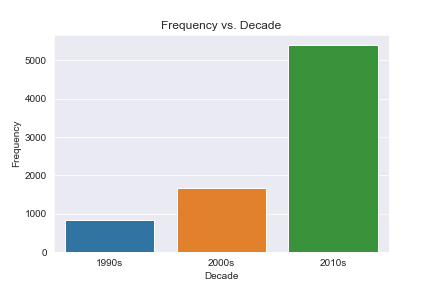
Also, after EDA, I decided to only consider songs released between 2000-2018 because it is evident that music trends and acoustic features change over time, and song characteristics of the '90s would probably be not reflective of '00s and '10s decades. (Note: For the sake of sample size I decided to combine '00s and '10s decades together. However, with the conglomeration of more songs and awards, it is probably better to consider a smaller time window)
Here's a list of all the models I tested:
- Logistic Regression
- Improved Logistic Regression (with un-important Spotify features removed)
- LDA
- 10-fold CV CART
- Random Forest
- Bagging
- 10-fold CV KNN
Model Summaries:
| Model | Accuracy | TPR | AUC |
|---|---|---|---|
| Baseline | 0.798 | na | na |
| Logistic Regression | 0.809 | 0.289 | 0.786 |
| Improved Logistic Regression | 0.810 | 0.300 | 0.785 |
| LDA | 0.805 | 0.280 | 0.774 |
| 10-fold CV CART | 0.805 | 0.123 | 0.706 |
| Random Forest | 0.813 | 0.174 | 0.7731 |
| Bagging | 0.818 | 0.300 | 0.785 |
| 10-fold CV KNN | 0.801 | 0.014 | 0.736 |
Additionally, I tested out an ensemble method by stacking a few models together (logistic + LDA + CART). Model ensembling is a technique in which different models are combined to improve predictive power and improve accuracy. Details regarding stacking and ensemble methods can be found here.
Model Correlation Matrix:
| lda | rpart | glm | |
|---|---|---|---|
| lda | 1.0000000 | 0.1656148 | 0.9283705 |
| rpart | 0.1656148 | 1.0000000 | 0.2025172 |
| glm | 0.9283705 | 0.2025172 | 1.0000000 |
Model Summary:
| Accuracy | TPR | AUC |
|---|---|---|
| 0.814 | 0.297 | 0.797 |
The stacked model achieved high accuracy and TPR that is comparable to the improved logistic regression and bagging model. However, more importantly, the stacked model greatly improved the AUC.
Due to a large number of features (Spotify features + lyrics bag-of-words), I decided to use a penalized logistic regression model. This imposes a penalty to the logistic model for having too many variables. This results in lowering the dimensionality of the feature spacing by shrinking the coefficients of the less important features toward zeros. I specifically used the following penalized regression techniques:
- Ridge Regression: all the features are included in the model, but variables with minor contribution have their coefficients close to zero
- Lasso Regression: the coefficients of less contributive features are forced to zero and only the most significant features are kept
(An explanation regarding penalty methods and shrinkage can be found here)
Model Summary:
| Model | Accuracy | TPR |
|---|---|---|
| Ridge | 0.805 | 0.182 |
| Lasso | 0.807 | 0.185 |
Based on the model summary, the penalty methods were not that effective.
The best model after testing seems to (improved) logistic regression and bagging. Both these models yielded high accuracy (~81%) and they had an above average TPR (~0.3) and AUC (~0.785). Also, the stacked model did a good job of minimizing FPR and helped increase the AUC (~0.80).
- Append more music awards (Grammy, Apple Music Awards, iHeartRadio Music Awards, etc.) to balance dataset of "hit" songs
- Reduce time window (2-3 years) or prepare a time-series model
- Build deep learning model
- https://www.kaggle.com/edalrami/19000-spotify-songs
- https://developer.spotify.com/discover/
- https://developer.musixmatch.com
- https://en.wikipedia.org/wiki/Hit_Song_Science
- https://www.kdnuggets.com/2017/02/stacking-models-imropved-predictions.html
- https://stats.stackexchange.com/questions/179864/why-does-shrinkage-work
- https://statweb.stanford.edu/~jtaylo/courses/stats203/notes/penalized.pdf
- https://towardsdatascience.com/decision-tree-ensembles-bagging-and-boosting-266a8ba60fd9
- https://towardsdatascience.com/ensemble-methods-in-machine-learning-what-are-they-and-why-use-them-68ec3f9fef5f
