Have you ever wondered if there is life outside of our solar system? I’m sure most of us wondered before about our existence and if we are truly alone in space. As a kid, I always was fascinated with space, all the stars, and planets and due to my curiosity in cosmology, I decided to use Machine Learning algorithms to investigate a Kaggle Nasa dataset. Let me guide you into a deep learning adventure into space.
An Exoplanet (Extrasolar planet) is a planet that exists outside our solar system. Many exoplanets have been discovered over the years by Nasa’s Kepler telescope. Scientists discovered a very efficient way to study these occurrences; planets themselves do not emit light, but the stars that orbit them do. If you study and watch these stars over time there may be a regular dimming of their flux (The light intensity). That’s enough evidence to say that there is an orbiting body near the star. Further studies of the candidate system capture light at a different wavelength, could solidify the belief or confirm the existence of these orbiting bodies.
In the diagram below, a star is orbited by a blue planet. At t = 1, the starlight intensity drops because it is partially obscured by the planet, given our position. The starlight rises back to its original value at t = 2. The graph in each box shows the measured flux (light intensity) at each time interval.
My goal was to create a model that can predict the existence of an Exoplanet, utilizing the flux (light intensity) readings from 3198 different stars over time. For this dataset investigation I used Python along with these libraries: Pandas, Jupyter notebook, SKLearn, Numpy, Scipy, Matplotlib and Seaborn.
Link to Kaggle Dataset : https://www.kaggle.com/keplersmachines/kepler-labelled-time-series-data
The Dataset is composed of a test and a training set, containing two different labels, 2 is an exoplanet star and 1 is a non-exoplanet-star.
5086 rows or observations.
3198 columns or flux value.
Column 1 is the label vector. Columns 2–3198 are the flux values over time.
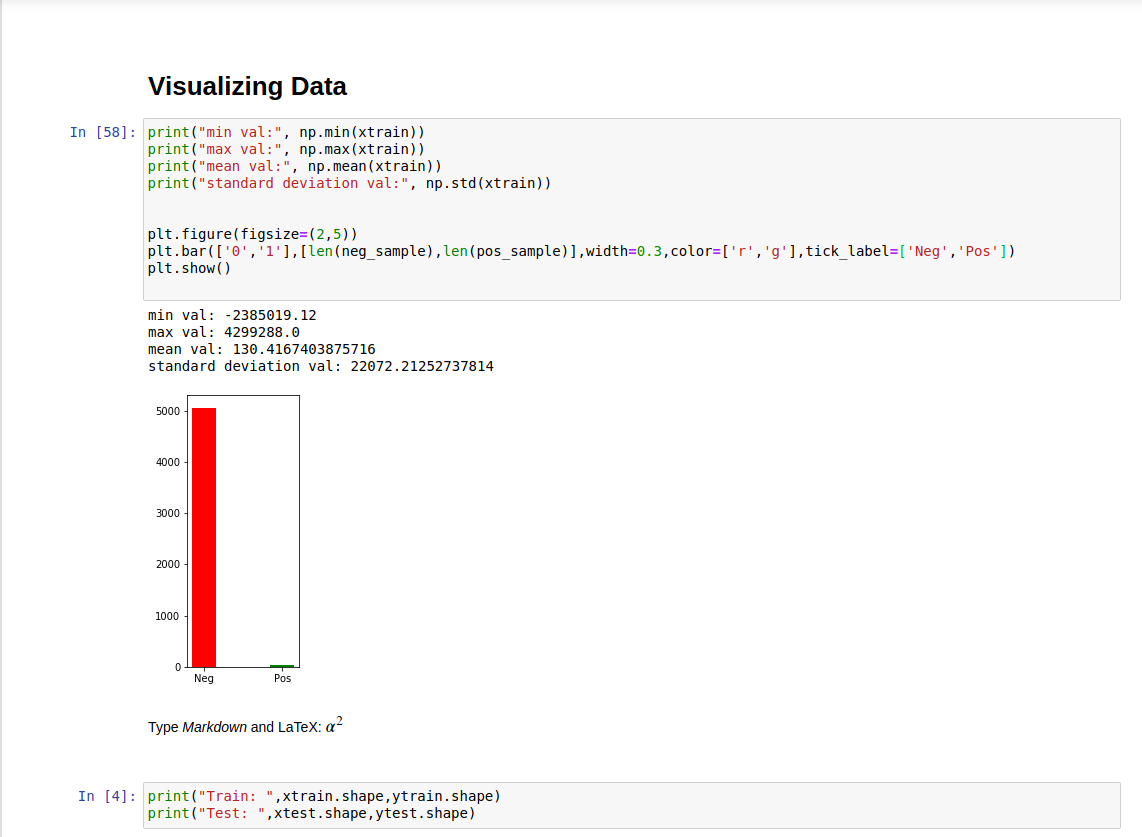
37 confirmed exoplanet-stars and 5050 non-exoplanet-stars.
570 rows or observations.
3198 columns or features.
Column 1 is the label vector. Columns 2–3198 are the flux values over time.
5 confirmed exoplanet-stars and 565 non-exoplanet-stars.
while going through dataset, I see that data is highly skewed or in-balanced. In Trainset 99.29% is negative and only 0.3 percent is positive. And, Balancing it turn out to be a pain in my head!
You also look at mean,max,min, std_dev and ratio of postivie to negative observation.

- reducing the number of negative observation and increasing positive observation.
- Normalizing the data
- reducing dimensions by PCA

