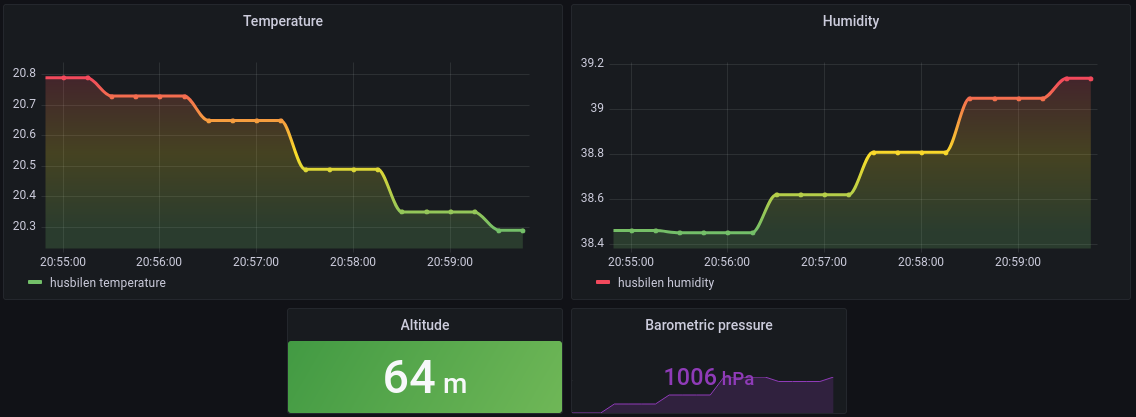
Exposes a prometheus exporter endpoint for scraping environmental Temperature, Humidity, Pressure and Altitude from a BME280 sensor. The ESP32 device acts as a HTTP Server on port 80, and prometheus scrape the metrics into the time series database.
- Configure
ssidandpasswordfor wifi network withinsrc/main.cpp - Configure place name
- Build
- hit
/metricsendpoint for reading temperature (C), temperature (F), device resolution, and device count:
❯ curl 10.0.1.1/metrics

# HELP temperature_celcius Current temperature in celcius
temperature_celcius{place="myplace"} 20.91
# HELP humidity_percentage Current humidity in Percent
humidity_percentage{place="myplace"} 38.67
# HELP pressure_hpa Current pressure in hPa
pressure_hpa{place="myplace"} 1005.25
# HELP altitude_meter Current altitude in meter
altitude_meter{place="myplace"} 66.81
[tekzn7@fedora esp32_prometheus_exporter_BME
- Install pio
pip install -U platformiopio run # Build
pio run --target upload # Upload firmwareTake note of the hostname/IP. The IP is printed in the serial console.
Configure prometheus.yml:
scrape_configs:
  # The job name is added as a label `job=<job_name>` to any timeseries scraped from this config.
  - job_name: 'myplace-metrics'
    metrics_path: '/metrics'
    scrape_interval: 10s
    static_configs:
      - targets: ['my_ip_or_hostname:80']

