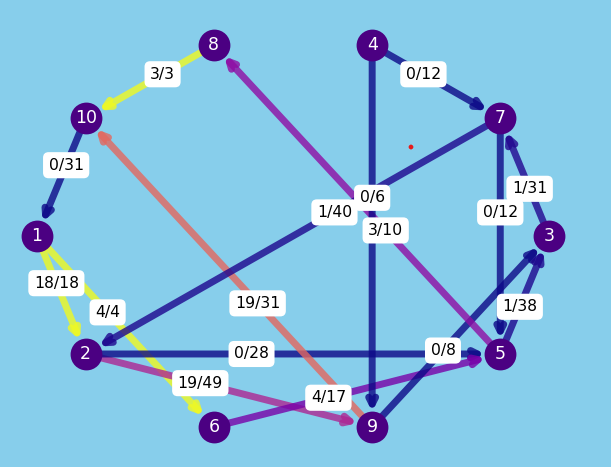
Python project developped for the graph theory course (MATH0499) given by Pr. Rigo, ULiège.
The final mark for this project is 19/20.
The Ford-Fulkerson algorithm is a graph algorithm used to determine the maximum flow from a source node to a sink node. It can also be used to calculate if a minimum flow can flow through an entire network.
Using the -g option (see Examples), you can visualize the flow in the graph. The lighter the color of an edge, the more saturated it is.
- NetworkX https://pypi.org/project/networkx/
- Matplotlib
- Pylab
- ./
- main.py: Main script
- ford_fulkerson.py: Script containing the Ford-Fulkerson algorithm and pre-processing functions for loading files into Graph() objects
- display.py: Script for displaying graphs via matplotlib
- utils.py: Script for creating random graphs of any size
-
Finding the maximum flow from s to t in an existing file
python3 main.py -i filename.txt -s s -t t -
Finding the maximum flow from s to t in an existing file and displaying the residual graph in a window
python3 main.py -i filename.txt -s s -t t -g -
Finding the maximum flow from multiple sources to t in an existing file
python3 main.py -i filename.txt -s "s_1 s_2 s_3 s_n" -t t -
Finding the maximum flow from multiple sources to multiple sinks in an existing file
python3 main.py -i filename.txt -s "s_1 s_2 s_3 ... s_n" -t "t_1 t_2 ... t_k" -
Finding the maximum flow from s to t in a randomly generated file with n vertices
python3 main.py -r n -s s -t t
- Randomly generated graphs are systematically stored in ./example_random_graph.txt
- Graphs are stored in Edge List files (see NetworkX Edge List documentation)
- Simon Gardier (Co-author)
- Camille Trinh (Co-author)


