Visualize ISTAT data
Introduction
The goal is to get some insights about the regional distribution of population in Italy and how it is changed by year
Software and Libraries
This project uses Python 3.8.2 for the data preparation
Data
The dataset is provided by ISTAT is basically composed by:
- ab69eff1-7aaa-4f13-9874-d07c9b7db9ad.xls: location levels
- DCIS_POPRES1_15032020152523718.csv: population data by comune and year
Running the code
The Jupyter Notebook data_preparation.ipynb contains all the steps needed to rebuild the location dimension: State - Geographic Area - Macro Region - Region - Province - Comune
Then Microsoft Power BI italy_population.pbix has been used to visualize data
Flowchart made using draw.io
Results
All visualization in the report are enabled to drill up/down on the location dimension
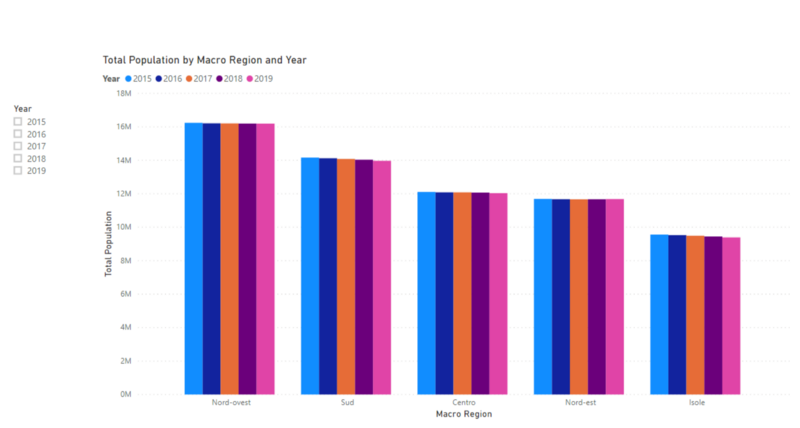
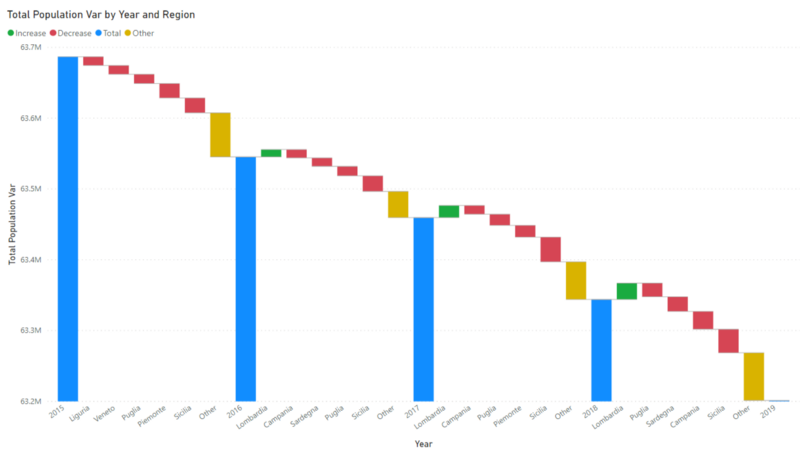
Italy has -0.53% people in 2019 compared to 2015 and the effect is more relevant on south and the islands
Lombardia is the only region with an increase of people in recent years
Results are better explained in this blog post
Licensing and Acknowledgements
Thank you ISTAT for the datasets and more information about the licensing of the data can be found on their web sites


