Plot a line with changing color over the course of a line.
To plot a line, run
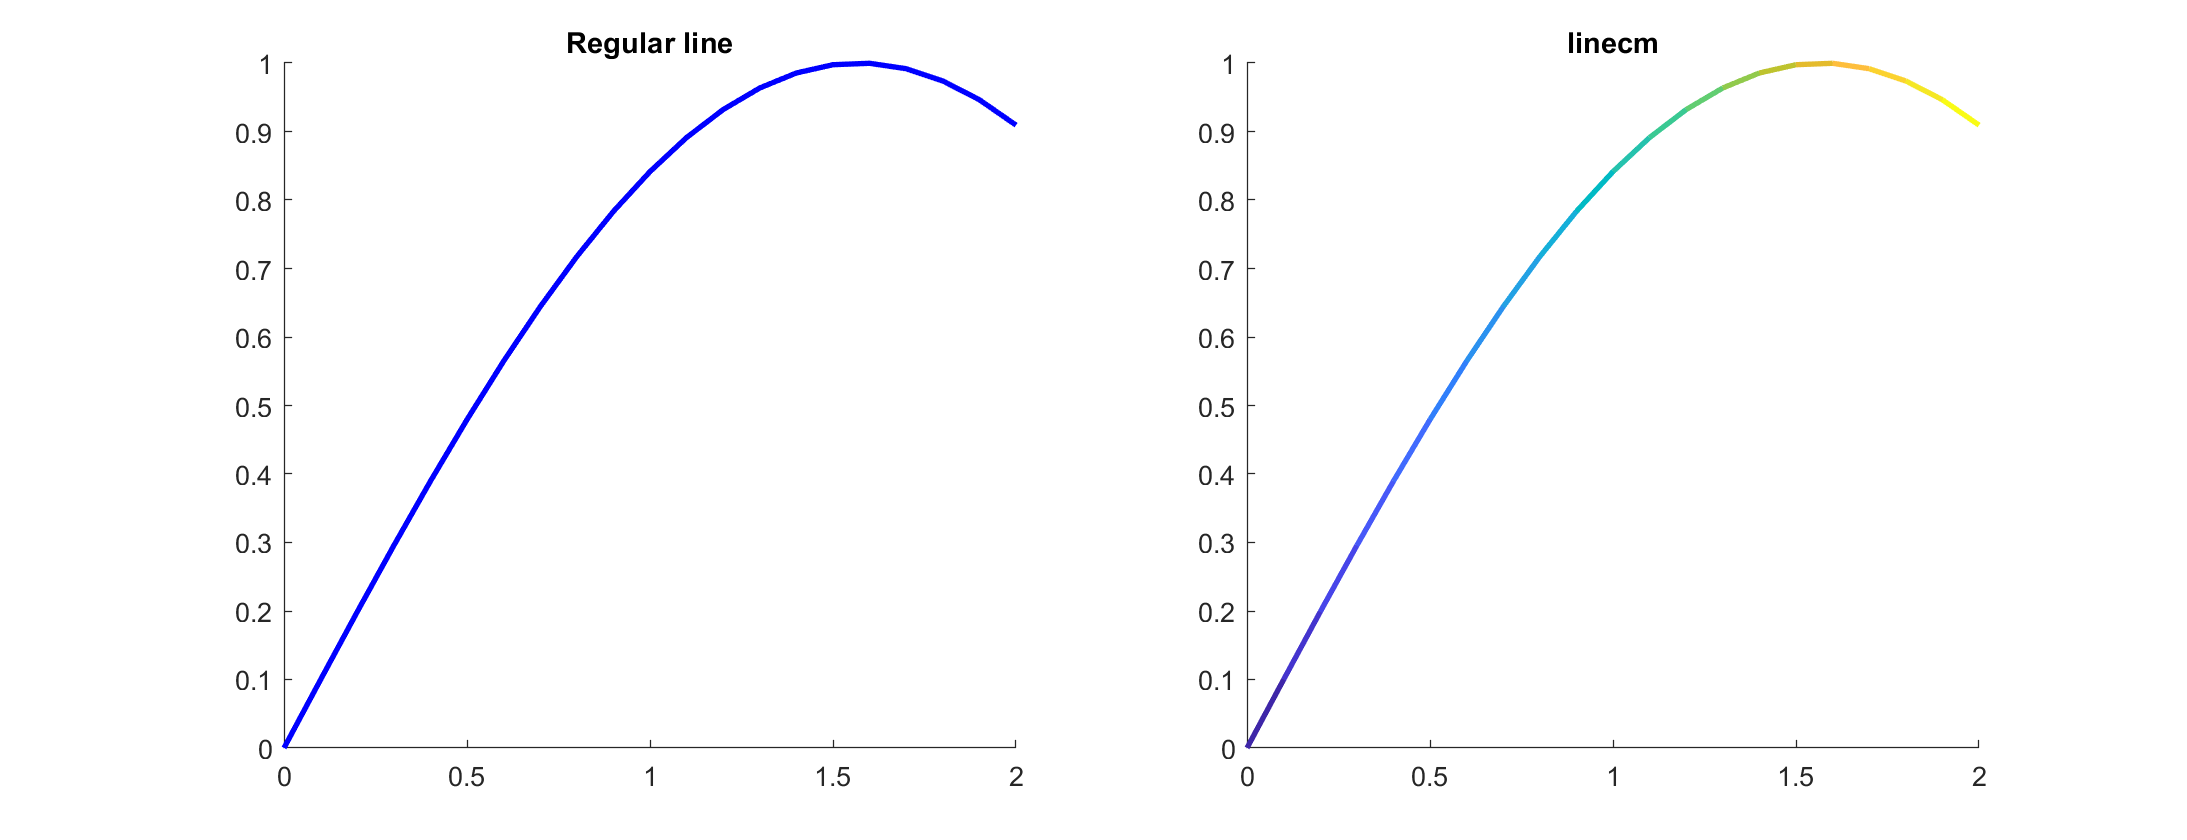
linecm(x, y, @colormap_functionhandle);Just like that! You now have a much better looking line. Here is an example:
set(0, 'DefaultLineLineWidth', 2);
x = 0:0.1:2;
y = sin(x);
subplot(1, 2, 1)
line(x, y, 'Color', 'b')
title("Regular line")
subplot(1, 2, 2)
linecm(x, y, @parula); % semicolon is recommended
title("linecm")
Clearly, linecm looks much better!
In this file, two additional colormaps have been added: coolwarm and bwr, inspired by matplotlib. You can read more about them here.
There is a similar program available called colormapline which might be less error prone.
Might be quite obvious but linecm stands for "line colormap".

