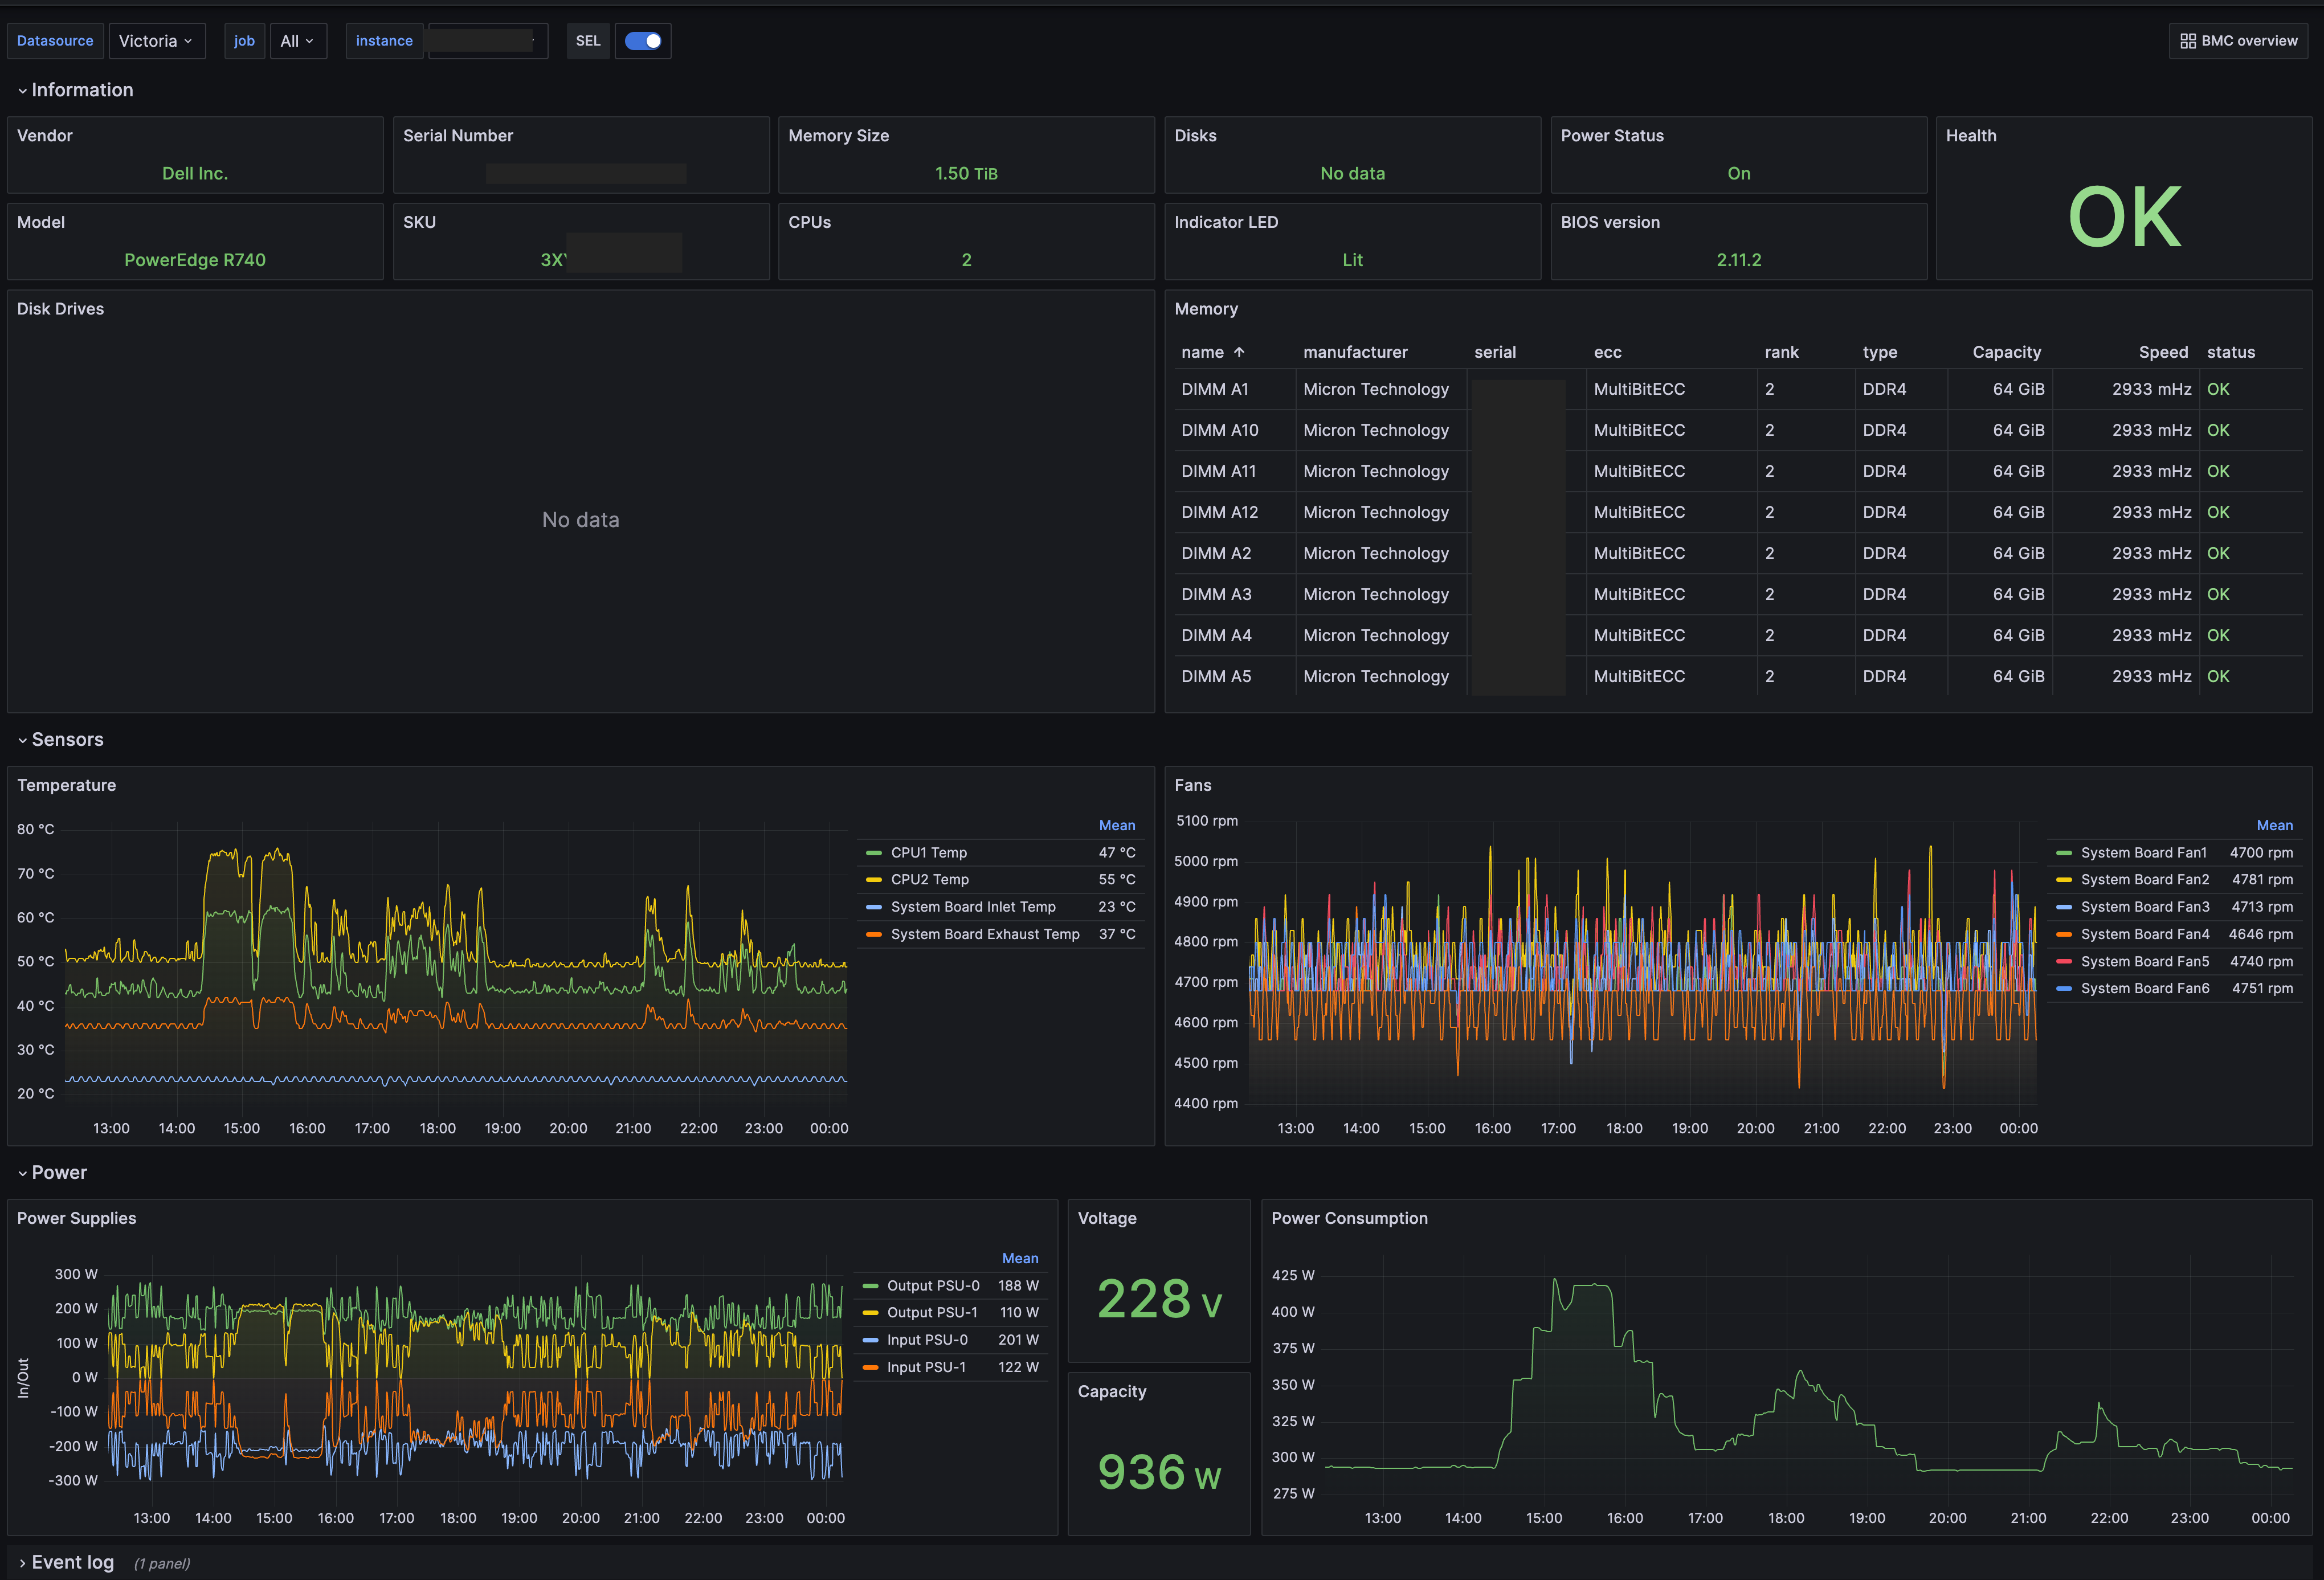
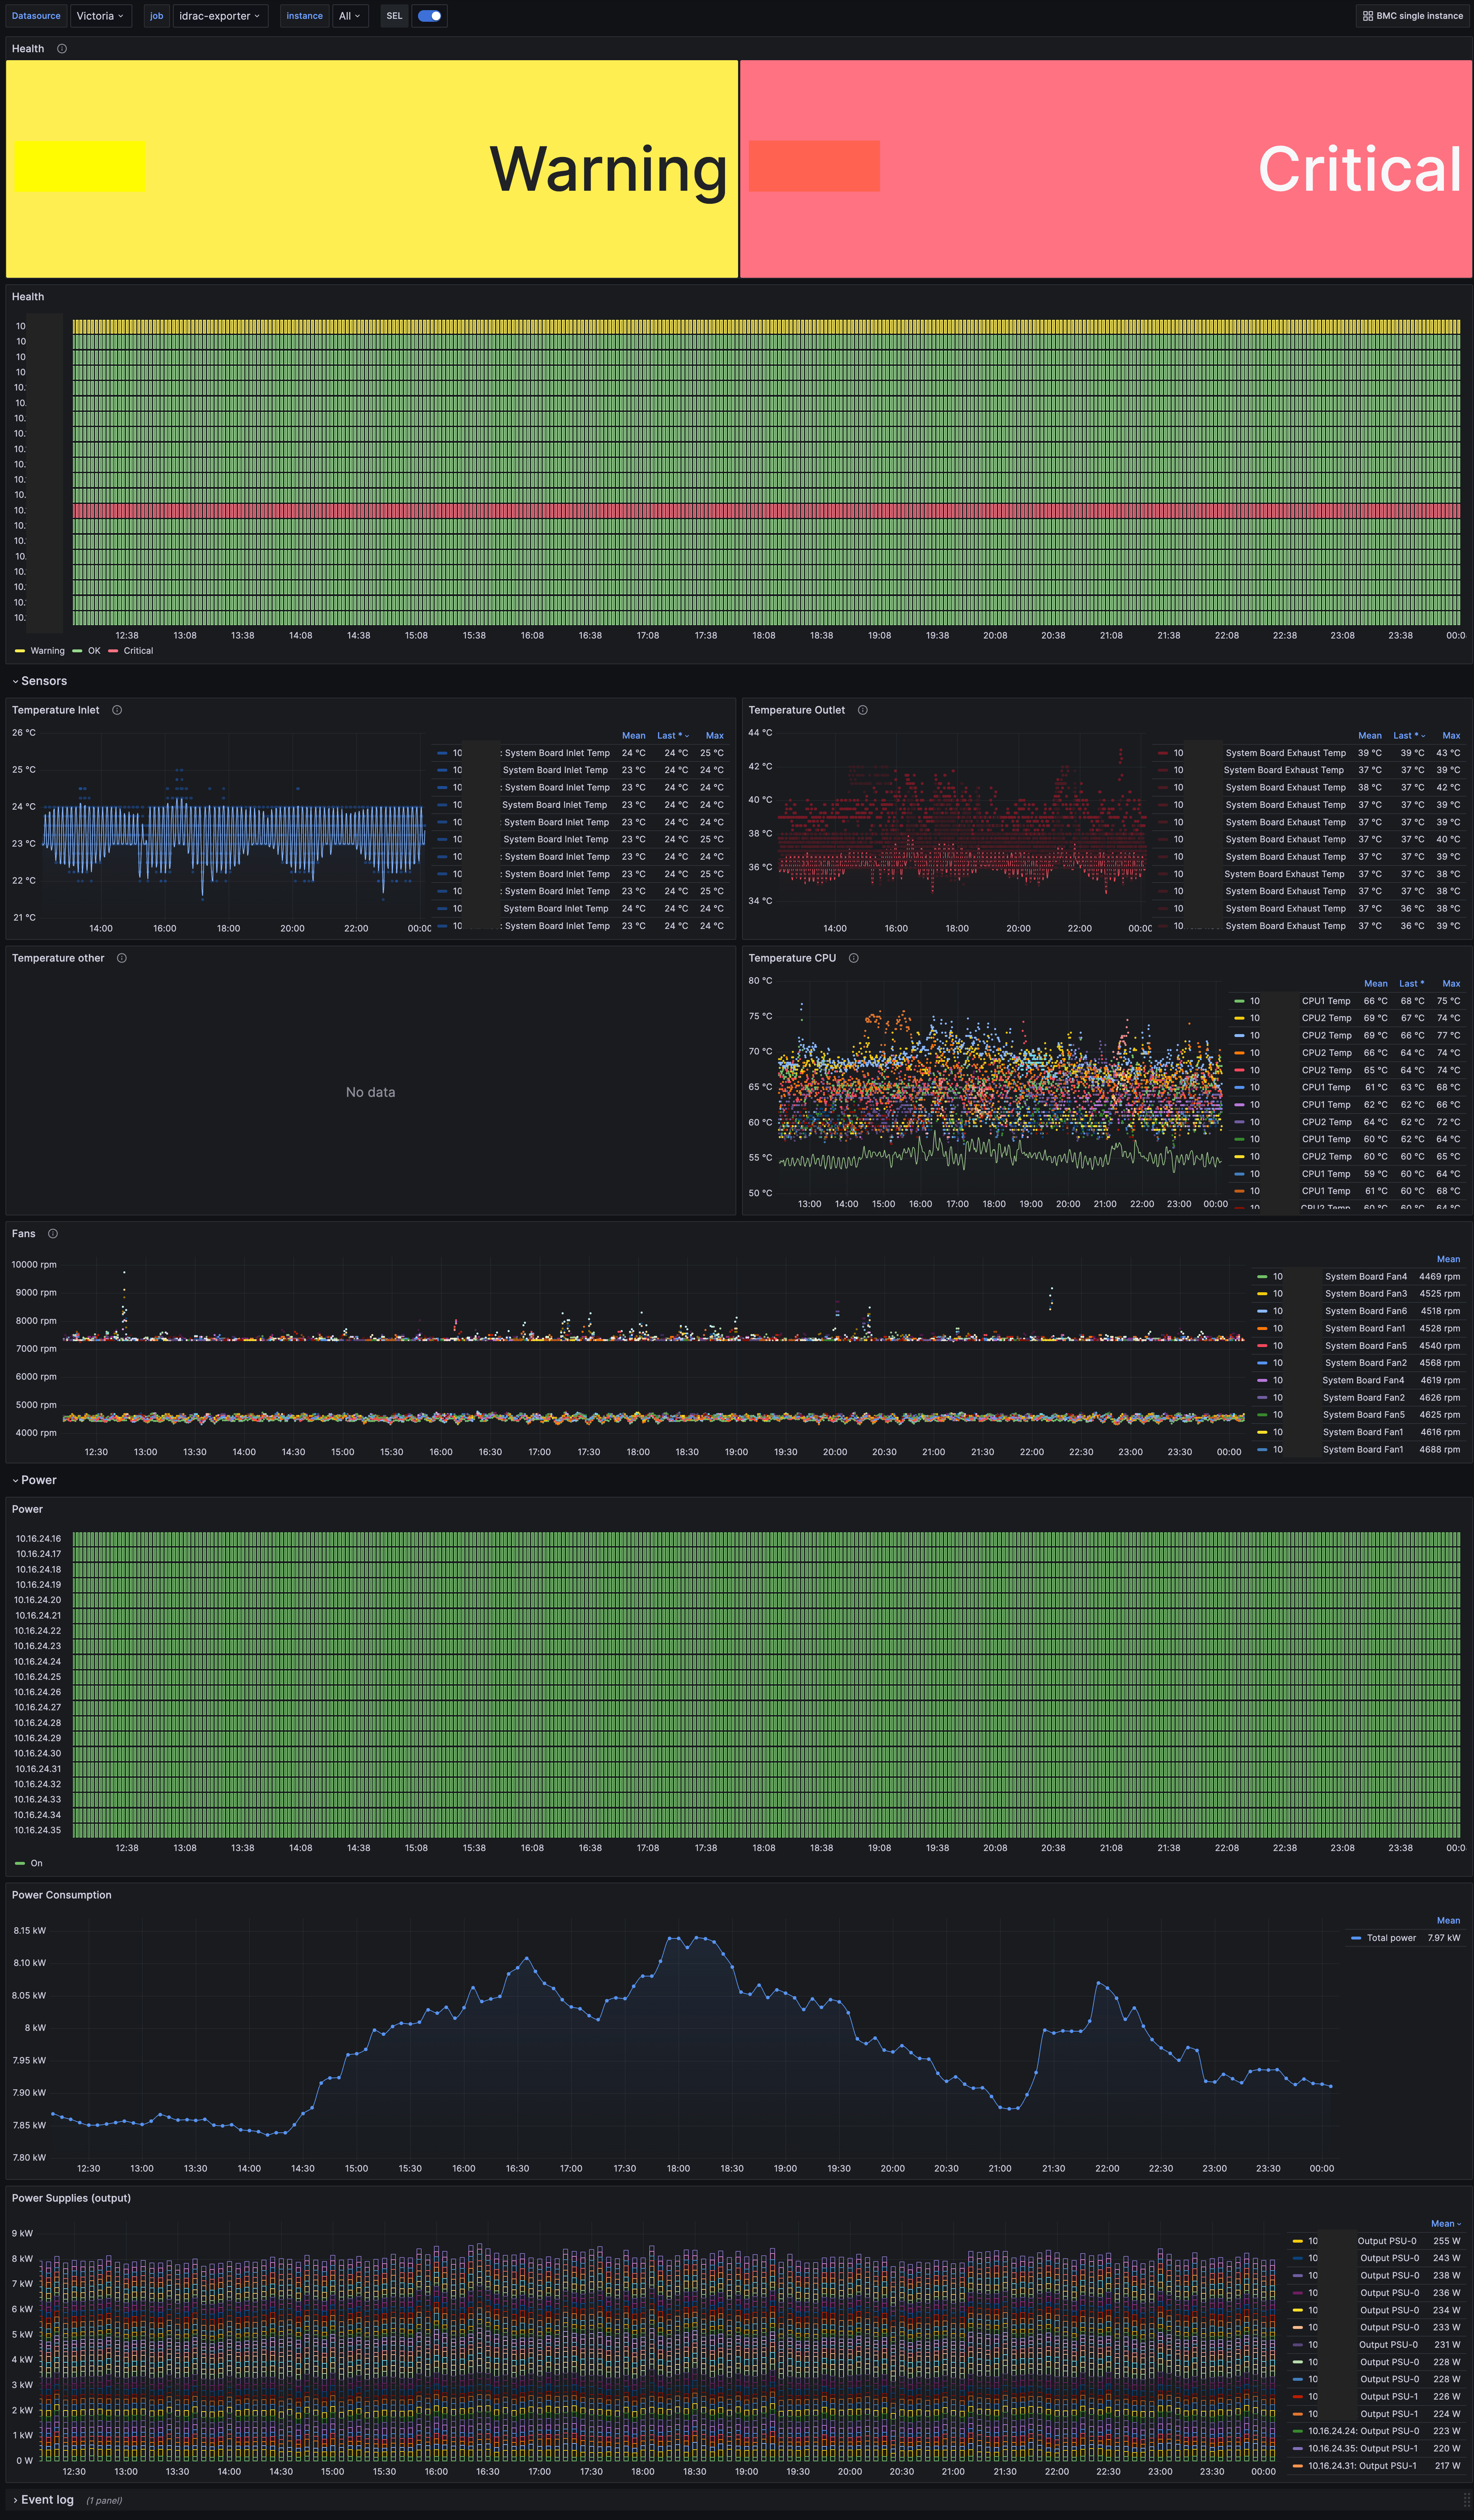
This is a simple iDRAC (and iLO and XClarity) exporter for Prometheus. The exporter uses the Redfish API to communicate with iDRAC and it supports the regular /metrics endpoint to expose metrics from the host passed via the target parameter. For example, to scrape metrics for an iDRAC instance on the IP address 123.45.6.78 call the following URL address.
http://localhost:9348/metrics?target=123.45.6.78
Every time the exporter is called with a new target, it tries to establish a connection to iDRAC. If the target is unreachable or if the authentication fails, the status code 500 is returned together with an error message.
The program supports several different systems, because they all follow the Redfish standard. The exporter has been tested on the following systems.
- HPE iLO
- Dell iDRAC
- Lenovo XClarity
The exporter is written in Go and it can be downloaded and compiled using:
go install github.com/mrlhansen/idrac_exporter/cmd/idrac_exporter@latestThere is a Dockerfile in the repository for building a container image. To build it locally use:
docker build -t idrac_exporter .There are also pre-built images available on Docker Hub. To download and run these images, simply use the following command.
docker run -v /host-path/config.yml:/etc/prometheus/idrac.yml -p 9348:9348 mrlhansen/idrac_exporterRemember to set the listen address to 0.0.0.0 when running inside a container.
There is also an official Helm chart for installing the exporter in a Kubernetes cluster.
helm repo add idrac-exporter https://mrlhansen.github.io/idrac_exporter
helm install idrac-exporter/idrac-exporter idrac-exporterIn the configuration file for the iDRAC exporter you can specify the bind address and port for the metrics exporter, as well as username and password for all iDRAC hosts. By default, the exporter looks for the configuration file in /etc/prometheus/idrac.yml but the path can be specified using the -config option.
address: 127.0.0.1 # Listen address
port: 9348         # Listen port
timeout: 10        # HTTP timeout (in seconds) for Redfish API calls
hosts:
  123.45.6.78:
    username: user
    password: pass
  default:
    username: user
    password: pass
metrics:
  system: true
  sensors: true
  power: true
  events: false
  storage: false
  memory: false
  network: false
As shown in the above example, under hosts you can specify login information for individual hosts via their IP address, otherwise the exporter will attempt to use the login information under default. The login user only needs read-only permissions. Under metrics you can select what kind of metrics that should be returned, as described in more detail below.
For a detailed description of the configuration, please see the sample-config.yml file. In this file you can also find the corresponding environment variables for the different configuration options.
Because the metrics are collected on-demand it can take several minutes to scrape the metrics endpoint, depending on how many metrics groups are selected in the configuration file. For this reason, you should carefully select the metrics of interest and make sure Prometheus is configured with a sufficiently high scrape timeout value.
The exporter can expose the metrics listed in the sections below. For all <name>_health metrics the value has the following mapping.
- 0 = OK
- 1 = Warning
- 2 = Critical
These metrics include power, health, and LED state, total memory size, number of physical processors, BIOS version and machine information.
idrac_system_power_on 1
idrac_system_health{status="OK"} 0
idrac_system_indicator_led_on{state="Lit"} 1
idrac_system_memory_size_bytes 137438953472
idrac_system_cpu_count{model="Intel(R) Xeon(R) Gold 6130 CPU @ 2.10GHz"} 2
idrac_system_bios_info{version="2.3.10"} 1
idrac_system_machine_info{manufacturer="Dell Inc.",model="PowerEdge C6420",serial="abc",sku="xyz"} 1
These metrics include temperature and FAN health and speeds.
idrac_sensors_temperature{id="0",name="Inlet Temp",units="celsius"} 19
idrac_sensors_fan_health{id="0",name="FAN1A",status="OK"} 0
idrac_sensors_fan_speed{id="0",name="FAN1A",units="rpm"} 7912
These metrics include two sets of power readings. The first set is PSU power readings, such as power usage, total power capacity, input voltage and efficiency. Be aware that not all metrics are available on all systems.
idrac_power_supply_health{id="0",status="OK"} 0
idrac_power_supply_output_watts{id="0"} 74.5
idrac_power_supply_input_watts{id="0"} 89
idrac_power_supply_capacity_watts{id="0"} 750
idrac_power_supply_input_voltage{id="0"} 232
idrac_power_supply_efficiency_percent{id="0"} 91
The second set is the power consumption for the entire system (and sometimes also for certain subsystems, such as the CPUs). The first two metrics are instantaneous readings, while the last four metrics are the minimum, maximum and average power consumption as measure over the reported interval.
idrac_power_control_consumed_watts{id="0",name="System Power Control"} 166
idrac_power_control_capacity_watts{id="0",name="System Power Control"} 816
idrac_power_control_min_consumed_watts{id="0",name="System Power Control"} 165
idrac_power_control_max_consumed_watts{id="0",name="System Power Control"} 177
idrac_power_control_avg_consumed_watts{id="0",name="System Power Control"} 166
idrac_power_control_interval_in_minutes{id="0",name="System Power Control"} 1
This is not exactly an ordinary metric, but it is often convenient to be informed about new entries in the event log. The value of this metric is the Unix timestamp for when the entry was created.
idrac_events_log_entry{id="1",message="The process of installing an operating system or hypervisor is successfully completed",severity="OK"} 1631175352
These metrics include information about disk drives in the machine.
idrac_drive_info{id="Disk.Direct.1-1:AHCI.Slot.5-1",manufacturer="MICRON",mediatype="SSD",model="MTFDDAV240TDU",name="SSD 1",protocol="SATA",serial="xyz",slot="1"} 1
idrac_drive_health{id="Disk.Direct.1-1:AHCI.Slot.5-1",status="OK"} 0
idrac_drive_capacity_bytes{id="Disk.Direct.1-1:AHCI.Slot.5-1"} 240057409536
idrac_drive_life_left_percent{id="Disk.Direct.1-1:AHCI.Slot.5-1"} 100
These metrics include information about memory modules in the machine.
idrac_memory_module_info{ecc="MultiBitECC",id="DIMM.Socket.A2",manufacturer="Micron Technology",name="DIMM A2",rank="2",serial="xyz",type="DDR4"} 1
idrac_memory_module_health{id="DIMM.Socket.A2",status="OK"} 0
idrac_memory_module_capacity_bytes{id="DIMM.Socket.A2"} 34359738368
idrac_memory_module_speed_mhz{id="DIMM.Socket.A2"} 2400
These metrics include health of network interfaces, as well as health, link speed, and link status for each of the network ports.
idrac_network_interface_health{id="NIC.Embedded.1",status="OK"} 0
idrac_network_port_health{id="NIC.Embedded.1-1",interface="NIC.Embedded.1",status="OK"} 0
idrac_network_port_link_up{id="NIC.Embedded.1-1",interface="NIC.Embedded.1",status="Up"} 1
idrac_network_port_speed_mbps{id="NIC.Embedded.1-1",interface="NIC.Embedded.1"} 1000
These metrics contain information about the exporter itself, such as build information and how many errors that have been encountered when scraping the Redfish API.
idrac_exporter_build_info{goversion="go1.21.1",revision="xyz",version="1.0.0"} 1
idrac_exporter_scrape_errors_total 0
The exporter currently has three different endpoints.
| Endpoint | Parameters | Description |
|---|---|---|
/metrics |
target |
Metrics for the specified target |
/reset |
target |
Reset internal state for the specified target |
/health |
Returns http status 200 and nothing else |
For the situation where you have a single idrac_exporter and multiple iDRACs to query, the following prometheus.yml snippet can be used.
scrape_configs:
  - job_name: idrac
    static_configs:
      - targets: ['123.45.6.78', '123.45.6.79']
    relabel_configs:
      - source_labels: [__address__]
        target_label: __param_target
      - source_labels: [__param_target]
        target_label: instance
      - target_label: __address__
        replacement: exporter:9348
Here 123.45.6.78 and 123.45.6.79 are the iDRACs to query, and exporter:9348 is the address and port where idrac_exporter is running.
There are two Grafana Dashboards in the grafana folder, one that shows an overview of all systems and one that shows information for a specific machine. Thanks to @7840vz for creating these!

