We implement two density modeling methods:
- (Unsupervised) Gaussian mixture model (GMM): notebook implementation
- (Supervised) mixture density network (MDN): notebook implementation
Learning the parameters of a Gaussian mixture model on a synthetic example works remarkably well. Red and blue graphs are normalized histograms of training data and samples from the optimized GMM and black curve shows the pdf of the GMM. We model and depict the GMM per each dimension..
Among with basic functionalities to train and sample, our mixture density network implementation is able to compute epistemic and aleatoric uncertainties of the prediction in our paper.
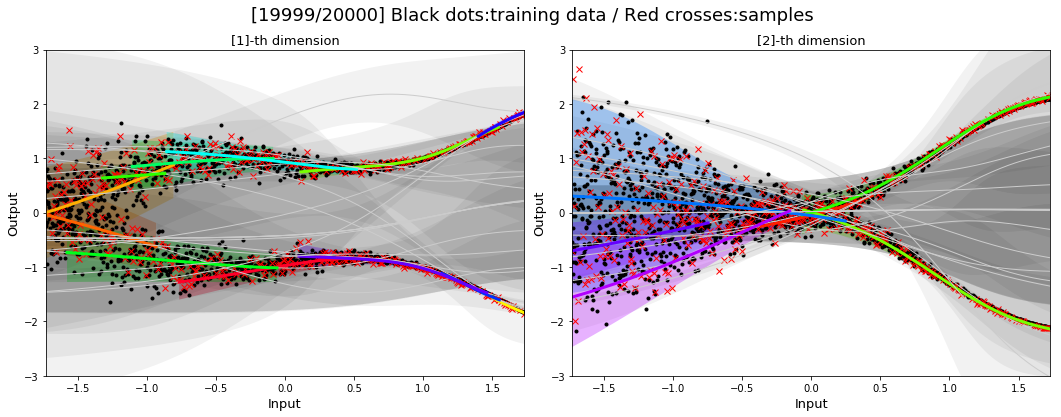
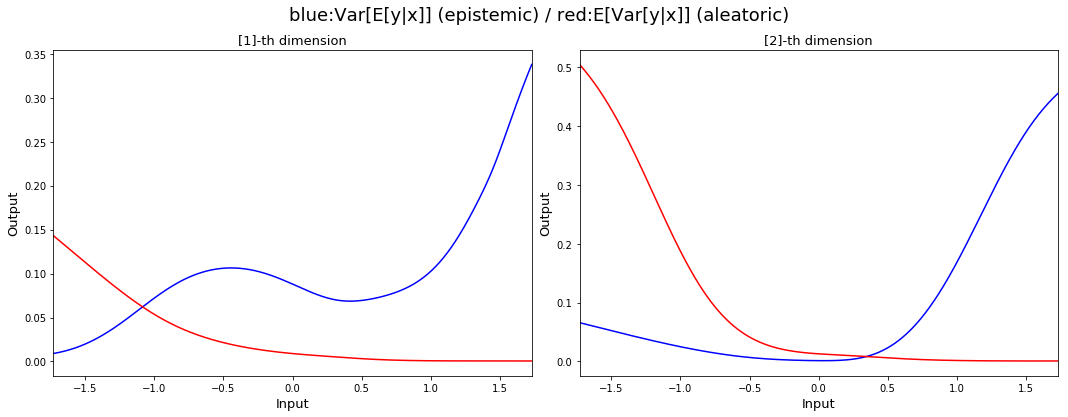
Black dots and red crosses indicate training data and sampled outputs from the MDN, respectively. We can see that the MDN successfully model the given training data. Each mixture whose mixture probability is bigger than certain theshold is shown with colors and mixtures with small mixture probabilities are shown with gray colors.Red and blue curves correspond to aleatoric and epistemic uncertainties of the prediction, respectively, where the aleatoric uncertainty models measurement noise and the epistemic uncertainty models the inconsistencies in the training dataset. As the level of (Gaussian) noise decreases as the input increases, the red curve decreases as input increases. On the contrary, the blue curve increases as input increases as the training data are collected from two different functions whose discrepancy increases as input increases.
We use tf.contrib.distributions to implement the computational graphs which supports Categorical, MultivariateNormalDiag, Normal, and the most important Mixture. tf.contrib.distributions.Mixture api provides a number of useful apis such as cdf, cross_entropy, entropy_lower_bound, kl_divergence, log_prob, prob, quantile, and sample.


