- End of year Lab Test 2019
- Supplemental Lab Test 2019
- Supplemental Lab Test 2018
- Lab Test 1 2016
- Supplemental lab test 2 2016
- End of year lab test 2016 Solution
- Lab Test 1 2015
- Email: bryan.duggan@tublin.ie
- Twitter: @skooter500
- My website & other ways to contact me
- Monday 7th - Assignment 1 submission 15%
- Monday 14th - December Lab Test 25%
- Assignment 2 - 15%
- Assignment 3 - 20% - Friday 14th May - Submit your assignment git repo here
- End of Year lab test - 25% - Thursday 13th May
Here is a video of the program you will be writing today:
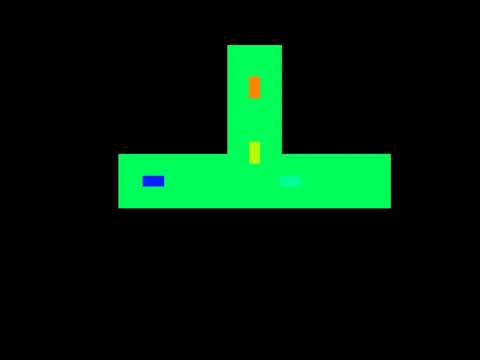
What is happening:
- Every second a new car will spawn at the top of the screen and drive towards the center
- Cars have random colours
- When a car reaches the center, it will randomly decide to drive to the left or the right
Marking Scheme:
| Description | Marks |
|---|---|
| Drawing the roads | 20 marks |
| Car movement | 20 marks |
| Car choosing left or right | 20 marks |
| Multiple cars | 20 marks |
| Any other cool stuff you want to add | 20 marks |
- Video of the first class (using git with processing)
- Video of the second class (Using git with Unity)
- git manual (read the first 3 chapters)
- Video of the first class on Teams
- Video of the second class
- Setting up a Processing project in GitHub (kinda)
OR! Make this in Processing:
- Classes
- pushMatrix & popMatrix
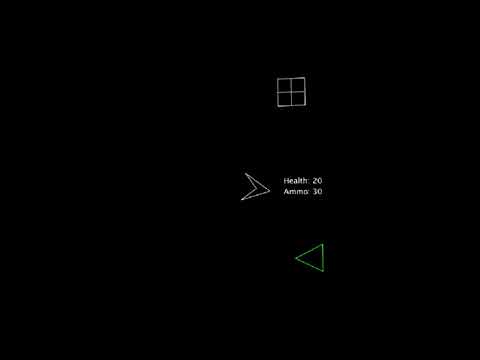
Today you can make two more classes to encapsulate the behaviour of health and ammo powerups as per this video:
To complete this lab!
- Make a class called Health. Initially it should spawn off screen and move in a random direction onscreen. It could spawn from the top, bottom, left or right side of the screen. You can use yasc.random to generate random numbers. I wrote a respawn method on the class and call it from the constructor to set the initial x, y, dx and dy values. Notice how the health is drawn and notice in the video that the health is rotating as well as moving. If the health goes off the side of the screen it should respawn. Don't forget to create an instance of the Health in YASC.java and call update and render.
- Do the same for Ammo
- Add health and ammo fields to the Player class and print the health and ammo beside the player
- Add code in YASC.pde to check collisions between the player and either of the powerups and add to the player's health and ammo stats. To check collisions, you can check id the distance between the player and the powerup < the sum of the two radii. You can use the
distfunction to calculate the distance.
Please answer this survey.
Try the end of year lab test from 2020:
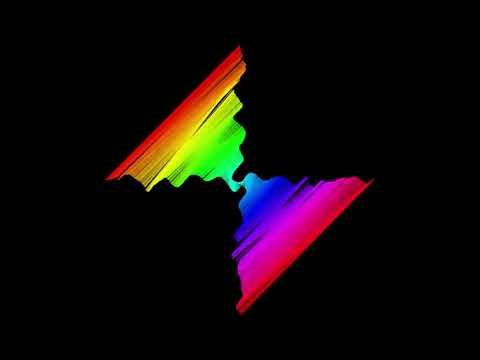
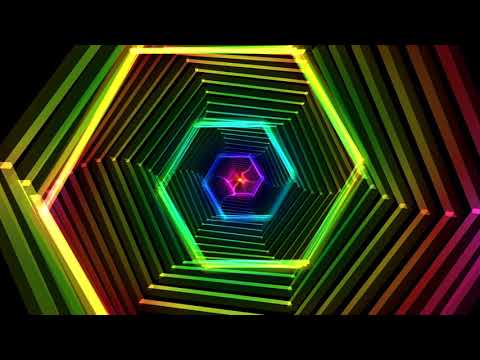
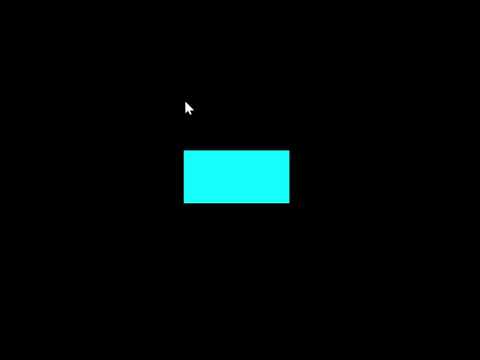
This is a video of what you will be making today:
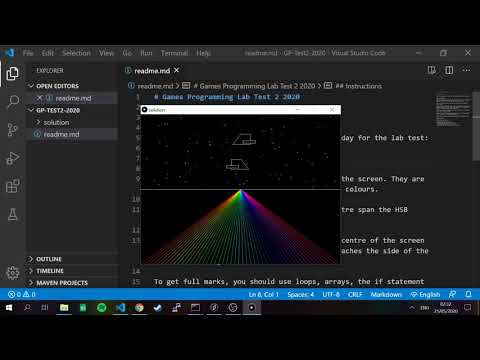
What is happening:
There are 100 stars drawn in the top half of the screen. They are drawn as crosses. They have randomly assigned colours.
The colours on the lines that meet in the centre span the HSB colour space.
There are two "spaceships" that start in the centre of the screen and move towards the sides. When each ship reaches the side of the screen, it changes direction and comes back.
To get full marks, you should use loops, arrays, the if statement and a class in your solution.
Work in a team or 2 or 3 and make a Processing sketch on the theme:
"What does love mean to me"
Here is some inspiration from sketches my class wrote a couple of years ago

Here is a visual you can make today!
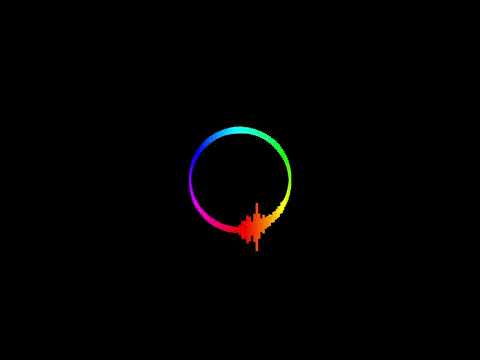
- Start with this starter sketch (from last week)
- Modify the sketch as follows:
- Firstly modify the keyPressed method to detect the keys 6 and 7 and assign the value to the which variable:
if (keyCode >= '0' && keyCode <= '7')
{
  which = keyCode - '0';
}
- Set up the FFT object as per the sketch we made today
- Make it so that when you press 6 it shows the FFT from left to right (same as the class). To do this put code into the draw function.
- Modify the FFT visual like this:
- Lerp the elements in the FFT array (the same way we lerped the waveform). To do this you should create a new array called
lerpedFFTthe same size as fft.specSize() and put in the lerping code - Draw above and below the center line. Values in the FFT array go from 0 - 1 instead of from -1 to 1 as in the waveform array
- Lerp the elements in the FFT array (the same way we lerped the waveform). To do this you should create a new array called
- Now write code in draw for the 7 visual that draws the circular visual in the video. To do this you will can map i from 0 to fft.specSize() onto the range 0 to TWO_PI to get the angle and use sin & cos to calculate the points on the outside of the circle (remember spirals from semester 1??). Now draw lines from above the point to below the point using the lerpedFFT values
Download this starter sketch and audio file and run it. Have a look at the code and make sure you understand it. Have a look at the keyPressed function. This starts and restarts the audio file when you press space. Also it sets the value of the which variable to be the numbers 0-5 when you press the appropriate key on the keyboard.
Ok now check out this video of 5 visuals you can make today. Pressing the keys 0-4 on the keyboard should change the visual in your sketch.
-
0 - The wavy lines visual
-
1 - The waveform
-
2 - The waveform drawn down the 4 sides of the screen
-
3 - The circle - Use the lerped amplitude to control the size of the circle
-
4 - The square - Again use the lerped amplitude to control the size of the square. You can also use rectMode(CENTER) to make the x and y parameters of the rect function determine the center of the rect rather than the coordinates of the top left corner
-
5 - There is no visual associated with 5 in the video, so come up with your own!
Try the lerping technique on the actual audio samples. To do this:
- Make an array of type float the same size as the audio buffer
- Lerp each element of the array to the corresponding buffer element
- Draw using the lerped values instead of the buffer values
- Make this little ellipse whose size and speed of movement is controlled by how loud the sound it:
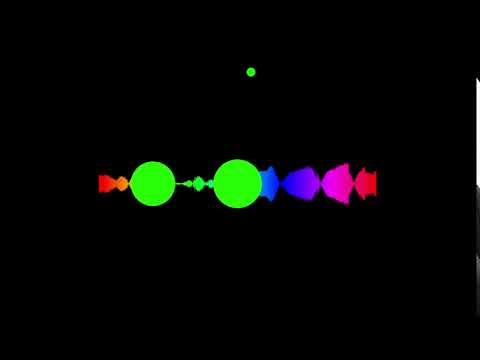
- See what other drawing elements - rectangles, triangles etc you can control using the average amplitude of the sound
Some audio responsive stuff I have been working on recently:
Today you will be making this (click for video):
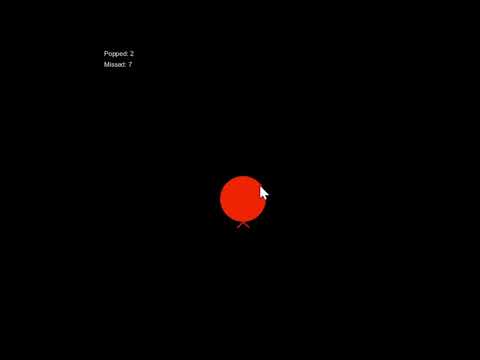
What is happening:
- Balloons appear from the bottom of the screen and "float" to the top as per the video
- As balloons float to the top they gradually get smaller
- Each new balloon has a random color
- The player has to pop the balloons by clicking on the balloon. This increases the popped score by one
- If a balloon reaches the top without being popped, this increases the missed score by one
Name your sketches with your student number and name. For example:
C1234567_Duggan_Bryan.pde
Also include your student number and name in the comments of your sketch.
Submit your work through Brightspace
Marking Scheme:
| Feature | Marks |
|---|---|
| Declaring appropriate variables | 20 marks |
| Drawing the balloon | 20 marks |
| Moving the balloon | 20 marks |
| Scoring | 30 marks |
| Jazz | 10 marks |
Hints!
- To check for the mouse press, you can add a void mousePressed() function. This function gets called automatically when the mouse is pressed on a sketch window.
- You can check for balloon popping by checking if the distance from the balloon centre to the mouse and y < radius of the balloon. You can use the dist function for this
- To get full marks, make some functions other than draw and setup
- To get the 10 Jazz marks, add something else cool to your sketch like sound or Perlin noise or something else cool you know in Programming.
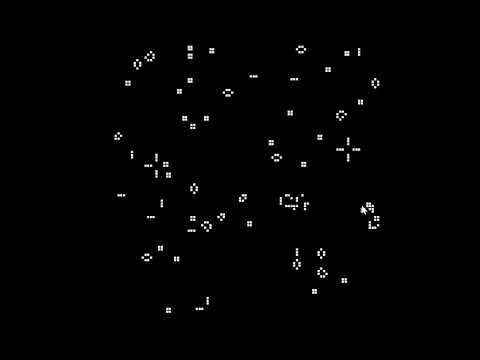
Write the method updateBoard. This method should iterate over the board cell by cell using a nested for loop and apply the Game of Life rules:
- If the cell is alive (true) then if the cell has exactly 2 or 3 neighbours it survives (gets set to true), otherwise it dies (gets set to false)
- If the cell is dead (false) then it comes to life if it has exactly 3 neighbours, otherwise it stays dead in the next generation.
This is important so please read carefully!!
You have to read values from board, but you set values in next, which is a 2D array the same size as board. At the end of the method you swap board and next. I have left the swapping code in the method, so you don't have to write it. This is so that when you for example, kill a cell or bring a cell to life, you don't screw up the count for other cells in that generation.
Again - in updateBoard
- Write a nested for loop that gets the row and col for every cell
- Count the neighbours (use the method we wrote on Monday for this)
- Check if the cell is alive, apply the rules for alive cells to next
- If the cell is dead, apply the rules for dead cells to next
- Swap board and next
Your game of life should look like this if you implement the rules correctly (click the image for a video):
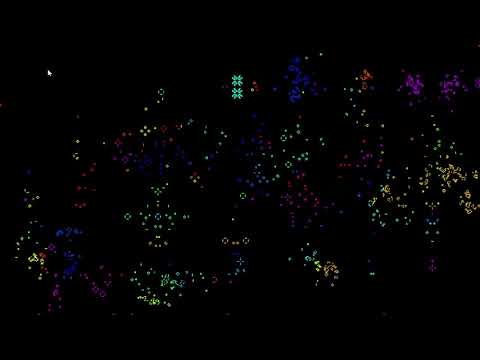
Some extra things you can implement you can see in the video:
- Increase size and change the size of the screen and see what effect this has on the simulation
- Press space to pause and resume the simulation
- Press 1 to randomise the board again
- Press 2 to clear the board
- Press 3 to draw a cross shape and see how it evolves
- Drag the mouse across the window to set cells at the mouse position to be alive.
Some extra things you can implement that are not in the video
- Draw a glider at the mouse position. This is starting pattern that will evolve a pattern that walks across the screen
- Draw a Gosper Gun at the mouse position. This is a starting pattern that will spawn creatures indefinitely
You can read more about these starting patterns and others in this wikipedia article and see examples in this video:
If you want to learn more about cellular automata check out:
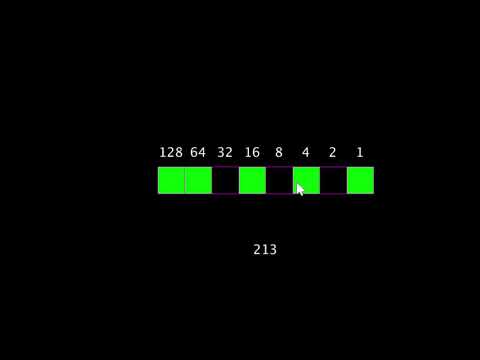
- Learn how to allocate arrays
- Learn how to store values in arrays
- Practice iterating arrays
Here is the rainfall data recorded at the Dublin Airport over 12 months of 2010:
| Month | Amount in mm |
|---|---|
| Jan | 45 |
| Feb | 37 |
| March | 55 |
| April | 27 |
| May | 38 |
| June | 50 |
| July | 79 |
| August | 48 |
| September | 104 |
| October | 31 |
| November | 100 |
| December | 58 |
Create a Processing sketch and do the following:
- Allocate two arrays for storing the month names and the rainfall data
- Calculate the average rainfall for that year
- Calculate the month with the highest rainfall
- Calculate the month with the lowest rainfall
Now see if you can write code to generate the following graphs of the rainfall data:
A bar chart:

Start by drawing the axis, then draw the ticks and print the text, then draw the bars. You can use textAlign(CENTER, CENTER) to align the text
Use the HSB color space to assign different colors to each bar
-
A trend line:
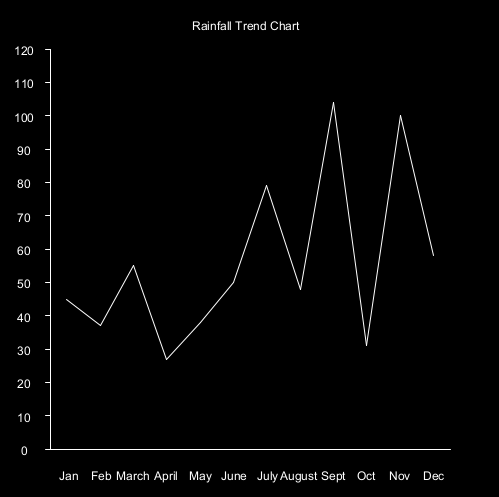
This one is a bit trickier because you have to calculate the start xy and end xy for each line. Your for loop for drawing the trend lines can start at 1 instead of 0 and then you can get the previous value for the start of each line by taking rainfall[i - 1].
-
A pie chart
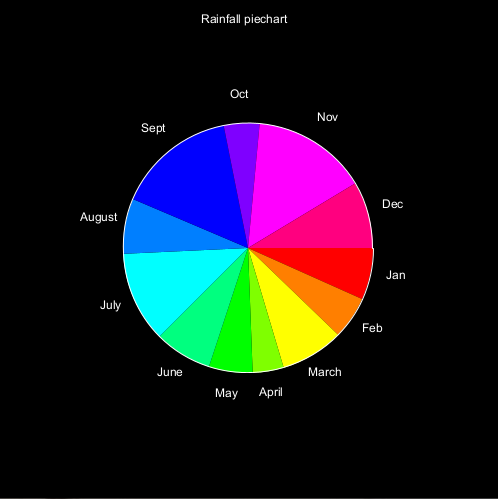
You can use the the arc function to draw arcs and sin & cos to calculate the x and y coordinates to print the text. This one is the most challenging. Remember that a pie chart shows the proportion of each data point in the sum of all the data, so you will have to calculate the sum of all the rain fall and figure out how much each month is relative to the sum. It's best to draw the segments first and then draw the labels. Your map function might look something like this:
float angle = map(rainfall[i], 0, sum, 0, TWO_PI);


- Print the numbers from 0 to 9. How many numbers are printed?
- Print the numbers from 9 to 0 in reverse order
- Print all the even numbers between 100 and 200
- Sum all the numbers between 0 and 100
- Calculate the factorial of 10
- Print the even numbers between 200 and 100 backwords
- Print the 6 times tables up to 12
- Print the Fibonacci sequence up to 100
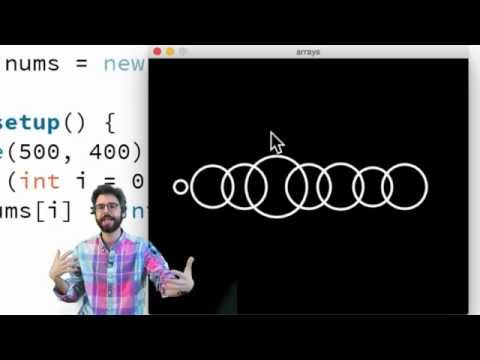
- Draw 6 circles across the screen
- Draw 10 rects across the screen
- Draw 20 horizontal lines
- Draw a stripe pattern across the screen
- Draw a grid of squares
- Practice generating lots of different shapes with loops in processing
- Be creative and make something beautiful in code
Draw the following shapes. Use variables and loops in your solutions!
I'ts best to spend some time thinking about the variables and how they are changing before writing code:
These require ONE loop:

This shape draws lines from the sides that all meet in the middle. This can be done using one loop, but is better with two:

This sketch always draws 10 equally sized circles across the screen. This should work no matter what you set the screen size to. You should also declare a variable to hold the number of circles to draw so that if you change this number, the sketch should still work:

This sketch places circles around the outside of a bigger circle to make a flower pattern. Once you figure this out, you can modify it to do something cool with colours:

This sketch prints the numbers of the clock around in a circle:

This sketch requires you to put one loop inside another and also use a boolean variable, though there are other ways to do this:

This is what it looks like when all the above code is in one sketch:

Try and draw this using ONE for loop:

Write a sketch that can draw regular polygons like squares, pentagons, octogons etc:

Write a sketch that can draw stars like these:

Use a for loop, rect and HSB colours to draw this:

Use sin and cos to draw this:

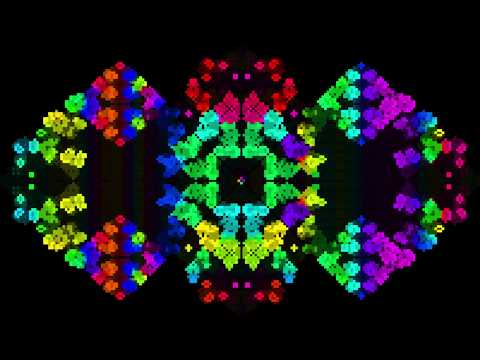
Use a loop and the HSB colour space:

Use ellipse to draw this:

Use a nested loop (a loop inside a loop) to draw this:

- Full source code for BugZap
- Moving letters library - Install this into the
Documents\Processing\libraries\movingletters\libraryfolder on your computer

Exercises
-
Left side right of screen exercise
-
4 Quadrants exercise
-
Rectangle rollover
-
Inside a circle
-
Ball left & right
-
Ball bounce around the screen
-
Keyboard handling
-
State
-
3 exercises. Click the image for video:
Part 1
- Download and unzip the starter project for today's lab
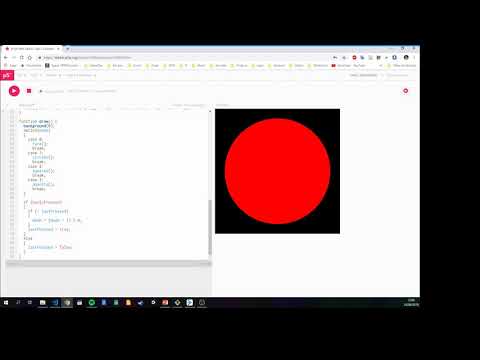
- Open the sketch and you will see that it displays a picture from Rick and Morty
- The aim of the lab today is to modify the sketch so that it displays a button in the center of the screen
- When the button is clicked, it should change colour and play the sound file. Here is what the finished sketch should look like:

- To do this you will need to declare some new varialbes and use the if statement
Part 2
Try and make this sketch that draws a face that starts in the center of the screen and moves to the edge of the screen and then follows around the outside of the screen

- Use numeric variables in a sketch
- Use operatorts on variables
- Use trigonometry
- Make beautiful things
A person flying a kite has released 176m of string. The string makes an angle of 27° with the ground. How high is the kite? How far away is the kite horizontally? Write a processing sketch sketch to draw and solve the problem.
- Solve the problem on paper first
- Make variables for stringLen, theta, kHeight, kDist and any other variables you need
- Assign the values that you know to the variables
- Write code to calculate the kith height and horizontal distance values
- Write code to draw the scenario

You can use the function text to print text to the screen and nf to format a number to a certain number of dp's. For example text("Price: " + nf(p, 10, 2), 10, 50). You can look these functions up in the Processing reference.
Experiment with the spirals sketch and see what kind of crazy beautiful spirals you can make. Use variables for colour gradients, use different shapes etc etc.
- Practice drawing
- Learn how to use operators with variables
Here is a youtube video of 4 sketches you can program today:
In your solution use the following processing functions:
- fill
- rect
- ellipse
- background
- stroke
- noStroke
And the mouseX and mouseY varibles. You can also use the + - * / operators
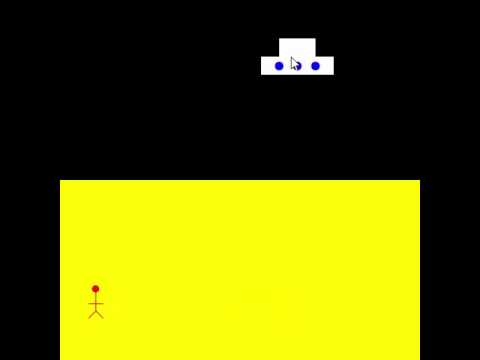
What is happening:
- The ground takes up half the window size
- The spaceship is 100 pixels wide and is centered around the mouse position.
- The person starts at the right side of the screen and moved from right to left
Use variables wherever practical in your sketch and calculate positions and sizes relative to these variables.
Bonus!
There are few things you can try (but you will probably have to read ahead and figure out how the if statement works)
- Come up with a more beautiful looking spaceship and person
- Change the colours of everything
- Make a car that drives from left to right
- When the person reaches the left side of the screen, he should switch direction
- Make the lights on the spaceship flash different colours
- Know good online resources
- Check out previous student work
- Learn how to draw using Processing
- Become familiar with writing and running sketches
- Check out the Processing reference
- Check out The Coding Train
- Check out these Sci-Fi user interfaces made by last years OOP students
- Check out these music visualisers made in Processing by previous programming students
- If you are curious, check out some of my creature videos
- Look up the following methods in the Processing reference to make sure you are clear about the syntax and parameters:
- noStroke
- noFill
- line
- ellipse
- rect
- background
- stroke
- fill
- size
- arc
- triangle
Write sketches to draw the following shapes:


