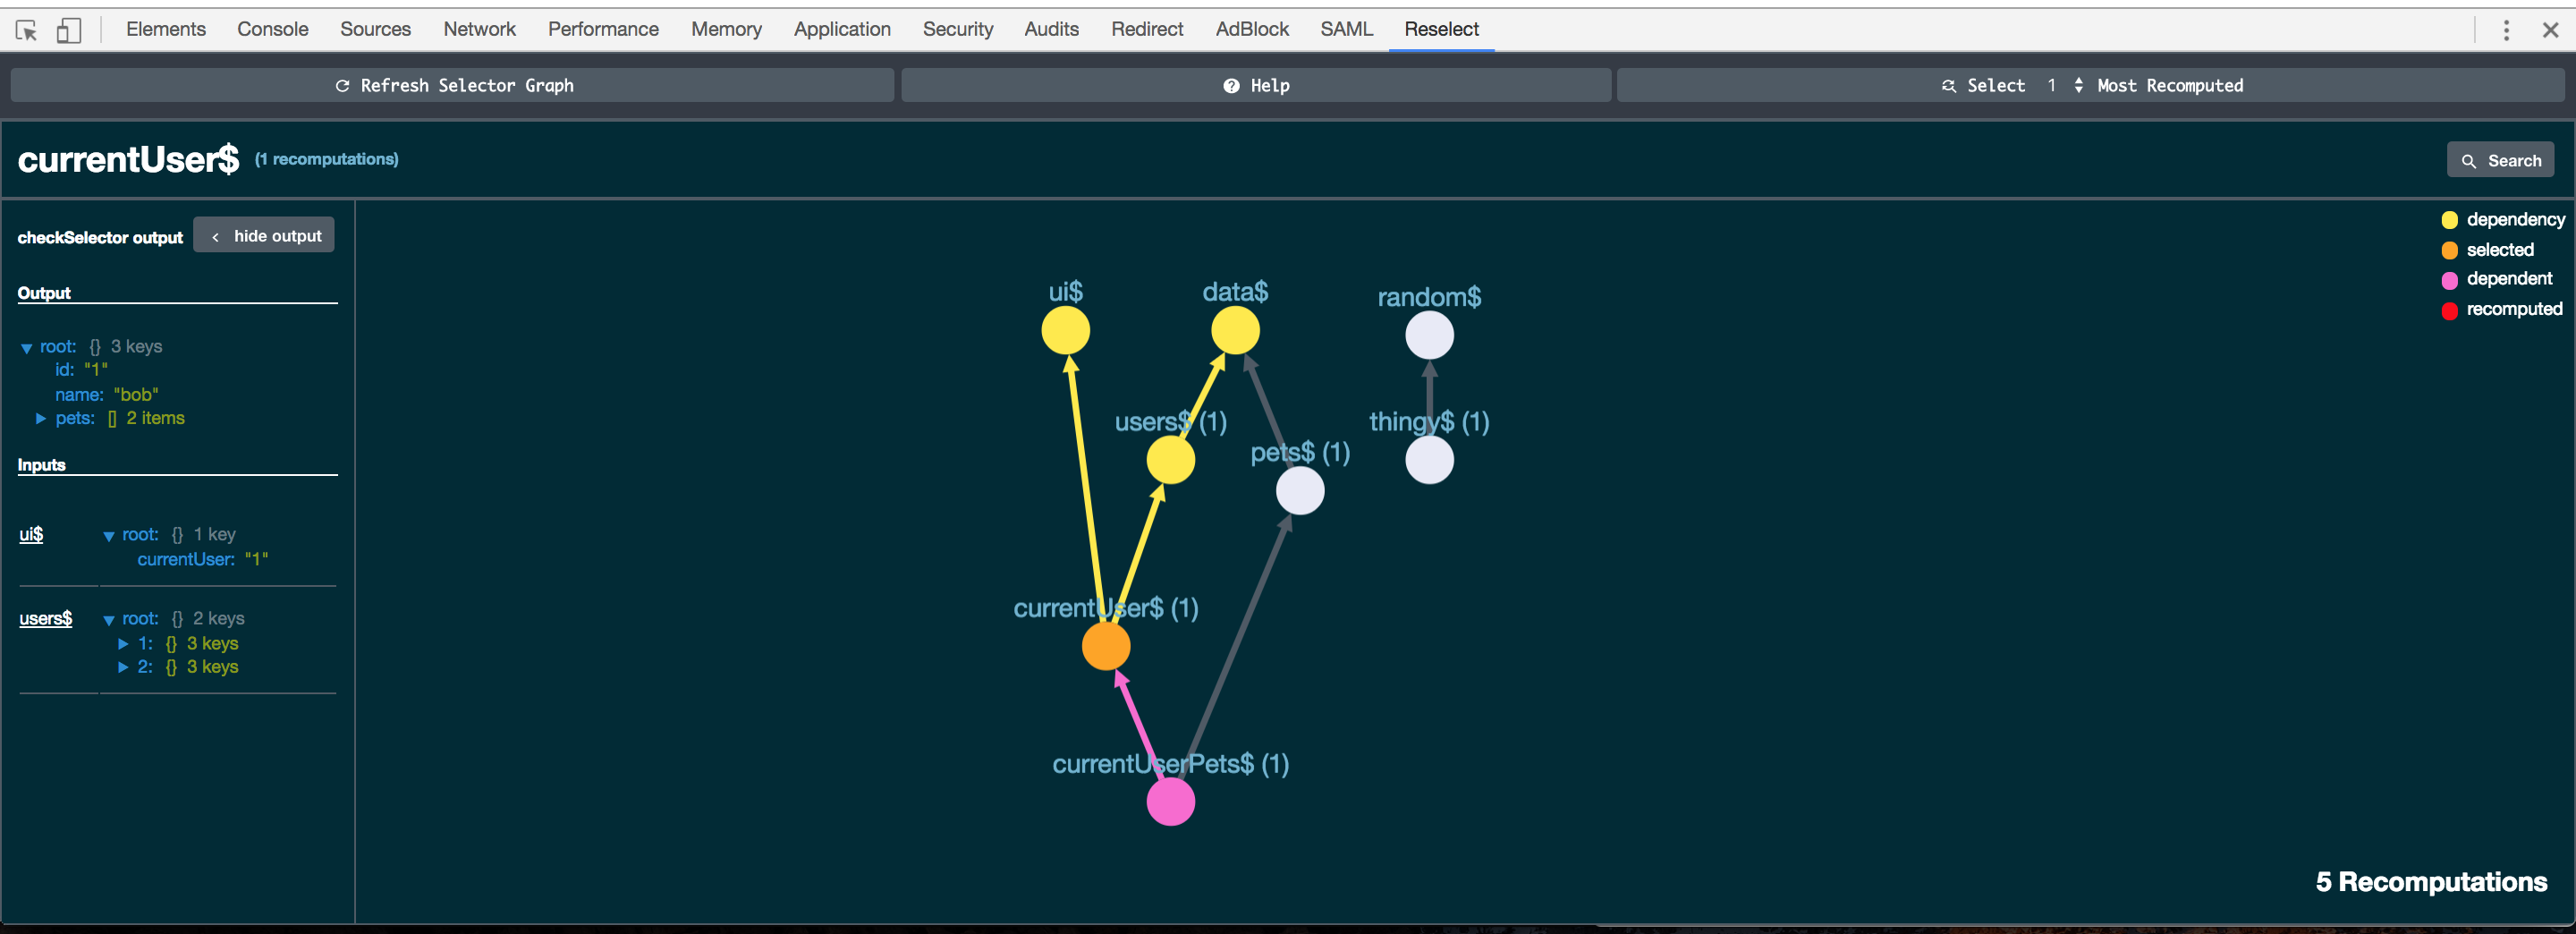
Tools for working with the reselect library: Check selector dependencies, inputs, outputs, and recomputations at any time without refreshing!
export const data$ = (state) => state.data;
export const ui$ = (state) => state.ui;
export const users$ = createSelector(data$, (data) => data.users);
export const currentUser$ = createSelector(ui$, users$, (ui, users) => users[ui.currentUser]);
...

// in configureStore.js
import * as selectors from './selectors.js'
import * as ReselectTools from 'reselect-tools'

ReselectTools.getStateWith(() => store.getState())  // allows you to get selector inputs and outputs
ReselectTools.registerSelectors(selectors) // register string names for selectors
...
ReselectTools.checkSelector('currentUser$')
=> {
	inputs: [{currentUser: 1}, users: {1: {name: 'sam'}}]
	outputs: {name: 'sam'},
	dependencies: [ui$, users$],
	recomputations: 1,
    isNamed: false,
    selectorName: 'currentUser$'
}
selectorGraph()
=> {
	nodes: {
		"data$": {
			name: "data$",
			recomputations: "N/A"
		},
		"ui$": {
			name: "ui$",
			recomputations: "N/A"
		},
		"users$": {
			name: "user$",
			recomputations: 1
		},
		"currentUser$": {
			name: "currentUser$",
			recomputations: 1
		},
	},
	edges: [
		{ from: users$, to: data$ },
		{ from: users$, to: data$ },
		{ from: currentUser$, to: users$ },
		{ from: currentUser$, to: ui$ },
	]
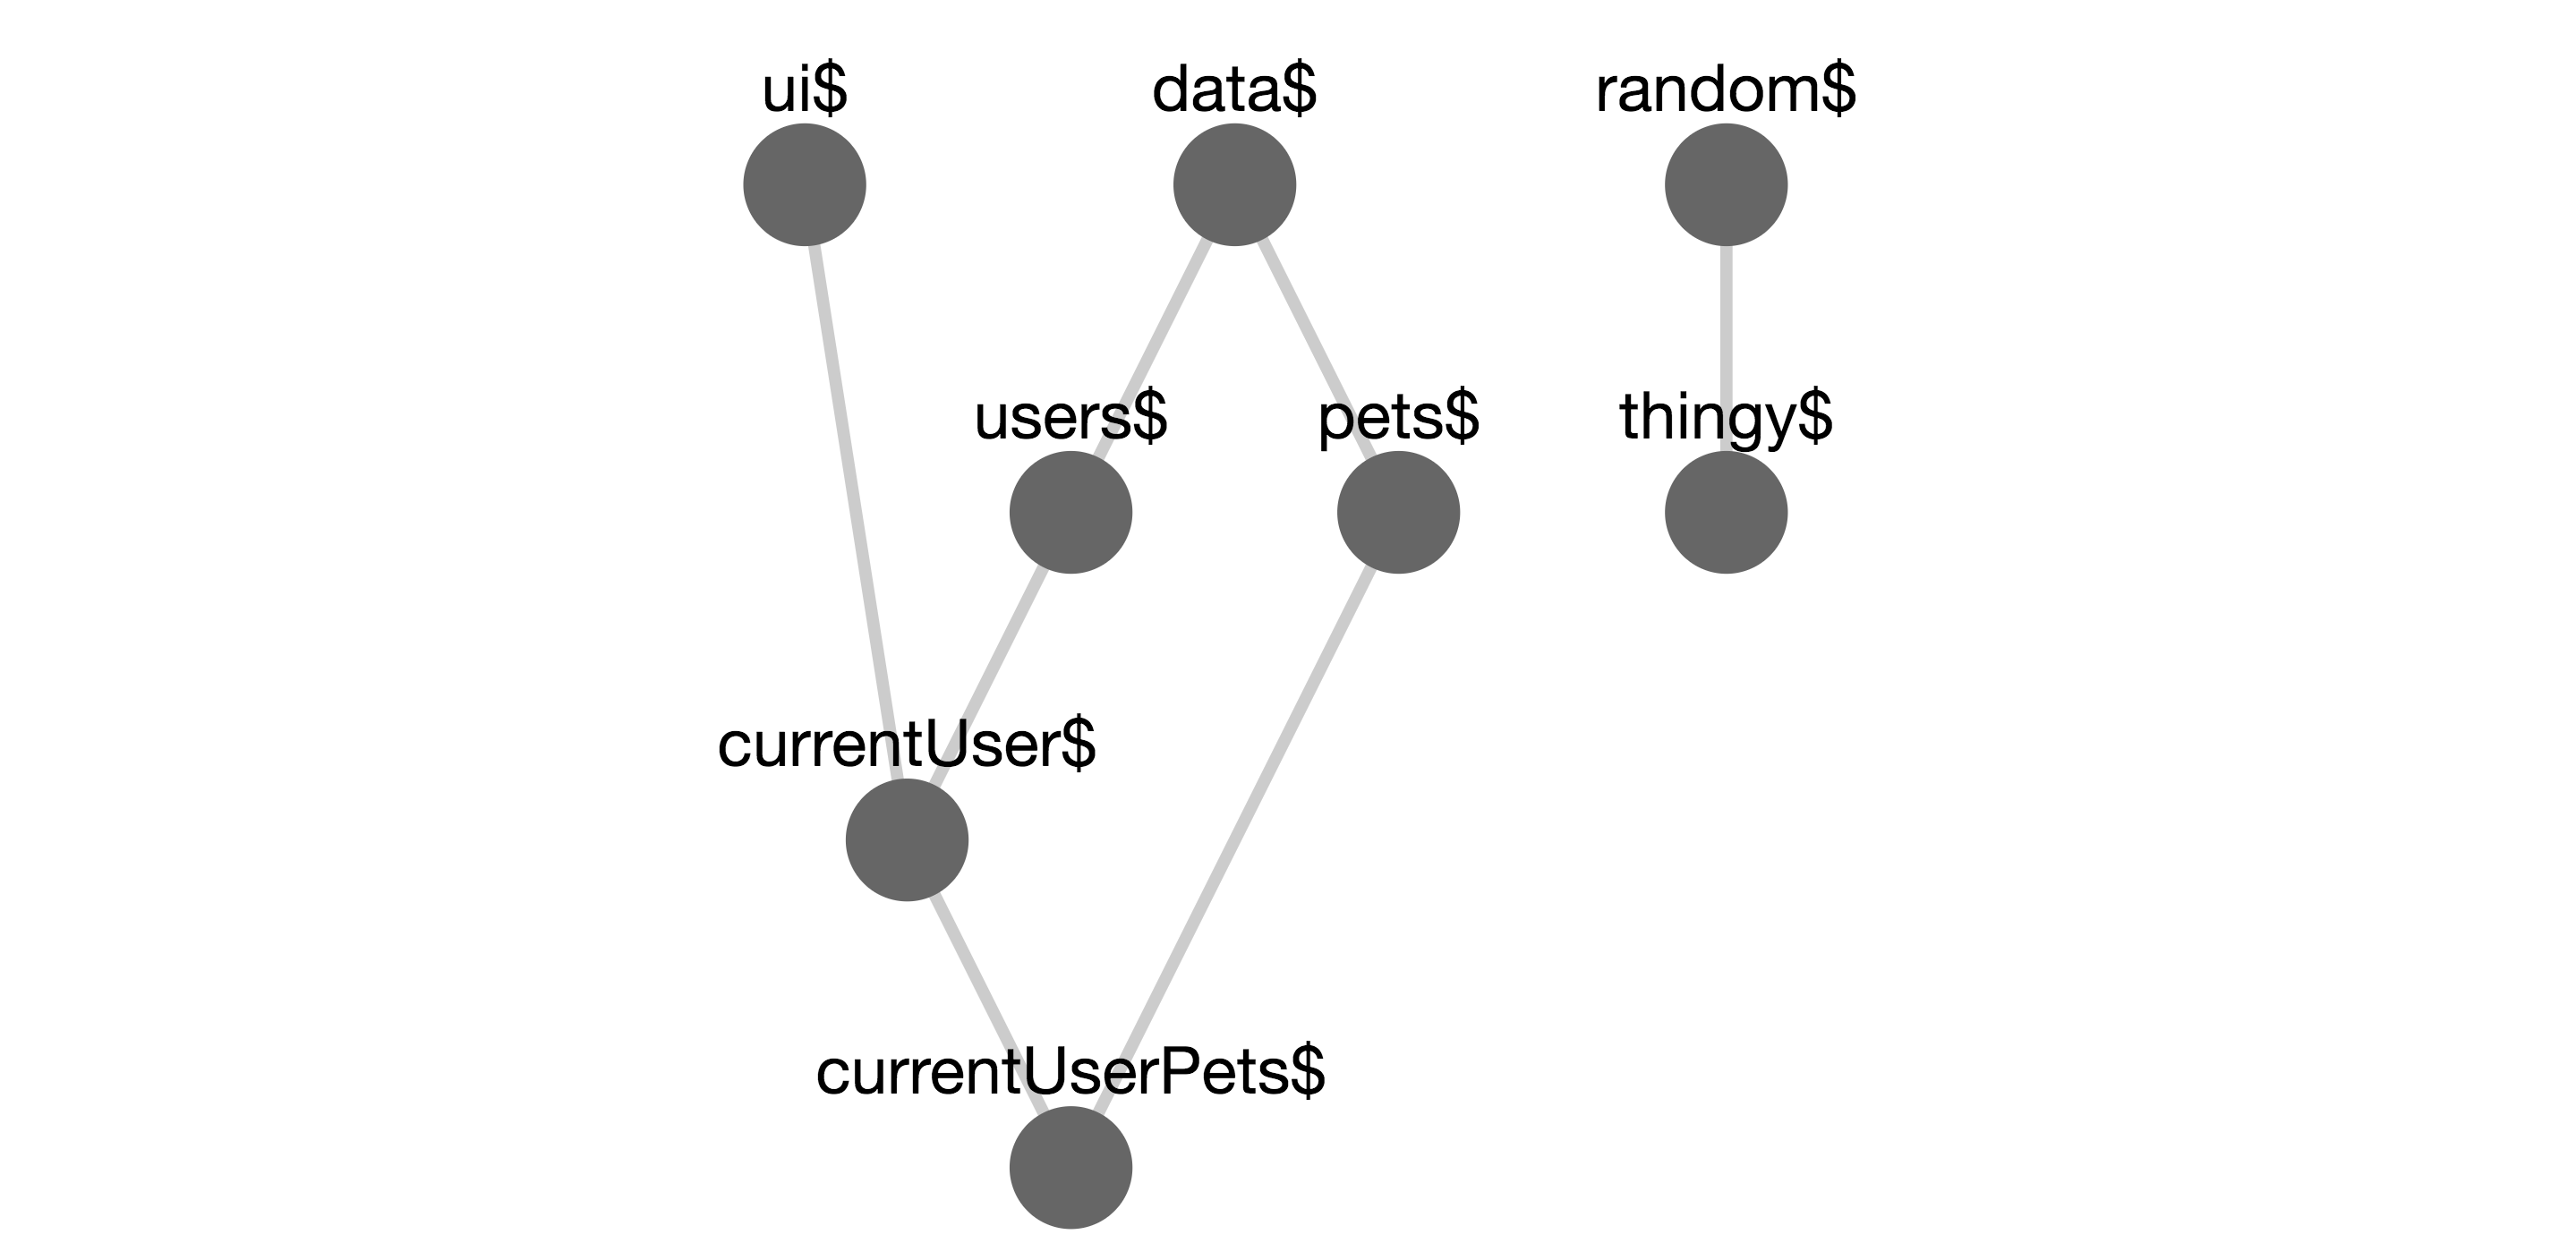
}It's handy to visualize the application state tree with the Redux Devtools. But I was using selectors a lot, and there was no easy way to visualize the computed state tree. So, I created this library to output graphs like this one:
This library was intended to be used with the chrome extension. However, it can be still be useful without the chrome extension installed. The chrome extension will be useless without this library.
See the original reselect issue here.
Firstly, I apologize in advance that this section is required. It would be great to match the experience of installing redux devtools or react's. Hopefully the tools will be more tightly integrated with reselect at some point and these steps won't be necessary.
-
Install the Package
npm install -s reselect-tools -
Grab the Chrome Extension
-
Building the Graph:
In order to start building out the selector graph, we need to tell the devtools about the selectors.
import { registerSelectors } from 'reselect-tools'
registerSelectors({ mySelector$ })
If you're keeping all your selectors in the same place, this is dead simple:
import * as selectors from './selectors.js'
registerSelectors(selectors)
That's it! At this point you should be able to open the devtools and view the selector graph.
The tools will automatically discover and name dependencies of the selectors. If you want to override the name of a selector, you can do so:
const foo$ = createSelector(bar$, (foo) => foo + 1); foo$.selectorName = 'bar$' // selector will show up as 'bar' -
Checking Selector Inputs and Outputs
Imagine that your tests are passing, but you think some selector in your app might be receiving bad input from a depended-upon selector. Where in the chain is the problem? In order to allow
checkSelectorand by extension, the extension, to get this information, we need to give Reselect Tools some way of feeding state to a selector.import store from './configureStore' ReselectTools.getStateWith(() => store.getState())
The example is running here. Grab the extension and take a look!
npm run example
getStateWith accepts a function which returns the current state. This state is then passed into checkSelector. In most cases, this will be store.getState()
Outputs information about the selector at the given time.
By default, outputs only the recomputations of the selector.
If you use getStateWith, it will output the selector's input and output values.
If you use registerSelectors, you can pass it the string name of a selector.
const two$ = () => 2;
const four$ = () => 4
const mySelector$ = createSelector(two$, four$, (two, four) => two + four)
registerSelectors({ mySelector$ })
getStateWith(() => null)

checkSelector('mySelector$')  // {
									 inputs: [2, 4],
									 output: 6,
									 dependencies: [two$, four$],
									 recomputations: 1,
}selectorGraph outputs a POJO with nodes and edges. A node is a selector in the tree, and an edge goes from a selector to the selectors it depends on.
selectorGraph()
//  {
//  	nodes: {
//  		"data$": {
//  			name: "data$",
//  			recomputations: "N/A"
//  		},
//  		"ui$": {
//  			name: "ui$",
//  			recomputations: "N/A"
//  		},
//  		"users$": {
//  			name: "user$",
//  			recomputations: 1
//  		},
//  		"currentUser$": {
//  			name: "currentUser$",
//  			recomputations: 1
//  		},
//  	},
//  	edges: [
//  		{ from: users$, to: data$ },
//  		{ from: users$, to: data$ },
//  		{ from: currentUser$, to: users$ },
//  		{ from: currentUser$, to: ui$ },
//  	]
// }Nodes in the graph are keyed by string names. The name is determined by the selectorKey function. This function takes a selector and outputs a string which must be unique and consistent for a given selector. The defaultSelectorKey looks for a function name, then a match in the registry, and finally resorts to calling toString on the selector's resultFunc.
See the tests for an alternate selectorKey.
Add a named selector to the graph. Set selector names as keys and selectors as values.
If you're using an unsupported browser, or aren't happy with the extension, you can still get at the data.
The dev tools bind to your app via this global:
  window.__RESELECT_TOOLS__ = {
    selectorGraph,
    checkSelector
  }
Even without the devtools, you can call __RESELECT_TOOLS__.checkSelector('mySelector$') from the developer console or __RESLECT_TOOLS__.selectorGraph() to see what's going on. If the JSON output of the graph is hard to parse, there's an example of how to create a visual selector graph here.
MIT


