corona19
R package for import datasets of Coronavirus disease 2019 in South Korea from Data-Science-for-COVID-19.
Installation
# install.packages("remotes")
remotes::install_github("youngwoos/corona19")
Example
library(corona19)

# time
time <- getdata("time")
time
#> # A tibble: 57 x 7
#>    date        time   test negative confirmed released deceased
#>    <date>     <int>  <int>    <int>     <int>    <int>    <int>
#>  1 2020-03-16     0 274504   251297      8236     1137       75
#>  2 2020-03-15     0 268212   243778      8126      834       75
#>  3 2020-03-14     0 261335   235615      8086      714       72
#>  4 2020-03-13     0 248647   222728      7979      510       67
#>  5 2020-03-12     0 234998   209402      7869      333       66
#>  6 2020-03-11     0 222395   196100      7755      288       60
#>  7 2020-03-10     0 210144   184179      7513      247       54
#>  8 2020-03-09     0 196618   171778      7382      166       51
#>  9 2020-03-08     0 188518   162008      7134      130       50
#> 10 2020-03-07     0 178189   151802      6767      118       44
#> # ... with 47 more rows

library(ggplot2)
ggplot(data = time, aes(x = date, y = confirmed)) +
  geom_area(color="darkblue", fill="lightblue") +
  scale_x_date(date_breaks = "weeks" , date_labels = "%m-%d")
# patient
patient <- getdata("patient")
patient
#> # A tibble: 2,119 x 18
#> patient_id global_num sex birth_year age country province city disease
#> <dbl> <int> <chr> <int> <chr> <chr> <chr> <chr> <lgl>
#> 1 1000000001 2 male 1964 50s Korea Seoul Gang~ NA
#> 2 1000000002 5 male 1987 30s Korea Seoul Jung~ NA
#> 3 1000000003 6 male 1964 50s Korea Seoul Jong~ NA
#> 4 1000000004 7 male 1991 20s Korea Seoul Mapo~ NA
#> 5 1000000005 9 fema~ 1992 20s Korea Seoul Seon~ NA
#> 6 1000000006 10 fema~ 1966 50s Korea Seoul Jong~ NA
#> 7 1000000007 11 male 1995 20s Korea Seoul Jong~ NA
#> 8 1000000008 13 male 1992 20s Korea Seoul etc NA
#> 9 1000000009 19 male 1983 30s Korea Seoul Song~ NA
#> 10 1000000010 21 fema~ 1960 60s Korea Seoul Seon~ NA
#> # ... with 2,109 more rows, and 9 more variables: infection_case <chr>,
#> # infection_order <int>, infected_by <chr>, contact_number <int>,
#> # symptom_onset_date <date>, confirmed_date <date>, released_date <date>,
#> # deceased_date <date>, state <chr>
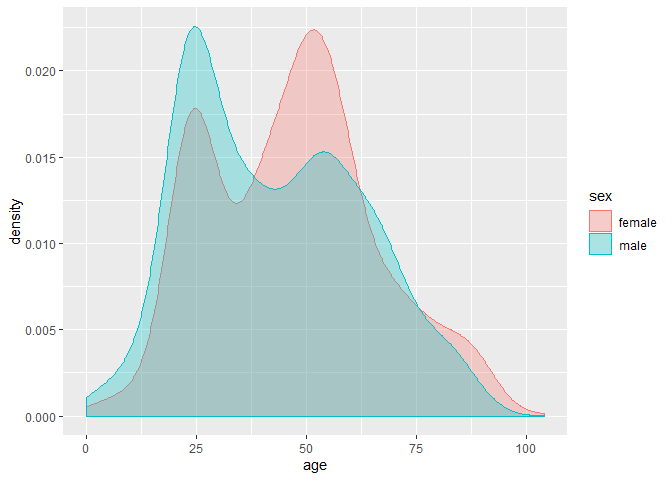
ggplot(data = patient, aes(x = 2020-birth_year, fill = sex, colour = sex)) +
geom_density(alpha = 0.3) +
xlab("age")# route
route <- getdata("route")
library(dplyr)
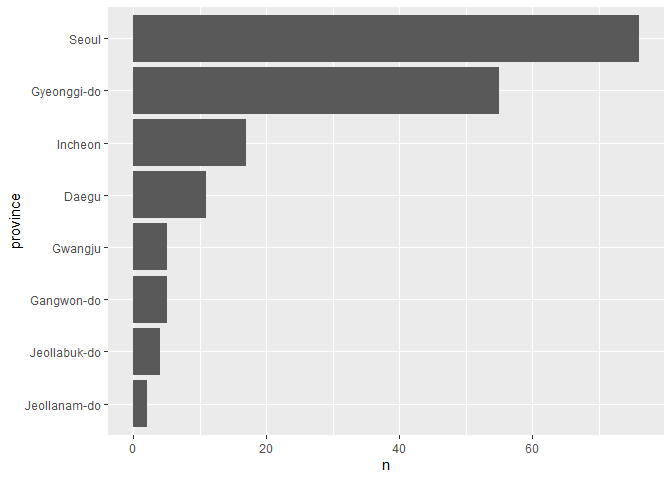
cnt_province <- route %>%
count(province, sort = T) %>%
head(10)
cnt_province
#> # A tibble: 8 x 2
#> province n
#> <chr> <int>
#> 1 Seoul 76
#> 2 Gyeonggi-do 55
#> 3 Incheon 17
#> 4 Daegu 11
#> 5 Gangwon-do 5
#> 6 Gwangju 5
#> 7 Jeollabuk-do 4
#> 8 Jeollanam-do 2
ggplot(cnt_province, aes(x = reorder(province, n), y = n)) +
geom_col() +
coord_flip() +
xlab("province")Dataset infomation
dataset-detailed-description.ipynb
getdata() import 3 of these datasets.
patientfrom PatientInfo.csvroutefrom PatientRoute.csvtimefrom Time.csv


