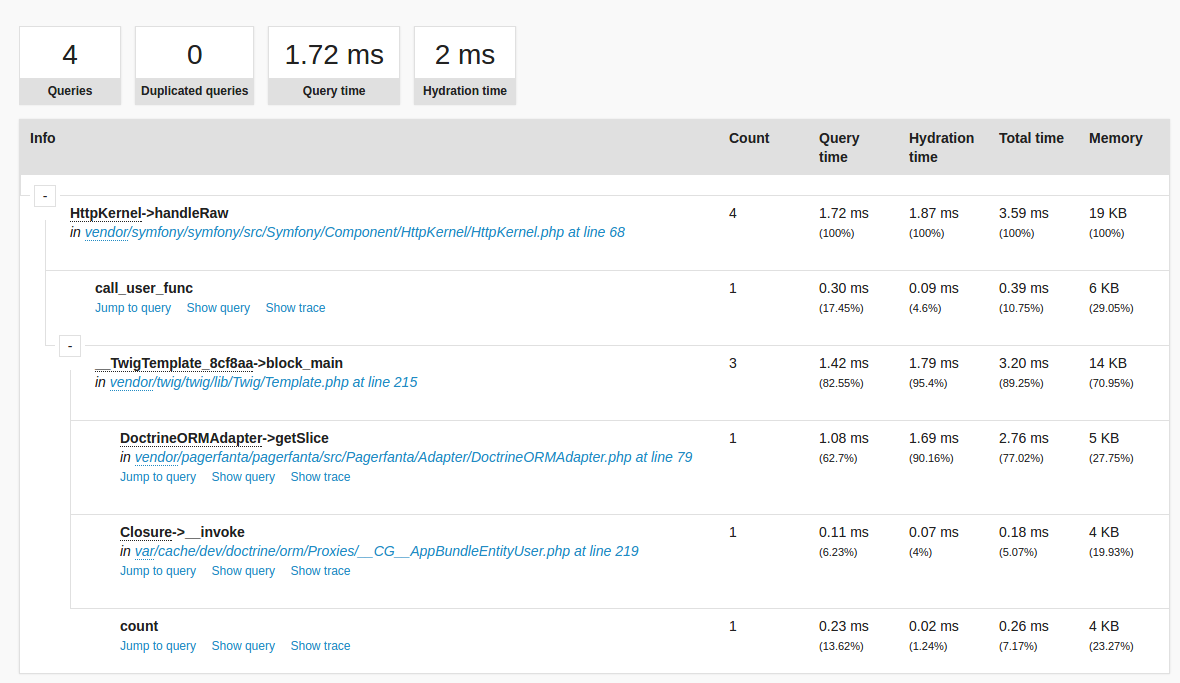
PixersDoctrineProfilerBundle enables new panel in Symfony debug toolbar that allows you to profile performance of your database queries.
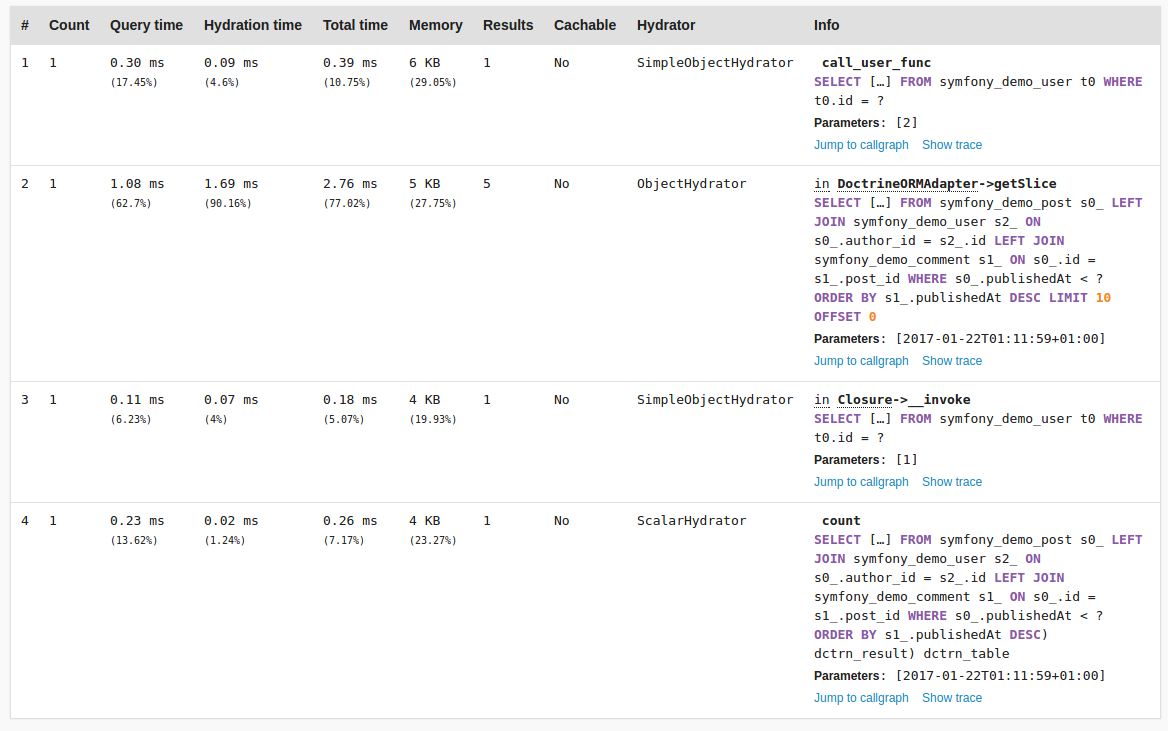
It provides extensive information about Doctrine queries execution time and memory. It also allows you to spot inefficient places of your application by showing hot spots in a call graph.
Features:
-
Detailed query profile
- Memory usage
- Cache info
- Duplicated queries detection
-
Hydration profiling
- Type and time of hydration
- Visualization in performance panel (execution timeline)
-
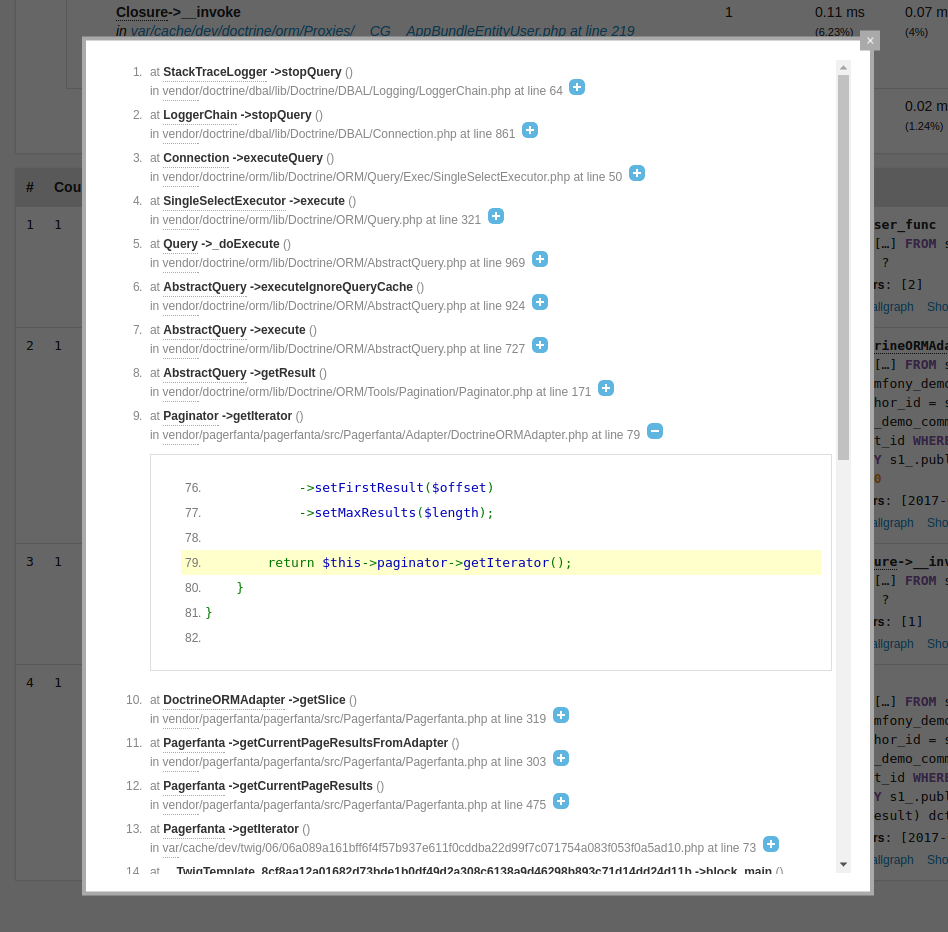
Query origin
- Call graph with metrics aggregated across code
- Stacktrace of the queries
Installation is a two step process.
-
Install this bundle using Composer:
$ composer require pixers/doctrine-profiler-bundle
-
Enable bundle in AppKernel (only in dev and test environments):
// in AppKernel::registerBundles()

if (in_array($this->getEnvironment(), array('dev', 'test'))) {
    // ...
    $bundles[] = new Pixers\DoctrineProfilerBundle\PixersDoctrineProfilerBundle();
}
DoctrineProfilerBundle is an initiative of PIXERS:
- Bartłomiej Ojrzeński bartlomiej.ojrzenski@pixers.pl
- Antoni Orfin antoni.orfin@pixers.pl
Copyright 2017 PIXERS Ltd - www.pixersize.com
Licensed under the BSD 3-Clause


