This project uses docker-compose to build and run all the required services. Make sure you have docker-compose installed (https://docs.docker.com/compose/install/) and run the following command on the main directory of this project:
docker-compose up
Once the services are up and running, the following services should be available:
- Prometheus: http://localhost:9090/
- Grafana dashboard: http://localhost:3000/login
- Web application: http://localhost:5000/
- Web application metrics: http://localhost:5000/metrics
- cAdvisor: http://localhost:8080/
Grafana is available on http://localhost:3000/login. The credentials are:
- Username: admin
- Password: admin
You can find the following dashboards already configured:
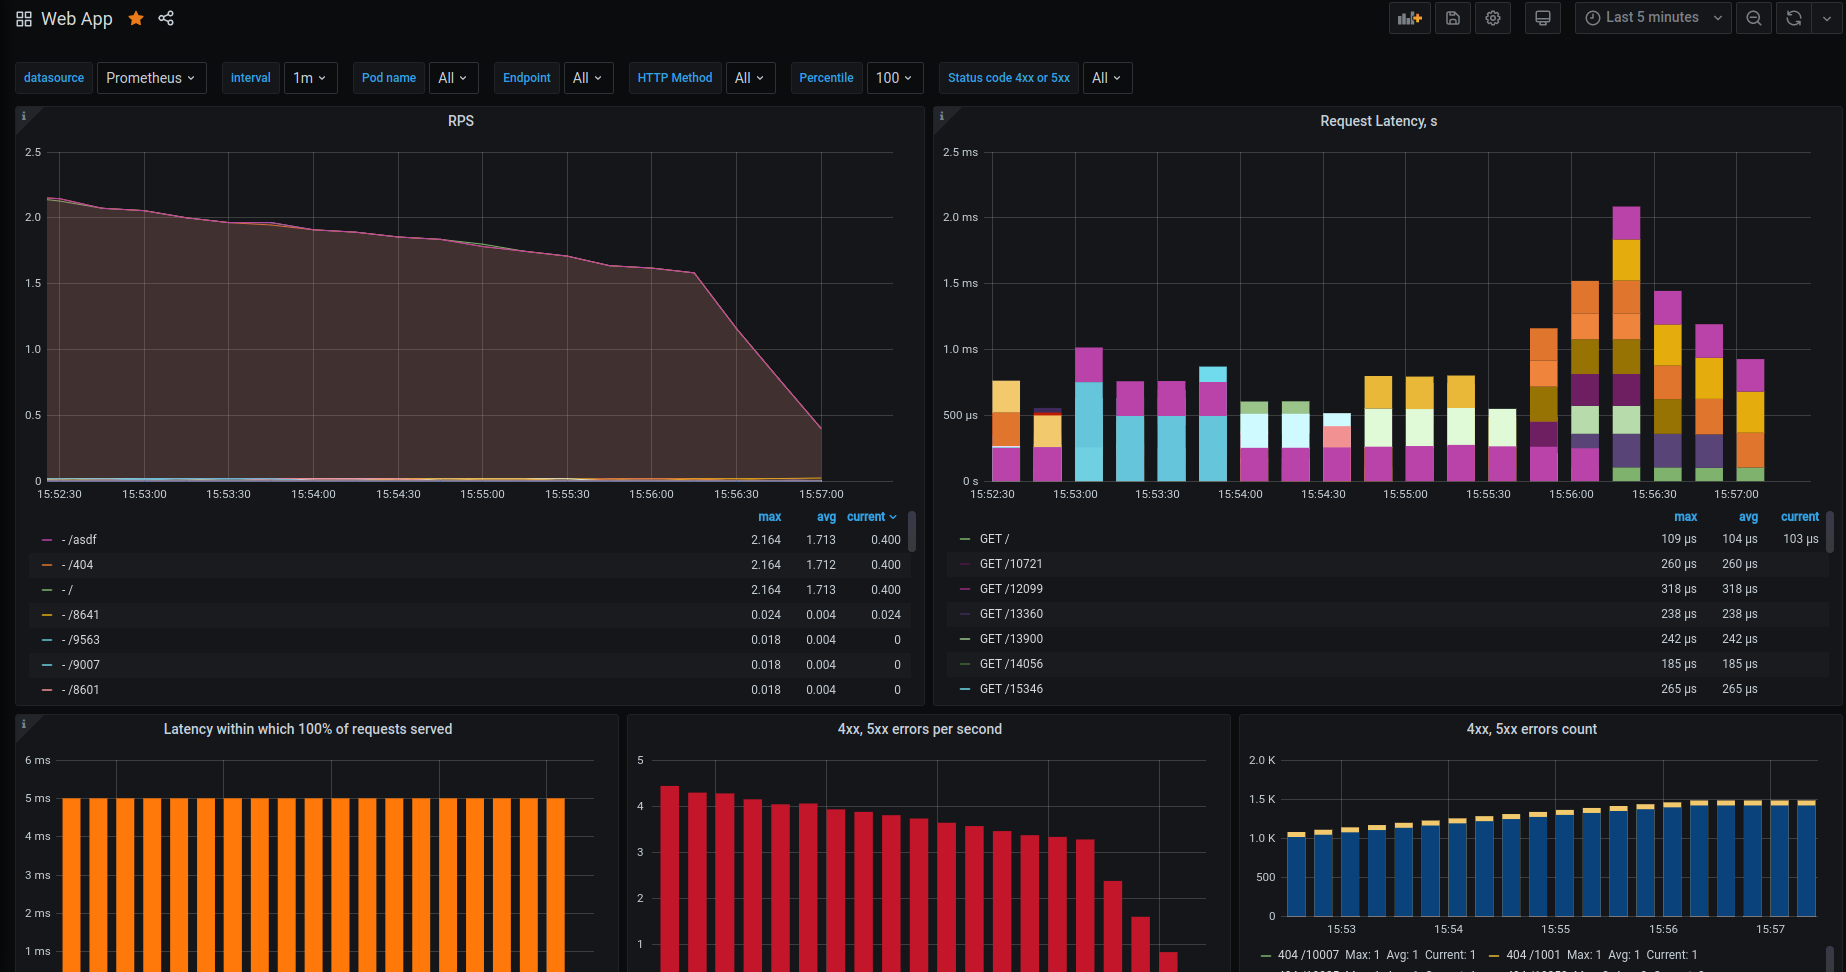
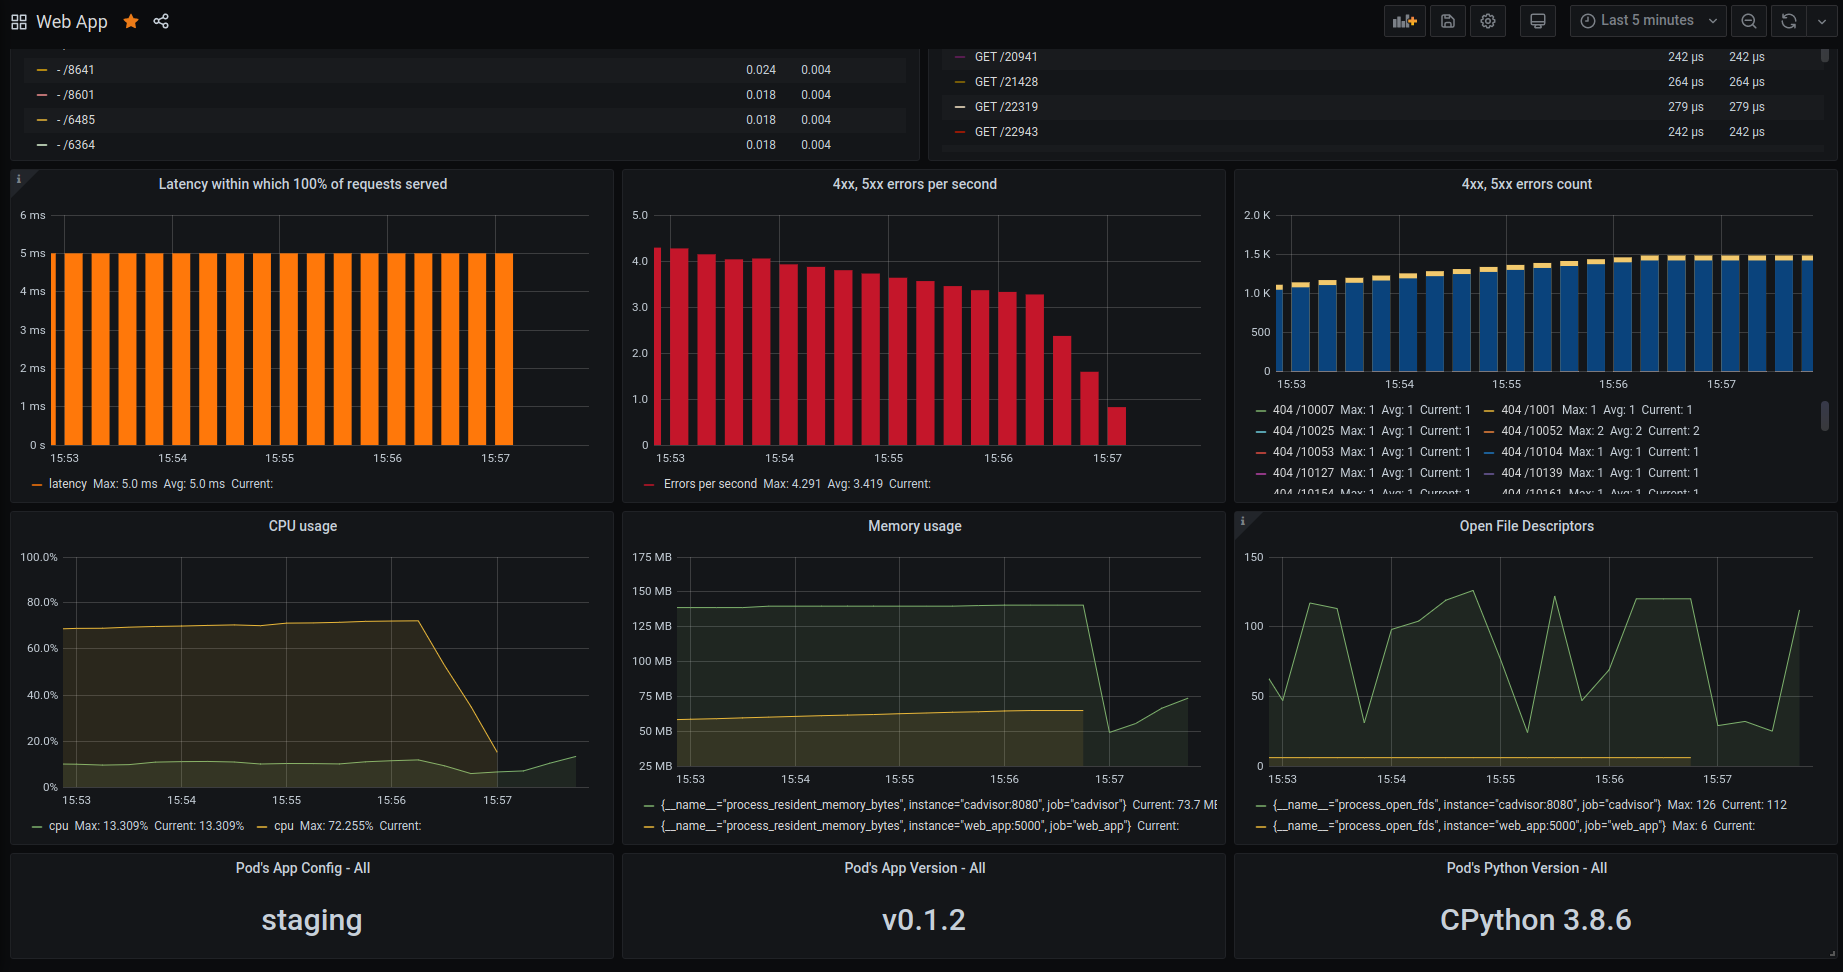
- Web App: it shows metrics from the web application. http://localhost:3000/d/u_DVKhQiz/web-app?orgId=1&refresh=5s
- Docker containers: metrics of all the running containers:
- cadvisor
- grafana
- prometheus
- web_app http://localhost:3000/d/KiNZkr-Gz/docker-containers?orgId=1&refresh=10s
It's a simple web application written in python3, using flask.
The metrics are exported using flask_prometheus_metrics.
In order to generate metrics to visualize interesting data on prometheus/grafana, you can execute this simple loop in bash:
while true; do curl localhost:5000/$RANDOM; curl localhost:5000/; curl localhost:5000/metrics; curl localhost:5000/404; curl localhost:5000/asdf; sleep 0.01; done
