Setup
make
Execute
./susy_qpi
Configure
Integration
Change minpts, maxpts, abserr, and relerr in susy_qpi.f90
Data
Change t, mu, x0, epsf, V, Uc, Uf, and omega in susy_qpi.f90
make
./susy_qpi
Output
susy_qpi.log keeps a log of configuration and errors
watch the log during execution with this command
tail -f susy_qpi.log
data/YYYYMMDDHHMM.dat has the experimental data in the format
| qx | qy | g(qx,qy,w) |
|---|
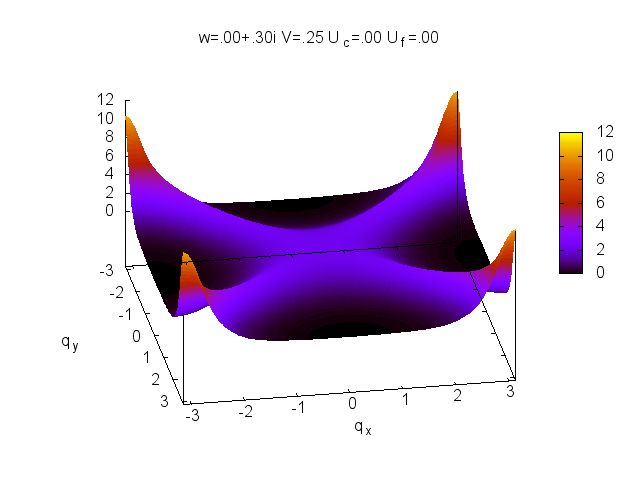
Plots can be found in 2d/YYYYMMDDHHMM.png and 3d/YYYYMMDDHHMM.png
There is also a SQLite3 database that records the parameters of each run at data.db
Viewer
If ruby on rails installed on the system, you can run a server to view the plots
cd viewer
rails s
It may be required to install the required packages to run rails
bundle install
