Learn Python for Data Analysis
Why Python: Number 1 language according to TIOBE index
Download Python: https://www.python.org/
Agenda of Python 101:
| Chapter | resources | |
|---|---|---|
| Datatypes | 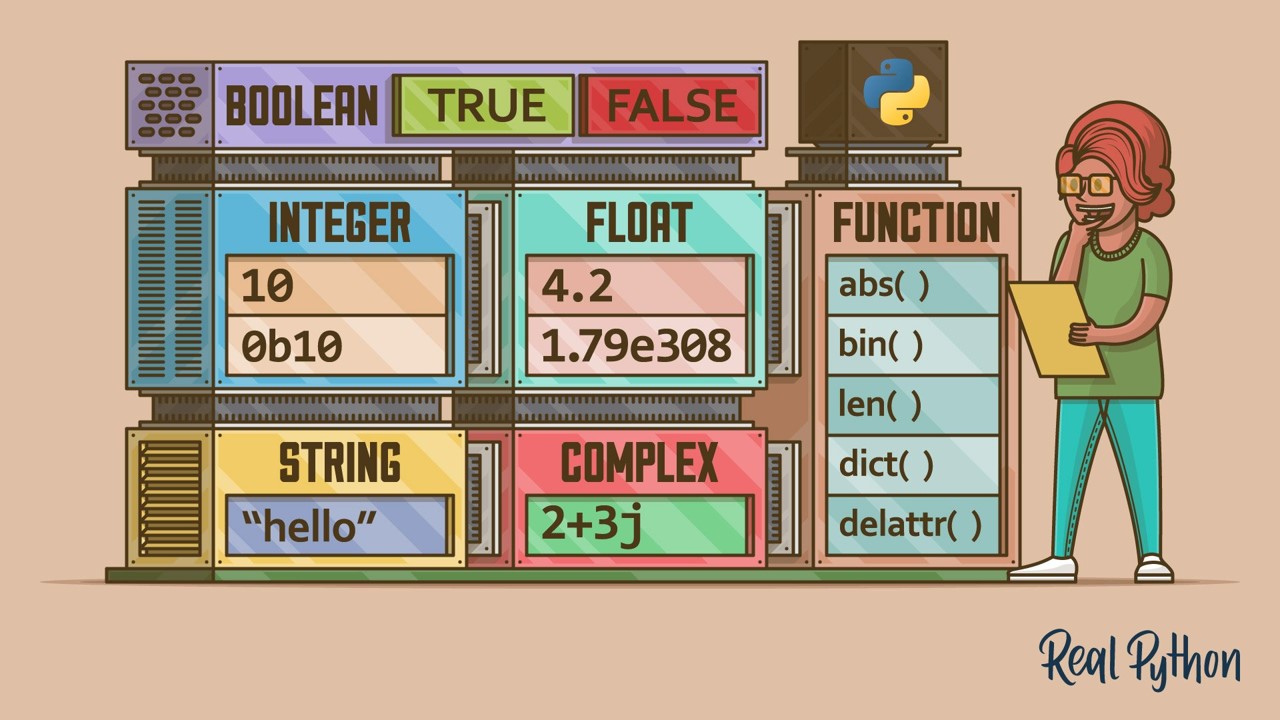 |
https://realpython.com/python-data-types/ |
| Loops & Conditions | 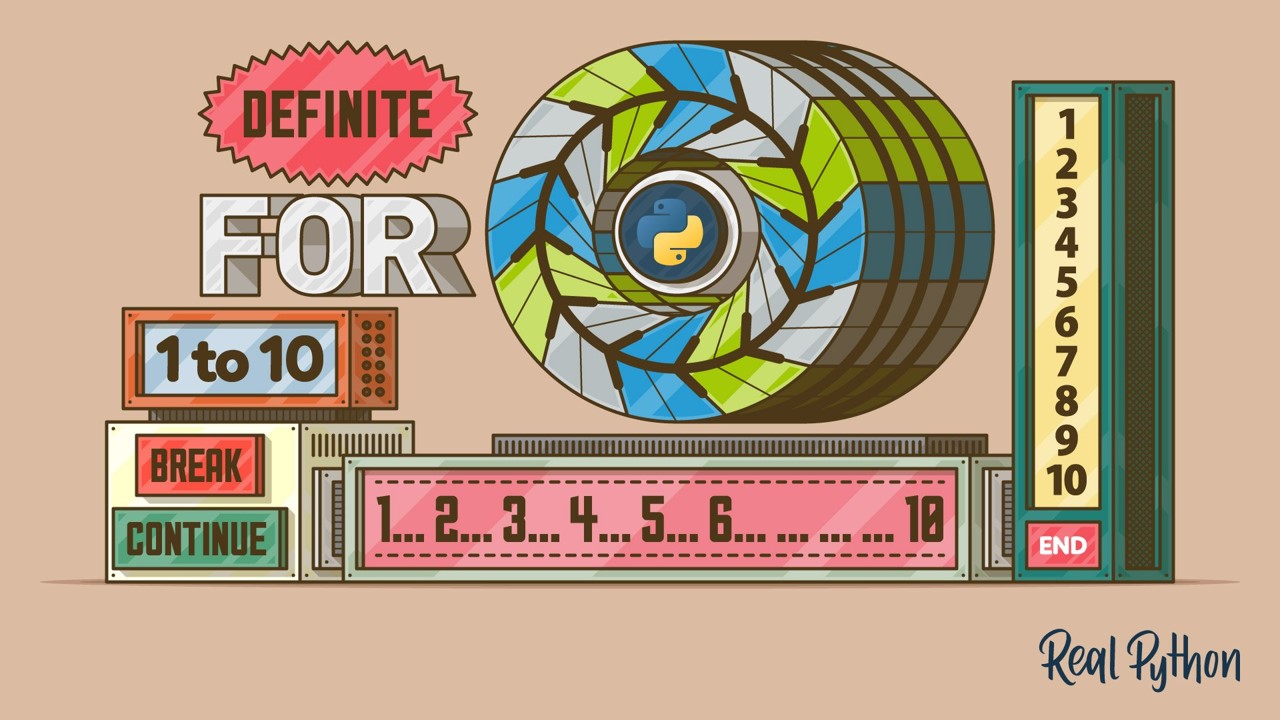 |
https://realpython.com/python-for-loop/ |
| Functions |  |
https://realpython.com/defining-your-own-python-function/ |
| Modules |  |
https://realpython.com/python-modules-packages/ |
| VScode | 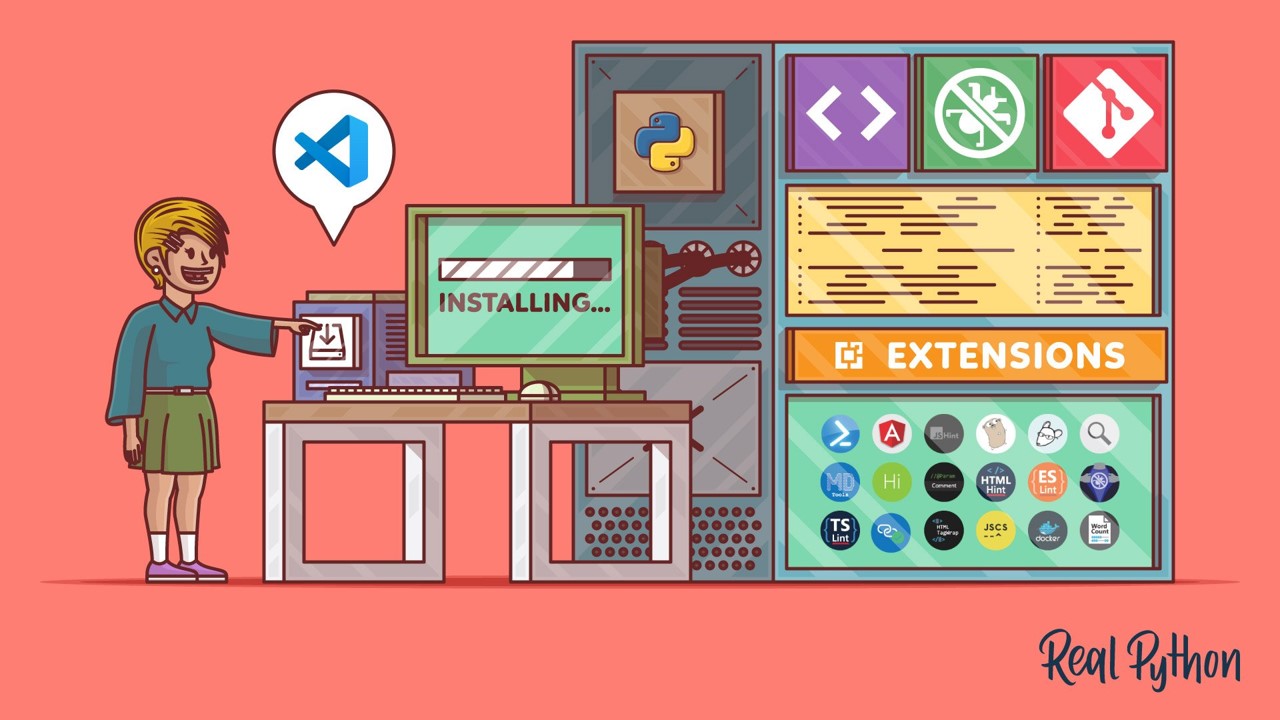 |
https://realpython.com/python-development-visual-studio-code/ |
| Files management | 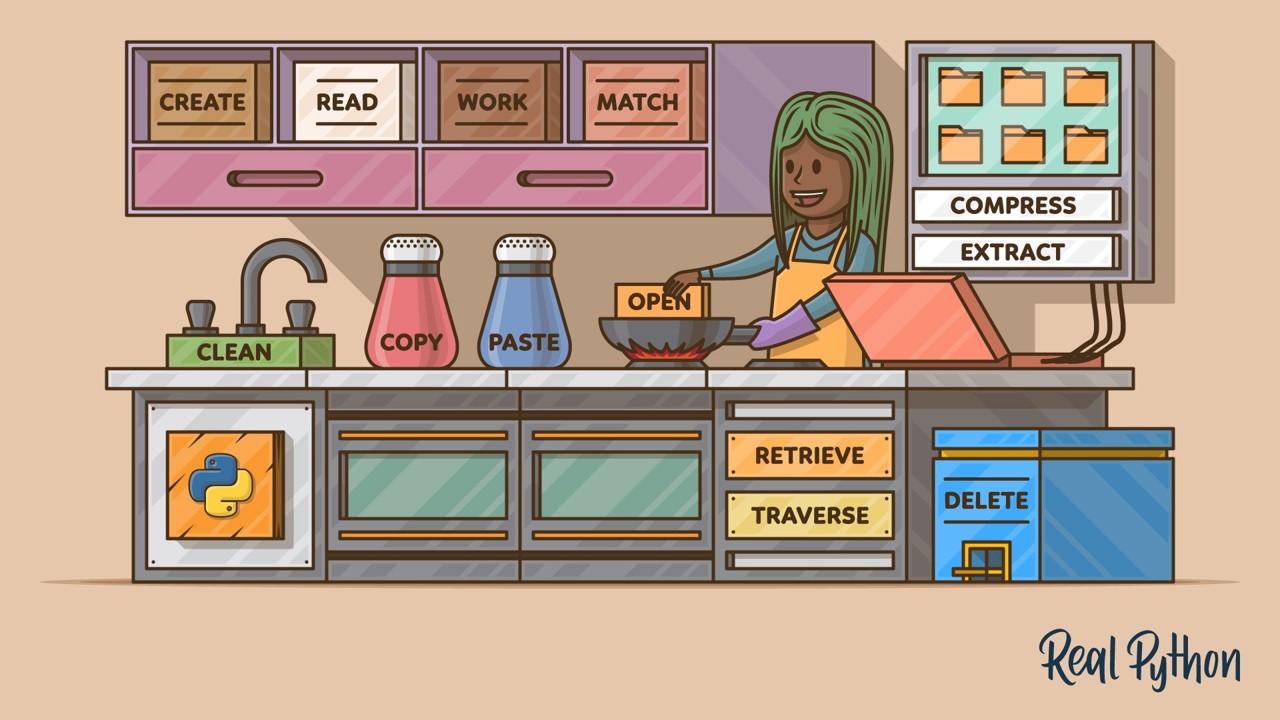 |
https://realpython.com/working-with-files-in-python/ |
Hands on + exercise!!!
Open Terminal, and run python:
>>> print("Hello World")Going further with Machine Learning:
Install via PIP (package manager for Python): $ pip install streamlit
Or if you cannot find pip:
$ python3 -m pip install streamlit
Develop your first app.py:
import streamlit as st
import pandas as pd

st.write("# My Dashboard")

df = pd.read_excel('data/data.xlsx')

st.sidebar.write("## Data from Excel")
st.sidebar.write(df)

st.bar_chart(df)
Read more: https://streamlit.io/
Deploy with Streamlit Cloud
Learn the basics about source control with Git:
More resources:

