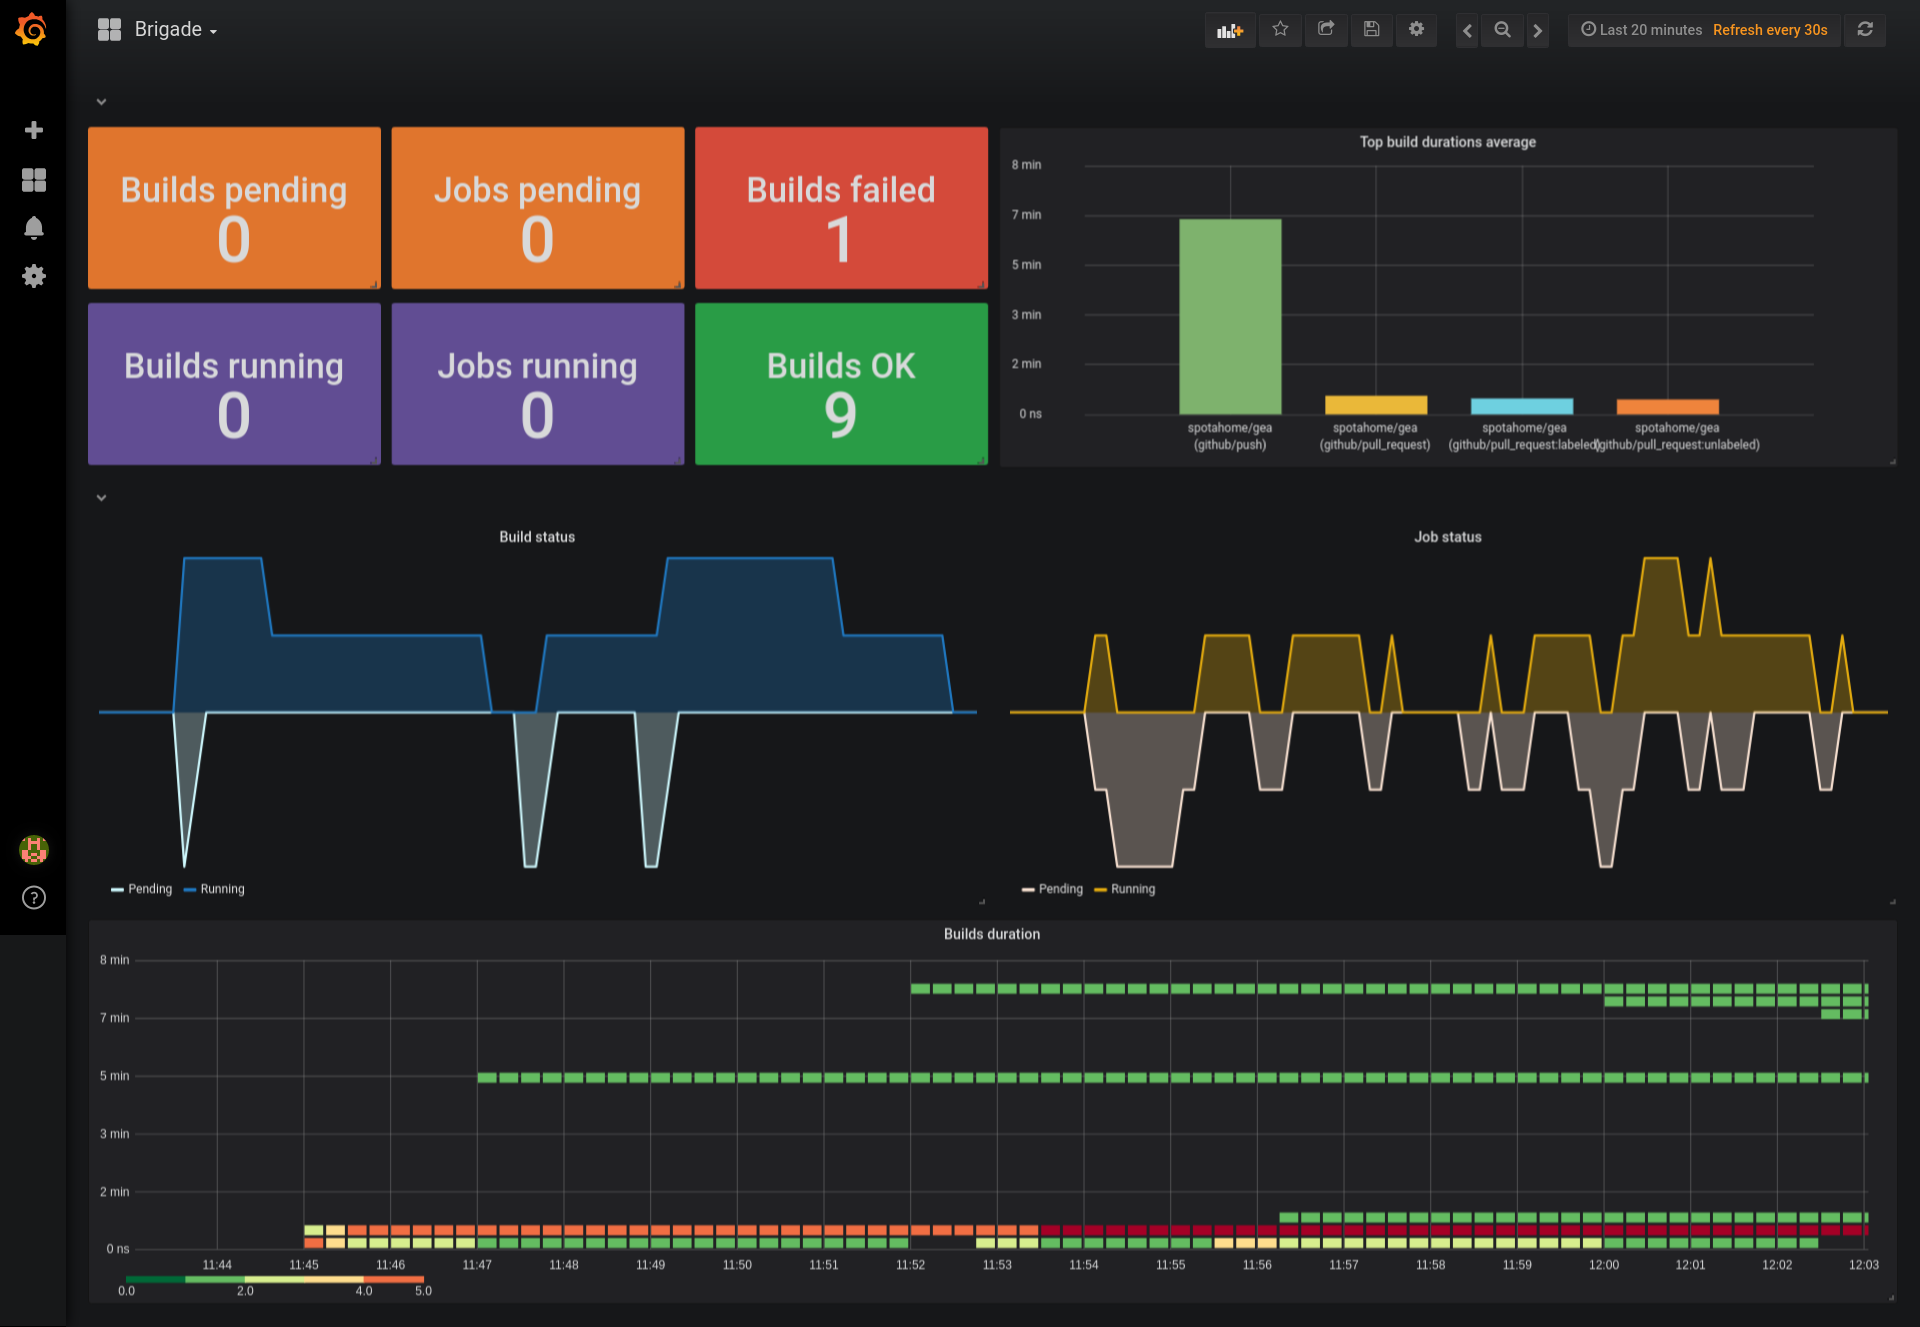
brigade-exporter is a Prometheus metrics exporter for Brigade.
This exporter is designed to be run along with a brigade installation, if you have multiple brigades you will have multiple brigade-exporters, one per brigade installation. This follows the philosophy of prometheus exporters of one exporter per app instance.
There is already a docker image ready to run the exporter in quay.io/slok/brigade-exporter. It has different options to run.
If you want to test the exporter outside the cluster in a brigade installation, you can use --development flag. You will need kubectl configuration and the context set pointing to the desired cluster.
docker run --rm \
    -p 9480:9480 \
    -v ${HOME}/.kube:/root/.kube:ro \
    quay.io/slok/brigade-exporter:latest \
    --debug \
    --development \
    --namespace ${MY_BRIGADE_NAMESPACE}
go to http://127.0.0.1:9480/metrics
- Brigade dashboard: A grafana dashboard for brigade.
TODO
TODO
| Metric | Type | Meaning | Labels |
|---|---|---|---|
| brigade_exporter_collector_success | gauge | Whether a collector succeeded | collector |
| brigade_exporter_collector_duration_seconds | gauge | Collector time duration in seconds | collector |
| Metric | Type | Meaning | Labels |
|---|---|---|---|
| brigade_project_info | gauge | Brigade project information | id, name, namespace, repository, worker |
| Metric | Type | Meaning | Labels |
|---|---|---|---|
| brigade_build_info | gauge | Brigade build information | id, project_id, event_type, provider, version |
| brigade_build_status | gauge | Brigade build status | id, status |
| brigade_build_duration_seconds | gauge | Brigade build duration in seconds | id |
| Metric | Type | Meaning | Labels |
|---|---|---|---|
| brigade_job_info | gauge | Brigade job information | id, build_id, image, name |
| brigade_job_status | gauge | Brigade job status | id, status |
| brigade_job_duration_seconds | gauge | Brigade job duration in seconds | id |
| brigade_job_create_time_seconds | gauge | Brigade job creation time in unix timestamp | id |
| brigade_job_start_time_seconds | gauge | Brigade job start time in unix timestamp | id |
You can disable metrics using flags.
--disable-project-collector: Disables all the metrics of projects.--disable-build-collector: Disables all the metircs of builds.--disable-job-collector: Disables all the jobs metrics. If you have lots of jobs, this could improve the gathering and storage of metrics.
You can build your own brigade-exporter from source using:
make build-binaryto build the binary or
make build-imageto build the image.
If you are developing, the exporter can fake a brigade installation and return fake data using --fake flag.
If you want to run a local exporter+prometheus stack run.
make stackAnd you will have a prometheus on http://127.0.0.1:9090 that will scrape a faked brigade-exporter.
% of running builds per provider.
sum(
    brigade_build_status{status="Running"} * on(id) group_right brigade_build_info
) by (provider)
/ on() group_left
sum(
    brigade_build_status{status="Running"})
* 100
Get the jobs and their states of a build
brigade_job_info{build_id="build-xxxx"}
*on(id) group_right brigade_job_status
Get how long the jobs have been in pending state before started to run.
(brigade_job_start_time_seconds > 0) - (brigade_job_create_time_seconds > 0)
Get the top 10 project builds duration by event and provider (in the last 30m)
topk(10,
  avg(
    max_over_time(brigade_build_duration_seconds[30m])
      * on(id) group_right brigade_build_info
    * on(project_id) group_left(name)
      label_replace(brigade_project_info , "project_id", "$1", "id", "(.*)")
  ) by(name, provider, event_type))
Average job duration seconds per project Note This is an extreme example of how you owuld scalate IDs in metrics. This is not recommended.
avg(
label_replace(
    label_replace(
      avg(
        (brigade_job_duration_seconds > 0) * on(id) group_right brigade_job_info
      ) by (build_id)
    , "id", "$1", "build_id", "(.*)")
    * on(id) group_right brigade_build_info
, "id", "$1", "project_id", "(.*)")
) by (id)
* on(id) group_right brigade_project_info
