The objective of this challenge is to develop an Analytical Dashboard where the owner/user will understand the growth/potential of the business in the market.
Analytical Dashboard which is generated from US Superstore data contains the following statistics.
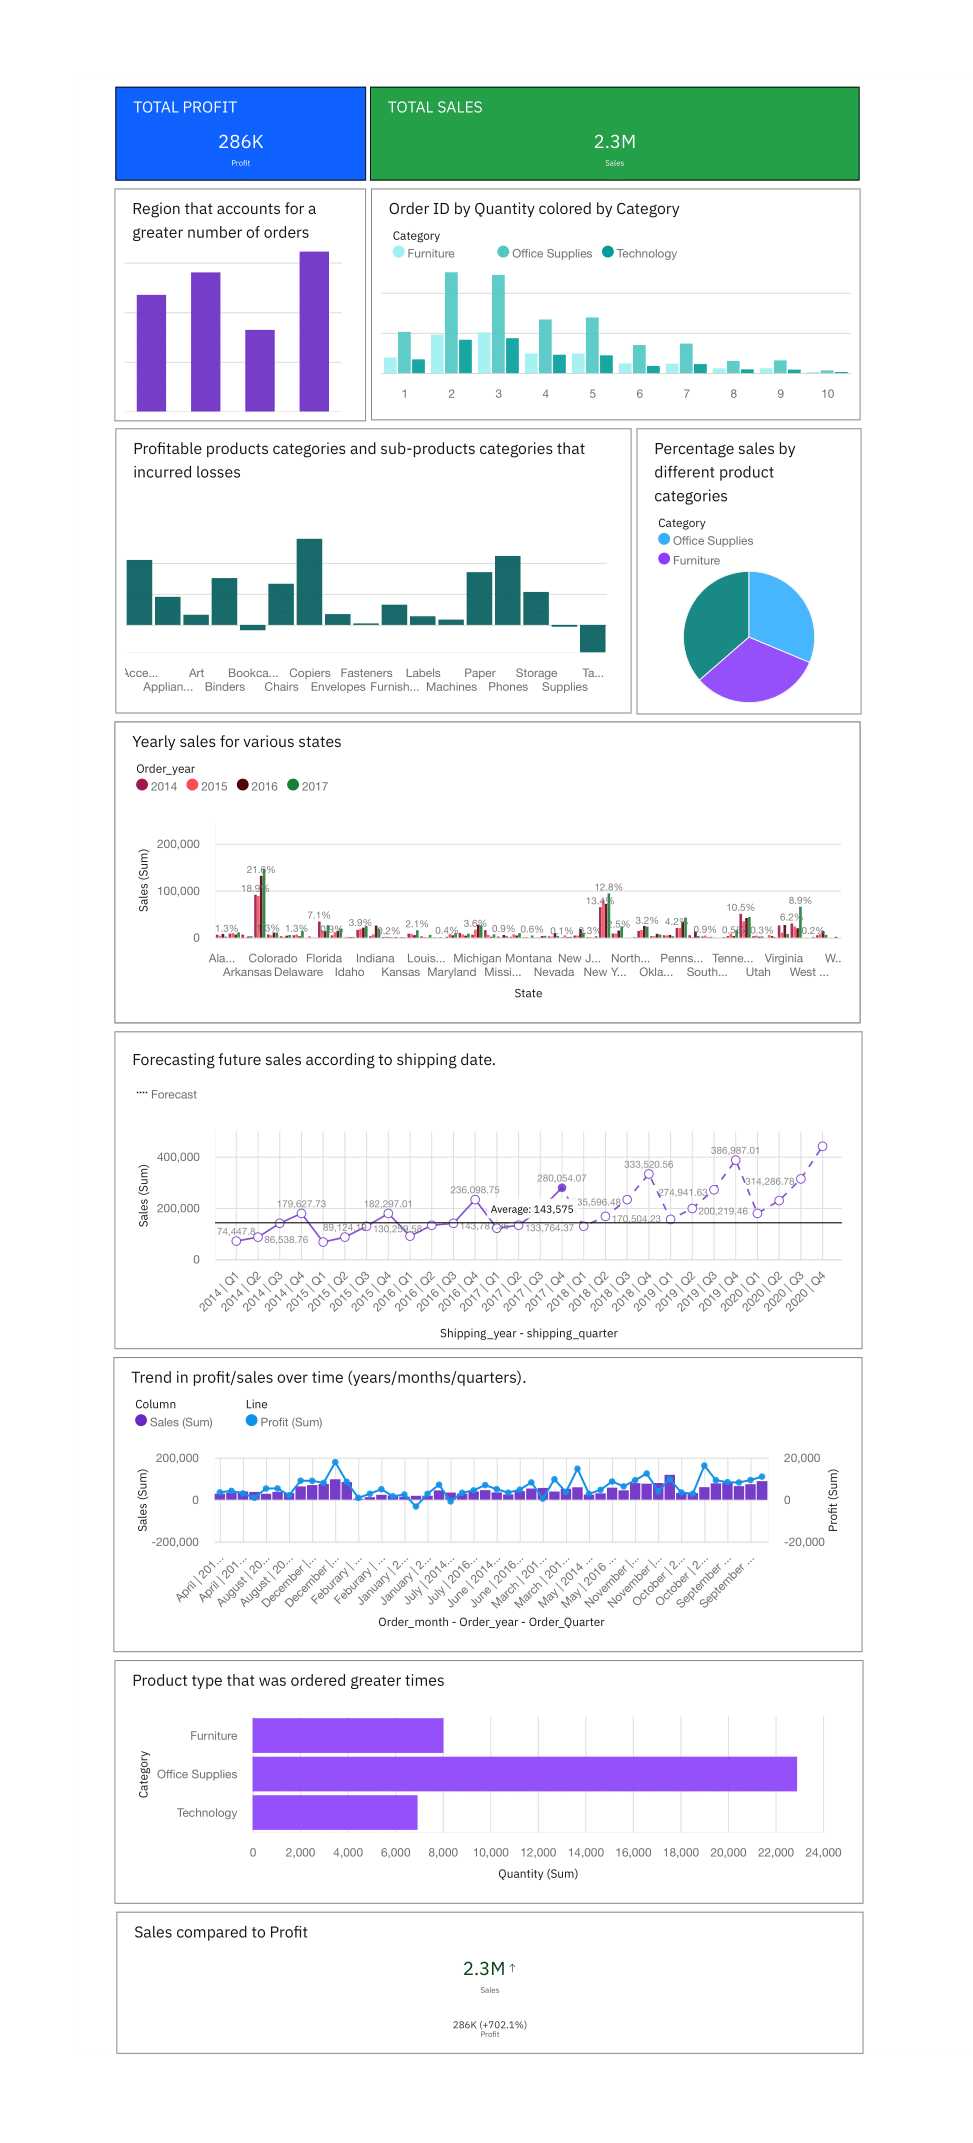
- A region that accounts for a greater number of orders
- Frequency distribution of quantity ordered
- Percentage sales by different product categories
- Profitable products or their sub-products in the last few years
- products that incurred losses
- Product type that was ordered greater times
- Yearly sales for various states
- Forecasting future sales according to shipping date.
- The trend in profit/sales over time (years/months/quarters).


Link to IBM Cognos Analytics Dashboard
Link to Dashboard pdf