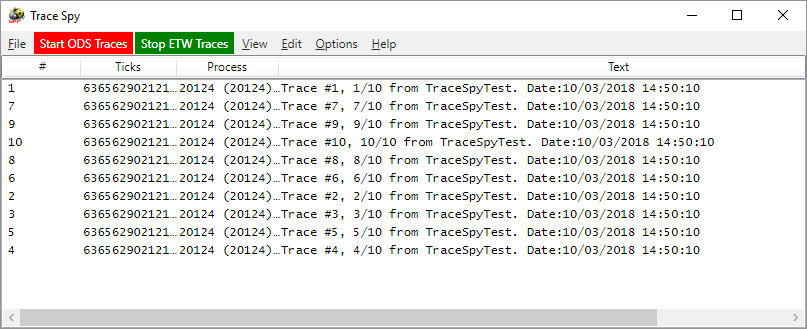
TraceSpy is a pure .NET, 100% free and open source, alternative to the very popular SysInternals' DebugView tool.
Note TraceSpy will not evolve, instead, use WpfTraceSpy (see below).
Update 2020/12/28 : WPFTraceSpy now has Regex colorizers.
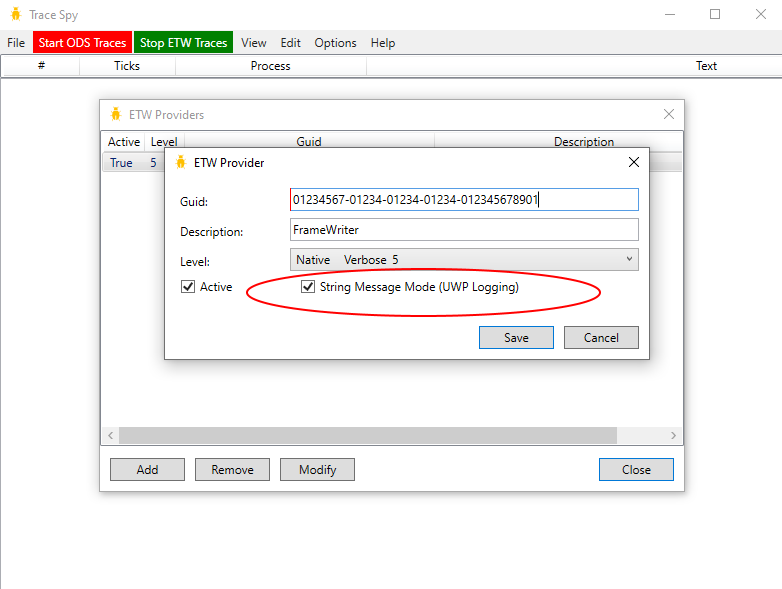
Update 2019/08/16 : WPFTraceSpy now can log UWP (Universal Windows Application) LoggingChannel messages.
Update 2018/03/10 : we have just released the first version of a WPF version "WPFTraceSpy" that's much faster than the original Winforms one when tracing millions of trace events. More info at the end of this page.
Notables points of interest are:
- It's 100% .NET
- It does not need UAC to be disabled nor special rights (unless you want to use ETW traces, see below)
- It can remove empty lines (which is very handy to get rid of these pesky trace lines sent by Visual Studio or addins, for example...)
- The traced application is far less blocked by this tracing tool than by DebugView, because it's more async
- The Copy (CTRL-C) operation just copies the traced text, and not the full line (a full line copy using CTRL-L feature is there though)
- The process name of the traced application is optionally displayed instead of the process id (if available and not dead at display time)
- The find dialog has an autocomplete feature
- Lines that contain newline characters (\r, \n) are not displayed as normal lines (DbgView does this) but as one big line
- There is a super duper cool colorizer feature that allows traces colorization using regular expressions.
WpfTraceSpy also supports simple ETW (Event Tracing for Windows) real time "message" traces. These traces can be easily created from a client point of view like this:
Guid providerGuid1 = new Guid("01234567-01234-01234-01234-012345678901"); // change this guid, make it yours!
using (EventProvider prov = new EventProvider(providerGuid1))
{
  prov.WriteMessageEvent("hello", 0, 0);
}
These traces are very fast to create, and cost almost nothing to the system. In fact you you should get rid of OutputDebugString (this is also the default trace listener on .NET under Windows) usage, as this is a thing of the past, and use ETW, which is much better and faster.
The EventProvider class - created initially with .NET Framework 4 and higher - is located in the System.Diagnostics.Eventing namespace. The good news is these traces are super fast, and they can even be left in production code. ETW is in fact what Microsoft uses for all Windows code.
For .NET Core (any version), I've put an EventProvider implementation here https://github.com/smourier/TraceSpy/tree/master/netcore
If you want to use ETW from other platforms than .NET, it's possible (as long as you run on the Windows OS), I've provided some VBA interop code with an Excel sample here: VBA ETW real time traces sample
What's cool is you can now specialize WpfTraceSpy for a given set of traces. Just uncheck the "Capture OutputDebugString events", define some ETW provider to capture, and you will now only get traces that you need!
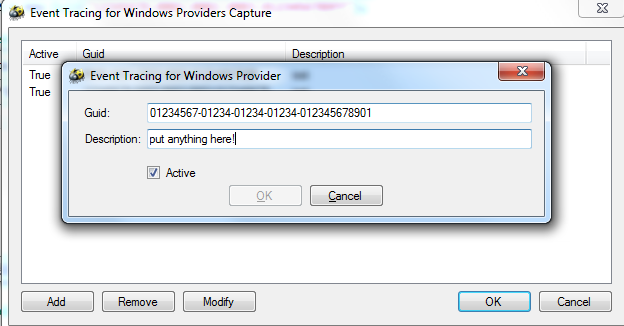
From the WpfTraceSpy UI, you just need to configure the provider Guid, in the Options menu, like this:
And add the provider Guid and an optional description which can be added to traces:
One last note: for some of ETW traces to be read, WpfTraceSpy must be started as Administrator (run under full UAC token).
ETW support also added the following features:
- Quick Colorizers feature (only for the old TraceSpy, not available with WpfTraceSpy).
- RecordView feature (double click on a trace).
- Support for ETW trace levels (the 2nd parameter in the WriteMessageEvent call above)
- Support for TAB '\t ' character in trace texts.
Things that are missing I don't plan to add them since I never used them in DbgView in many years :-)
- Highlights
- Kernel capture
- Save & Log to file (it's easy to do with a copy / paste)
- Append comment
- Remote connect
This is a WPF version of TraceSpy. Wpf TraceSpy is much faster than the Winforms version. You can send a million traces to it and it will digest them without any pain (but it will take a while before the million traces will be visible).
Things that are in TraceSpy but not in WpfTraceSpy:
- File Open, File Save, File Save As are not there. I'm not sure it' so useful since we can copy all lines to the clipboard.
- Quick Colorizers are not part of WpfTraceSpy, but you have Regex Colorizers.
WpfTraceSpy (not TraceSpy) can also log traces from UWP (Universal Windows Applications) LoggingChannel classes. To emit a trace from your app, it's super simple:
// somewhere in your initialization code
private readonly static LoggingChannel _channel = new LoggingChannel("MyApp", new LoggingChannelOptions(), new Guid("01234567-01234-01234-01234-012345678901")); // change this guid, make it yours!

// everywhere in your code. add simple string traces
_channel.LogMessage("hello from UWP!");
Note you must configure the ETW provider specifically for that, like this:
And you should receive all UWP traces in WpfTraceSpy.
.NET Core logging is not super easy to configure (this is the least to say...), especially in ASP.NET Core code. So I have provided a support .cs file that enables you to use ETW simple text traces (on Windows platform only) very easily as a logging provider under .NET core. Of course, you will then be able to get those traces in TraceSpy and WpfTraceSpy!
The source is available here: .NET Core ETW Simple traces
Here is how you can integrate in your startup code:
    public void Configure(IApplicationBuilder app, IHostingEnvironment env, ILoggerFactory loggerFactory)
    {
        // Just add this line (with a using TraceSpy; on top of the file)
        // It will only works on Windows, but will fail gracefully w/o error on other OSes
        // The guid is an arbitrary value that you will have to configure in (Wpf)TraceSpy's ETW providers
        loggerFactory.AddEventProvider(new Guid("a3f87db5-0cba-4e4e-b712-439980e59870"));

        if (env.IsDevelopment())
        {
            app.UseDeveloperExceptionPage();
        }

        app.UseMvc();
    }
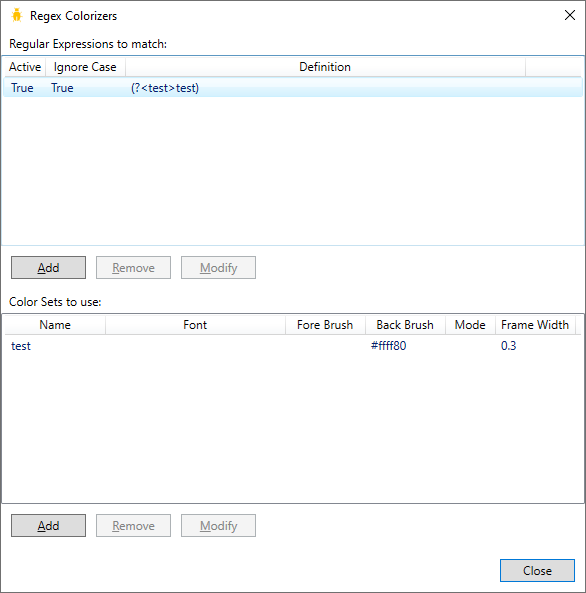
First you need to define a Regex with capture group name. For example, this: (?<test>test) will match the text "test" anywhere in a trace text and will assign this to the "test" capture group name. Check .NET regular expression for more on this.
Once you have defined a Regex, you must define a WpfTraceSpy's "Color Set" for each group name. The Color Set's name is the same as the group name. So the following setting:
Will color all occurrences of "test" with #FFFF80 (yellow) color surrounded by a frame width of 0.3 pixels.
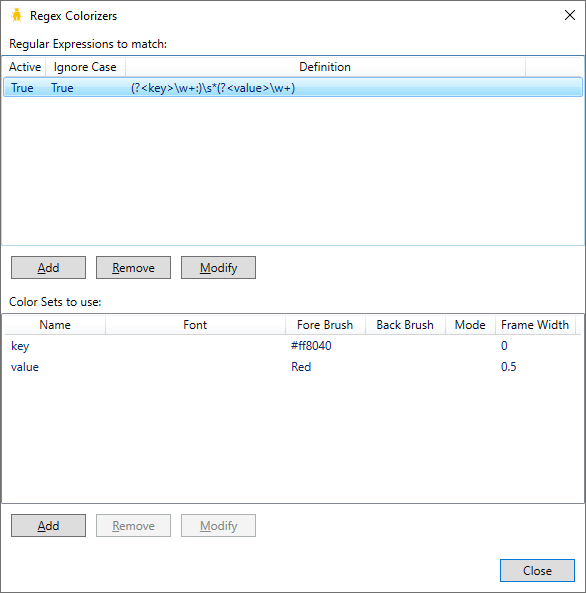
Here is another sample setting to colorize key value pairs:
And here is an output example in WpfTraceSpy:
Note: for colorized traces, the Wrap Text feature doesn't work, the trace is just truncated.
As explained in official documentation the OutputDebugStringW function internally converts the specified string based on the current system locale information and passes it to OutputDebugStringA to be displayed. As a result, some Unicode characters may not be displayed correctly.
In WpfTraceSpy version 4.1.0.6, support has been added to internally use a specified encoding to display these ODS traces. Because of what's been said above, it will generally only work for code-page/single-byte/ansi encodings (like old ISO-8859-1 encoding, etc).
But it can also work for Unicode support if:
- you use UTF-8 encoding when you call
OutputDebugStringA - you don't use
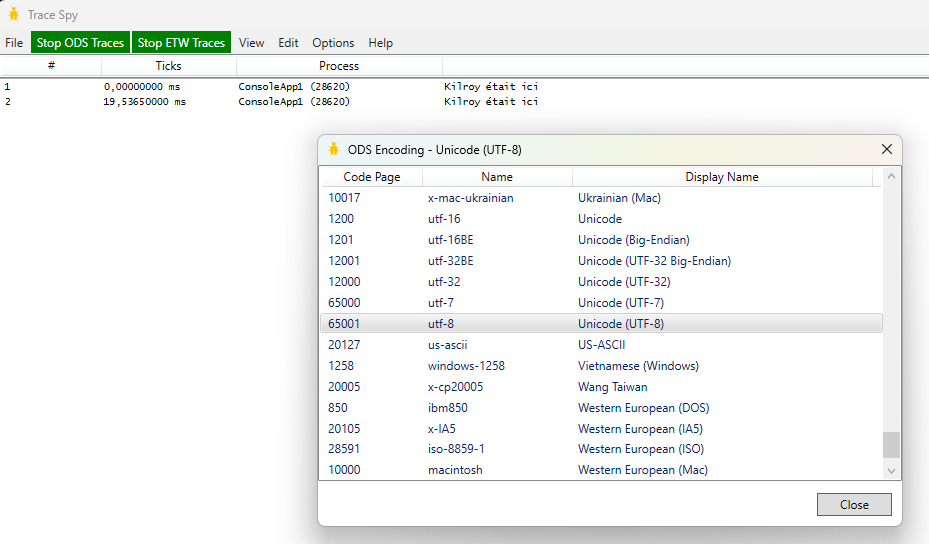
OutputDebugStringWat all - you configure WpfTraceSpy to use UTF-8 as the "ODS encoding", like shown here (menu "Options"/"ODS Encoding...", by default the encoding is the default ANSI encoding):
For .NET users, that means you cannot use Trace.WriteLine() to send these types of traces, instead you must declare a P/Invoke method and use it like this:
static void Main()
{
    var str = "Kilroy était ici";

    // one way of using it
    OutputDebugStringA(str);

    // another way of using it (if UnmanagedType.LPUTF8Str is not available)
    var bytes = Encoding.UTF8.GetBytes(str);
    OutputDebugStringA(bytes);
}

[DllImport("kernel32")]
private static extern void OutputDebugStringA(byte[] str);

[DllImport("kernel32")]
private static extern void OutputDebugStringA([MarshalAs(UnmanagedType.LPUTF8Str)] string str);
PS: in fact the code above will work if you use Trace.WriteLine and you have the ISO-8859-1 encoding because the text 'Kilroy était ici' is compatible with this code page but it won't work with complex unicode characters.

