Machine learning on graph data has become a common area of interest across academia and industry. However, due to the size of real-world industry graphs (hundreds of millions of vertices and billions of edges) and the special architecture of graph neural networks, it is still a challenge for practitioners and researchers to perform machine learning tasks on large-scale graph data. It typically takes a powerful and expensive GPU machine to train a graph neural network on a million-vertex scale graph, let alone doing deep learning on real enterprise graphs. In this tutorial, we will cover how to develop and run performant graph algorithms and graph neural network models with TigerGraph [3], a massively parallel platform for graph analytics, and its Machine Learning Workbench with PyTorch Geometric [4] and DGL [8] support. Using an NFT transaction dataset [6], we will first investigate transactions using graph algorithms by themselves as methods of graph traversing, clustering, classification, and determining similarities between data. Secondly, we will show how to use those graph-derived features such as PageRank and embeddings to empower traditional machine learning models. Finally, we will demonstrate how to train common graph neural networks with TigerGraph and how to implement novel graph neural network models. Participants will use the TigerGraph ML Workbench Cloud to perform graph feature engineering and train their machine learning algorithms during the session.
Many resources are already listed on this site, but for a complete listing, please visit the Linktree.
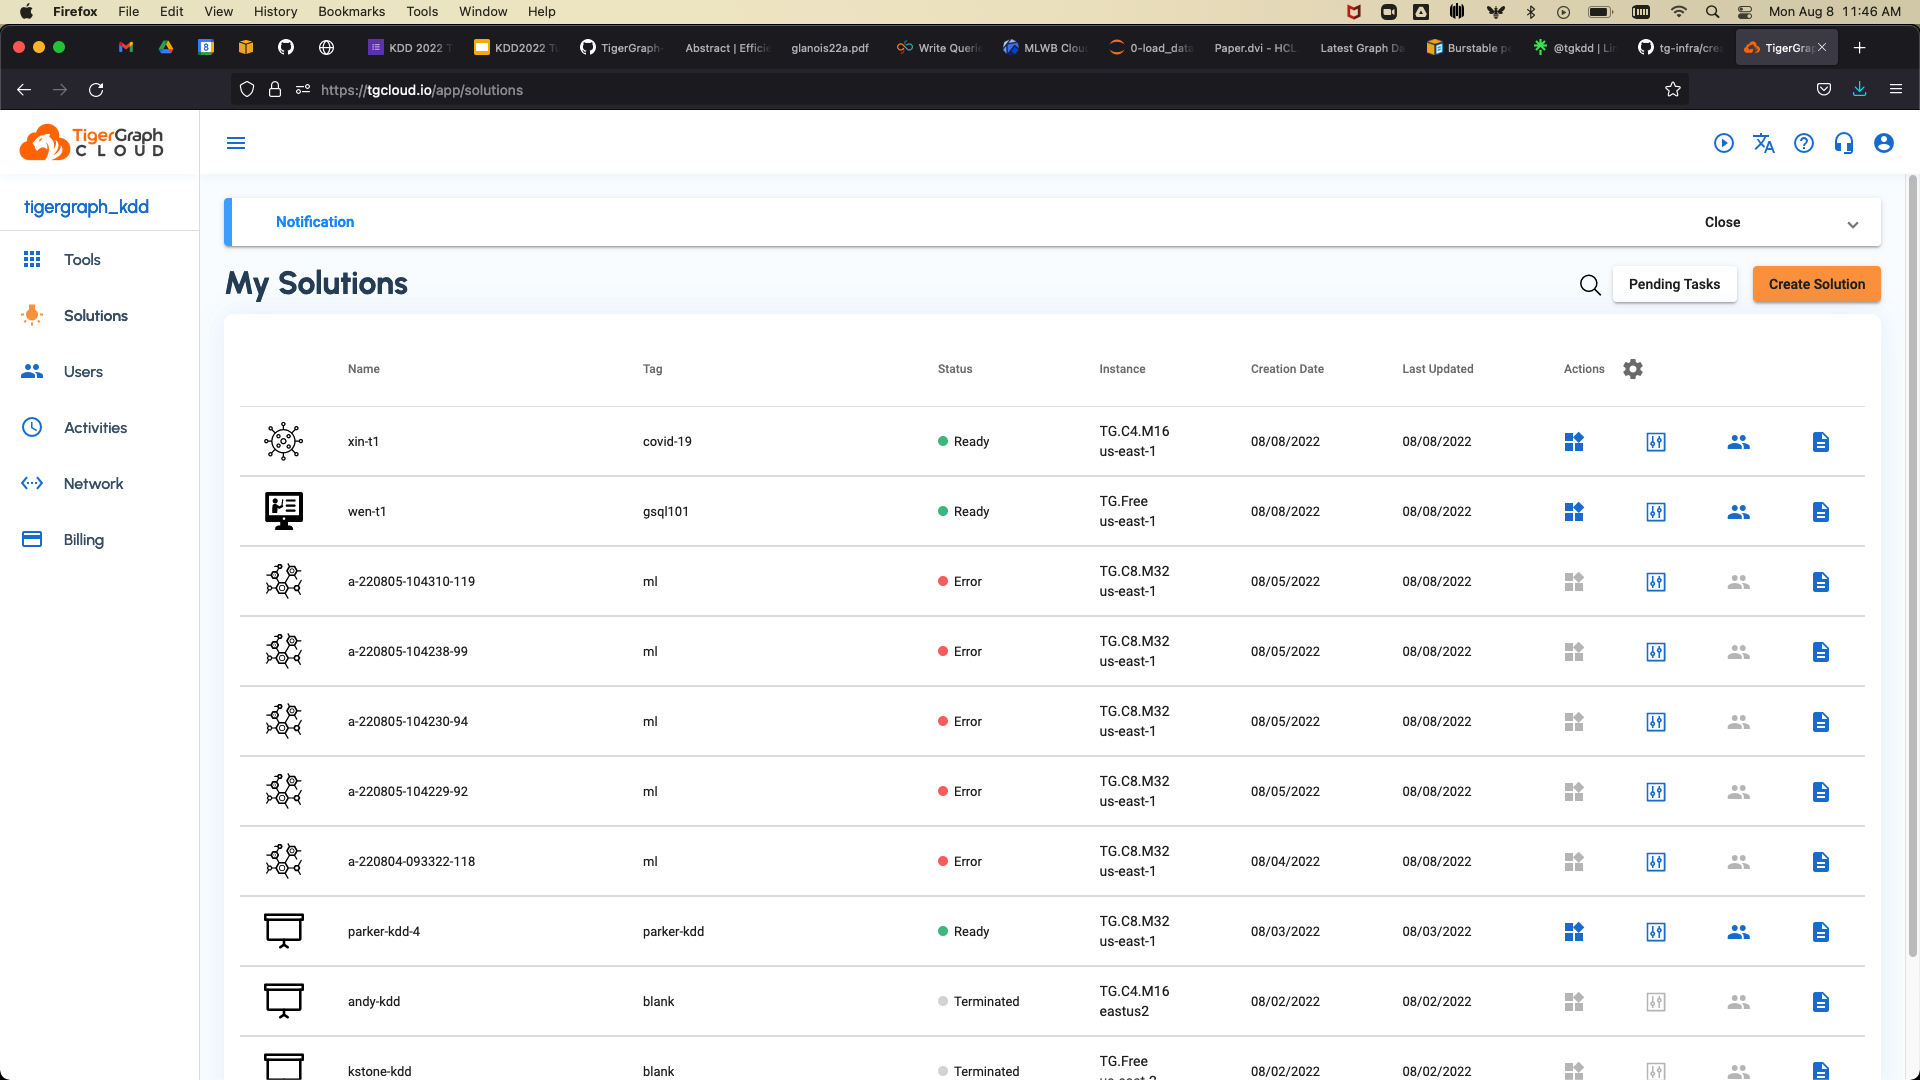
First, we will have to provision a TigerGraph Cloud instance. Once you follow the invite link in the email you recieve from the Google Form, you will see a page like the below:
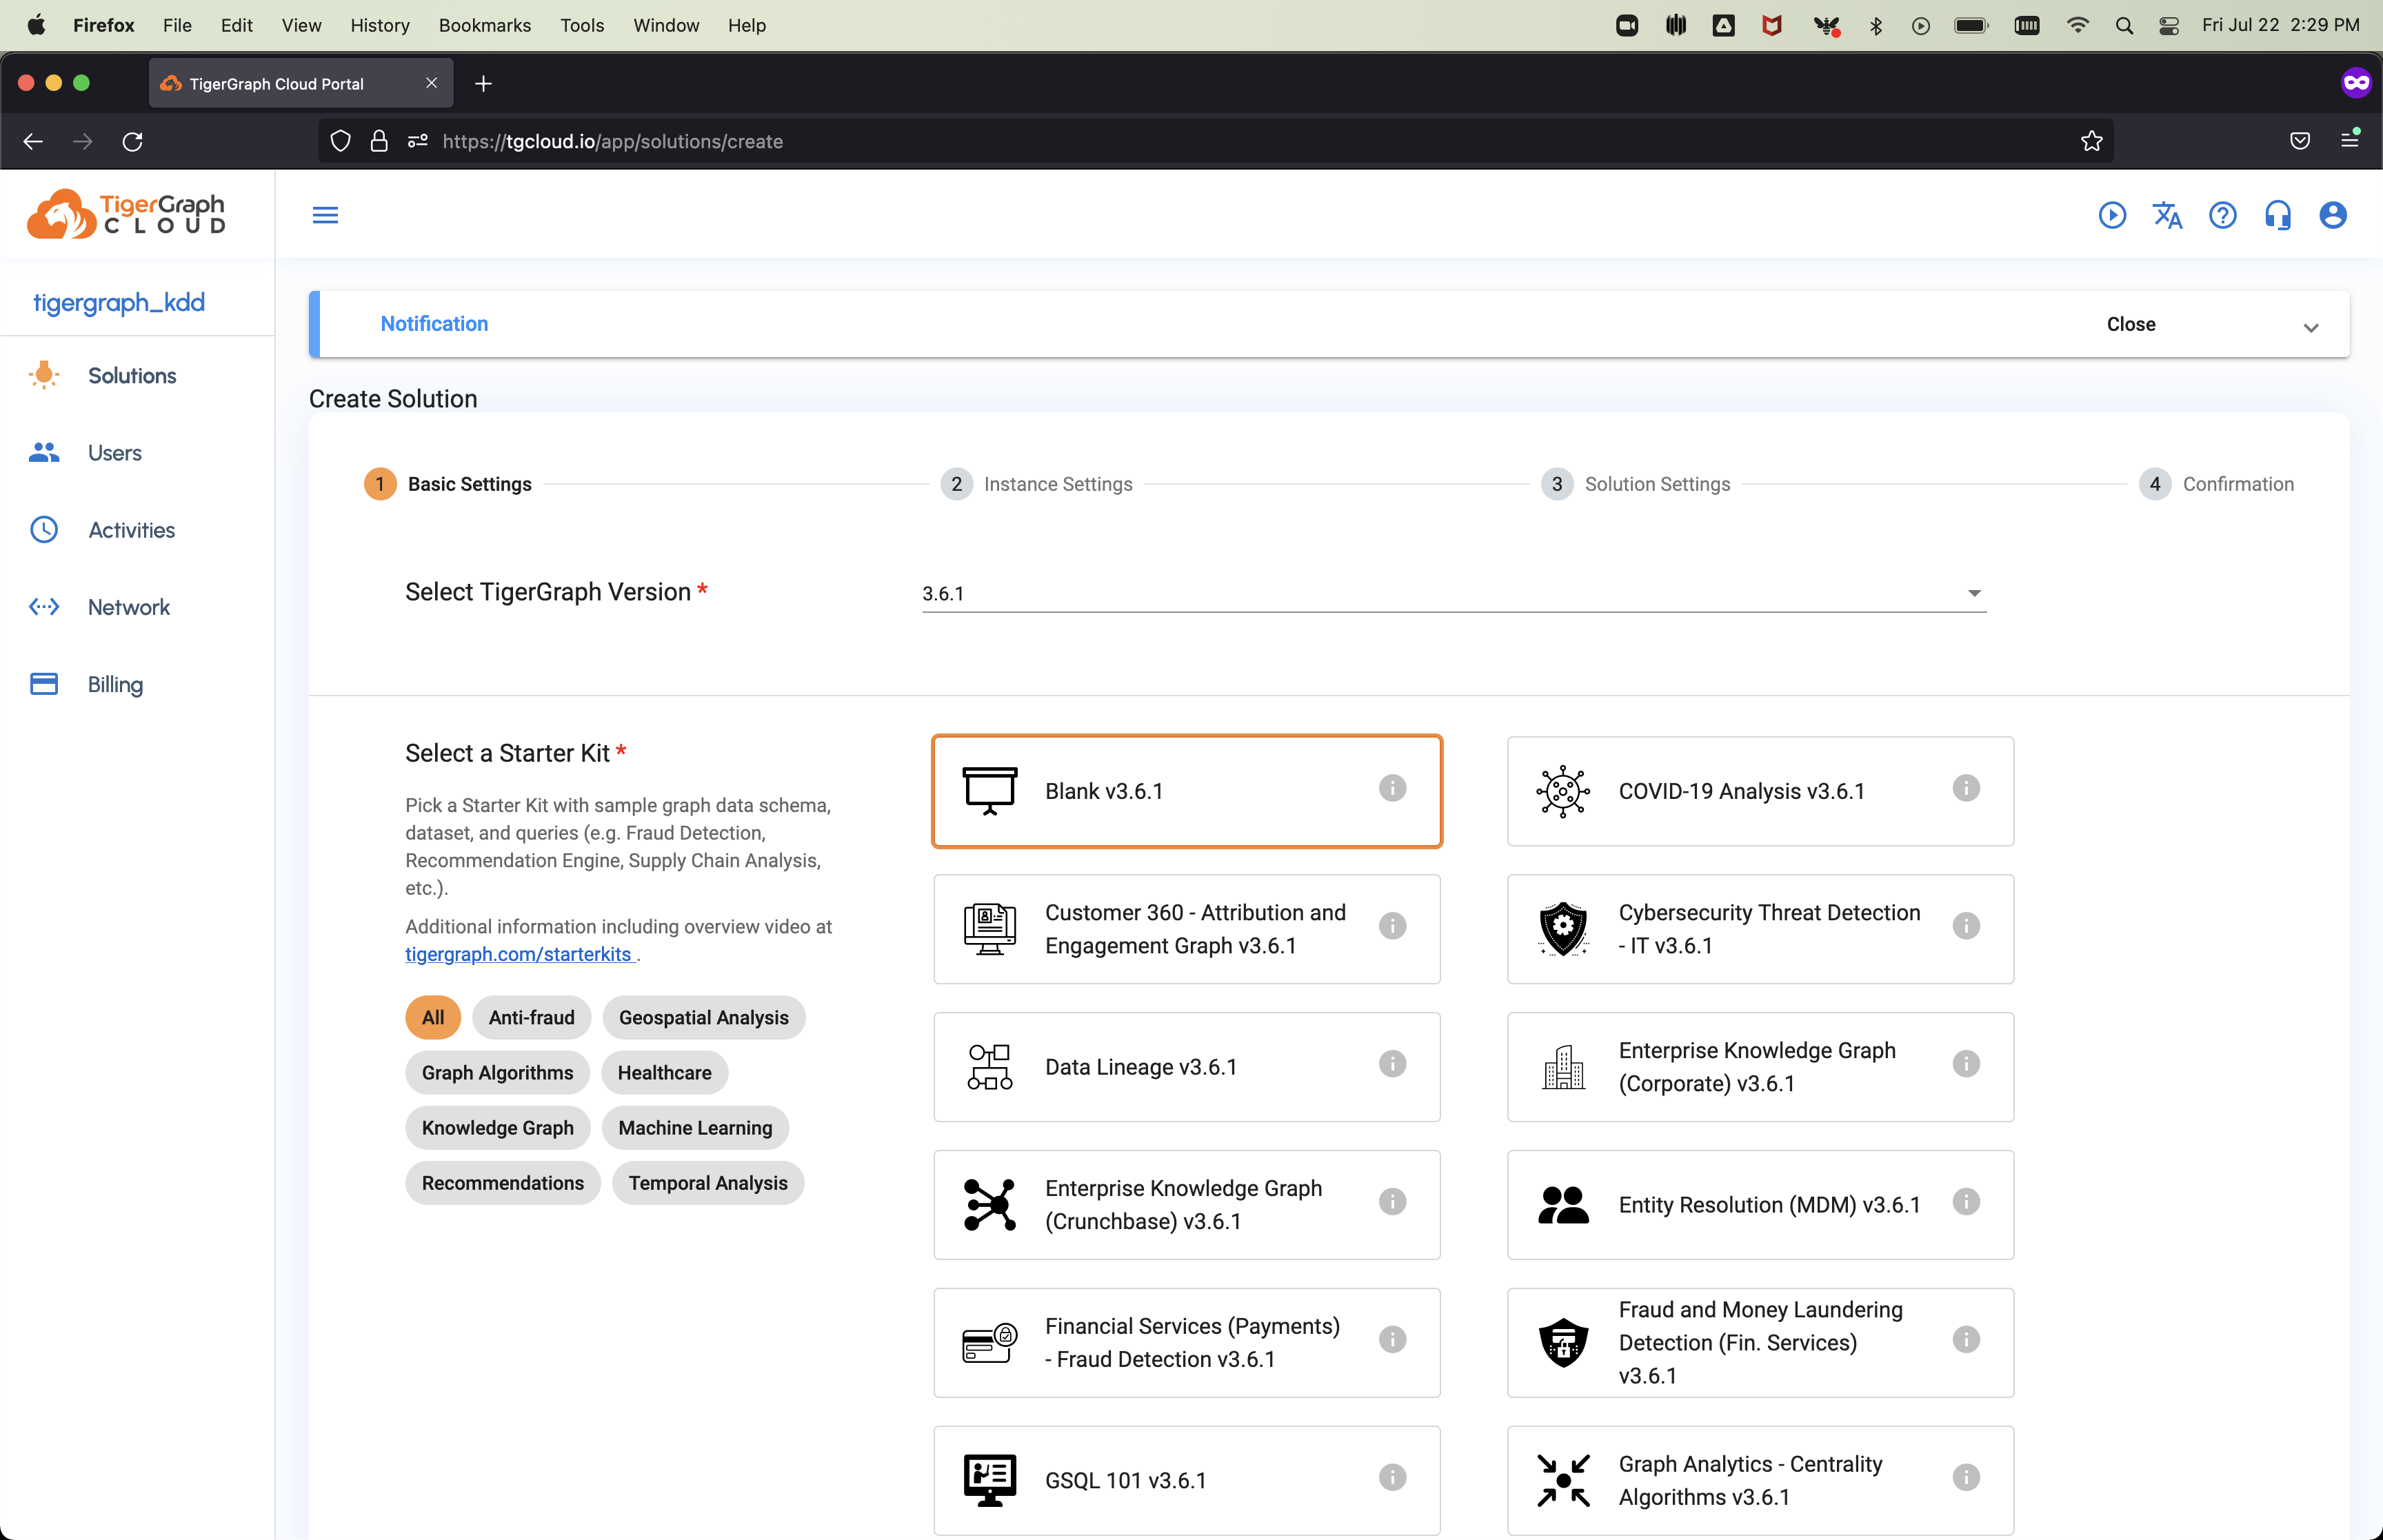
Click Create Solution in the upper right hand corner. You will then see:
Select Blank v3.6.1 and scroll to the bottom of the page to continue. This will then bring you to the instance configuration page.
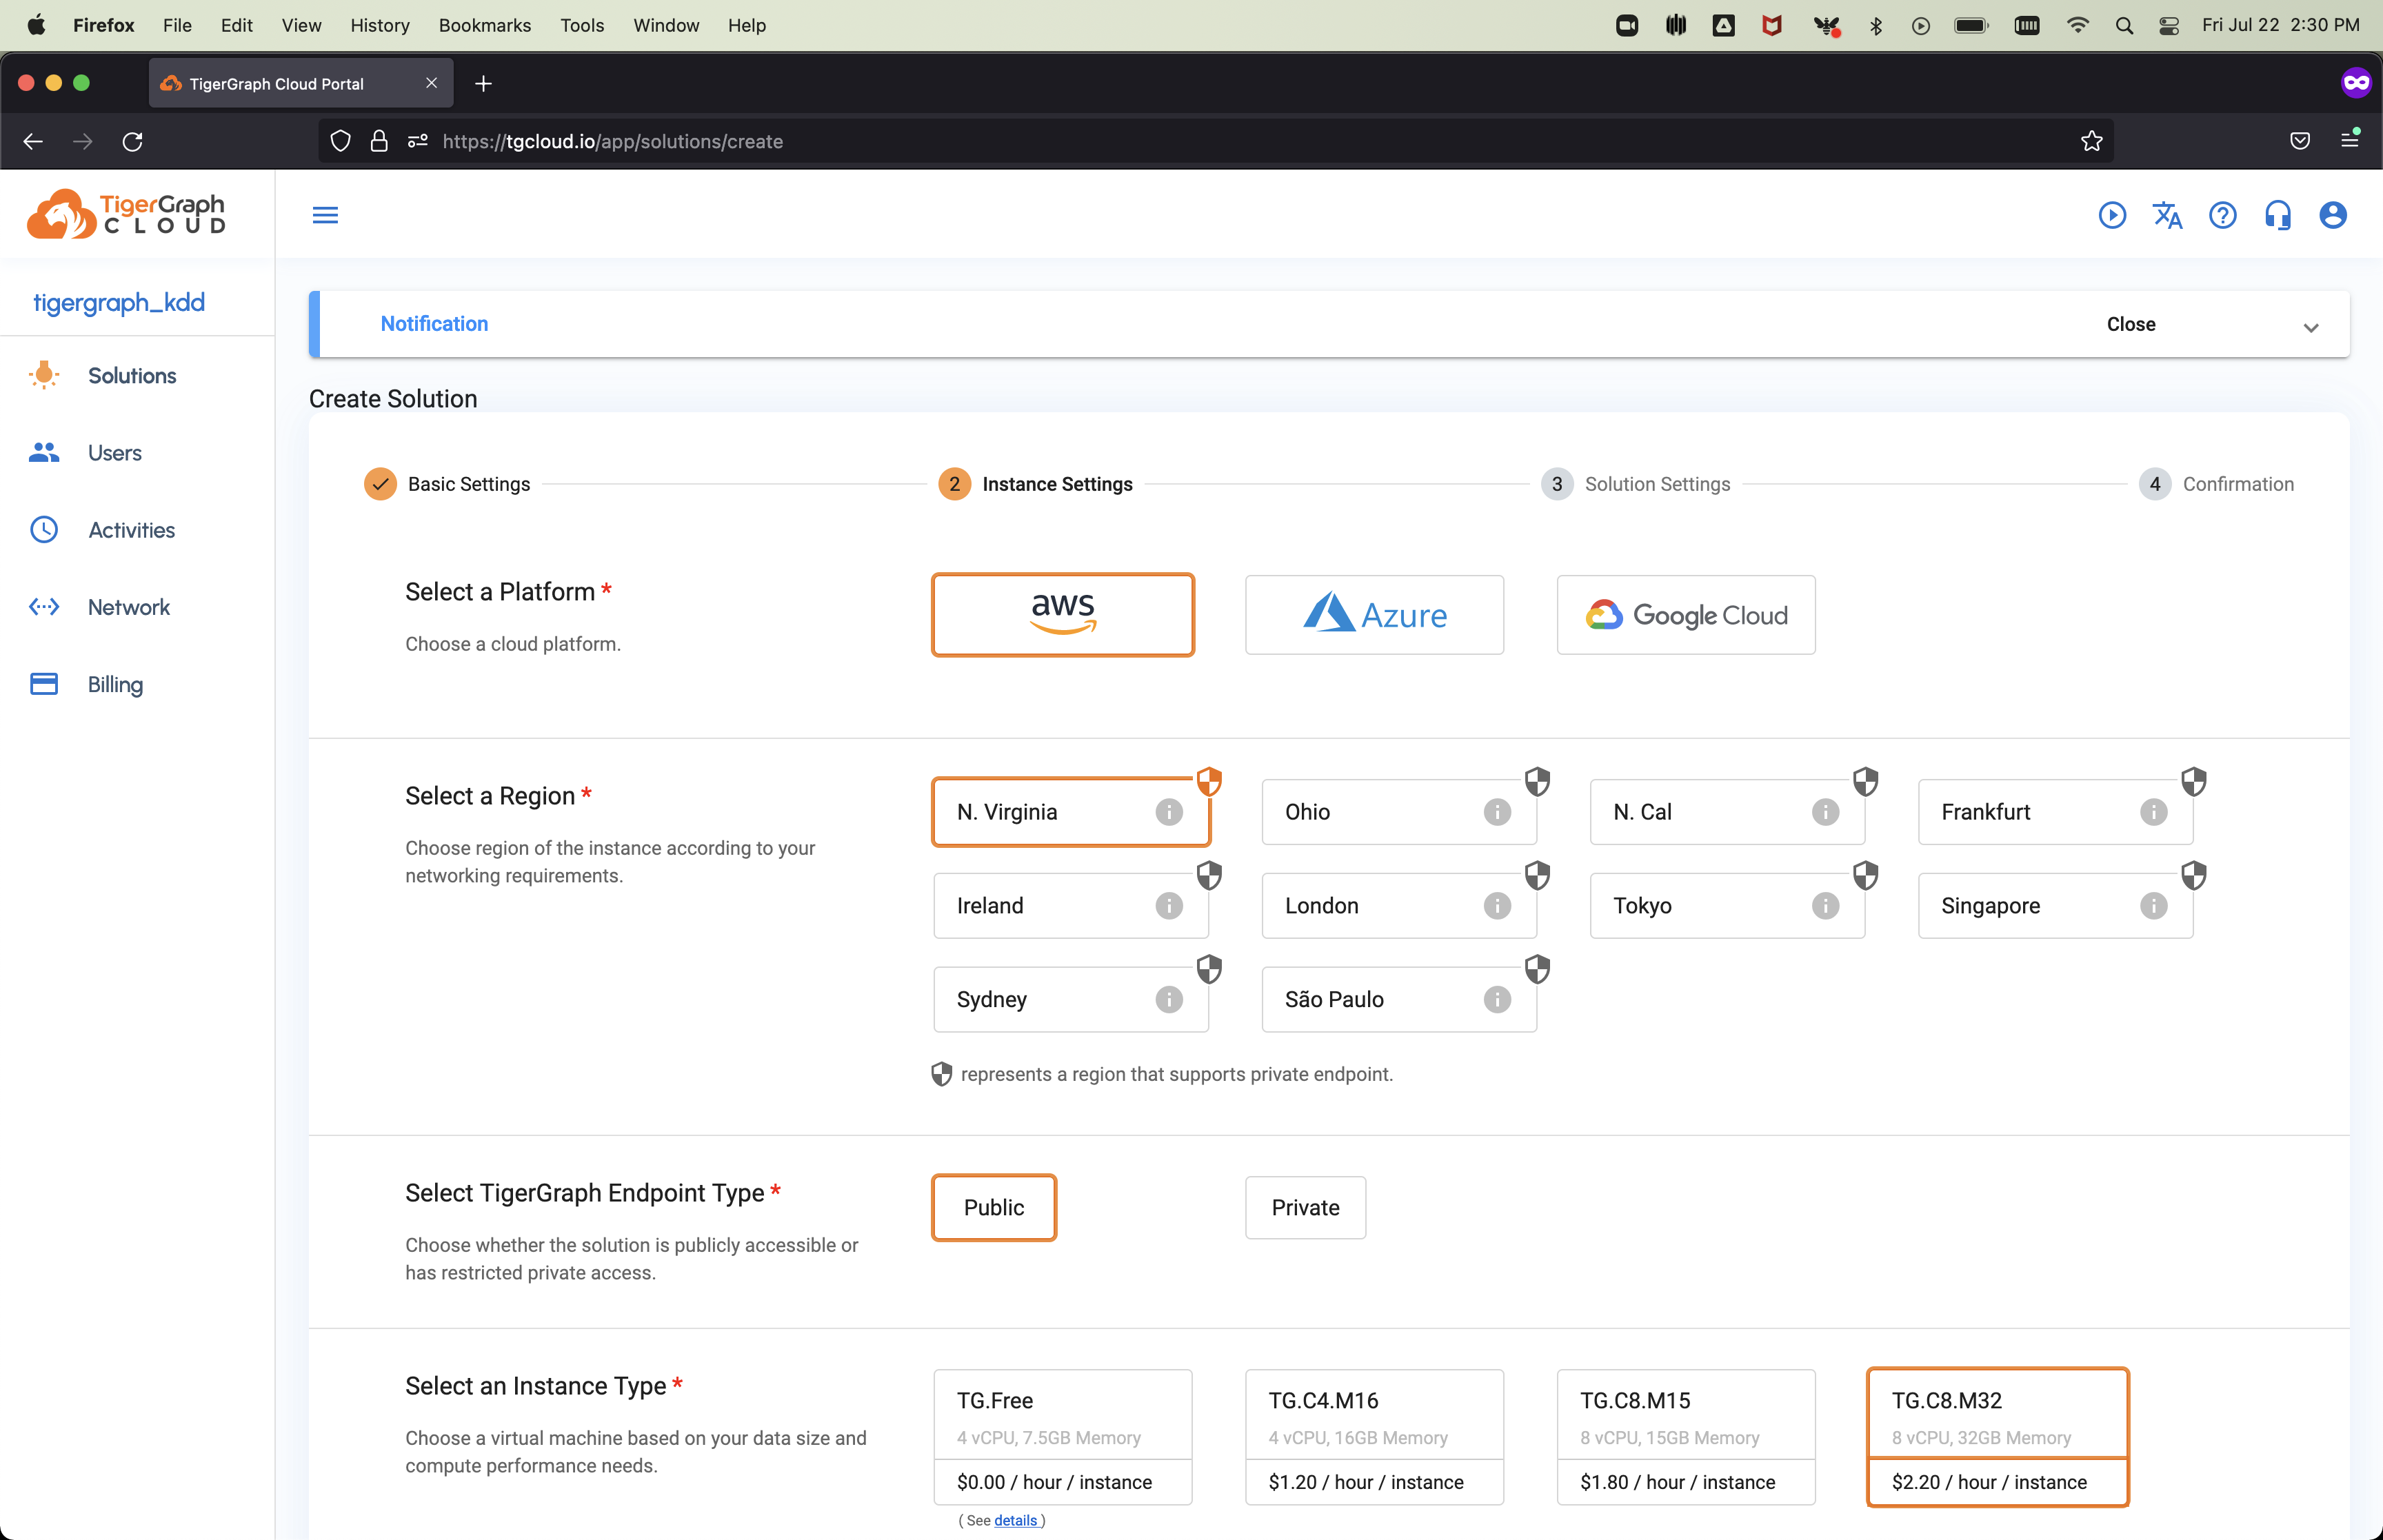
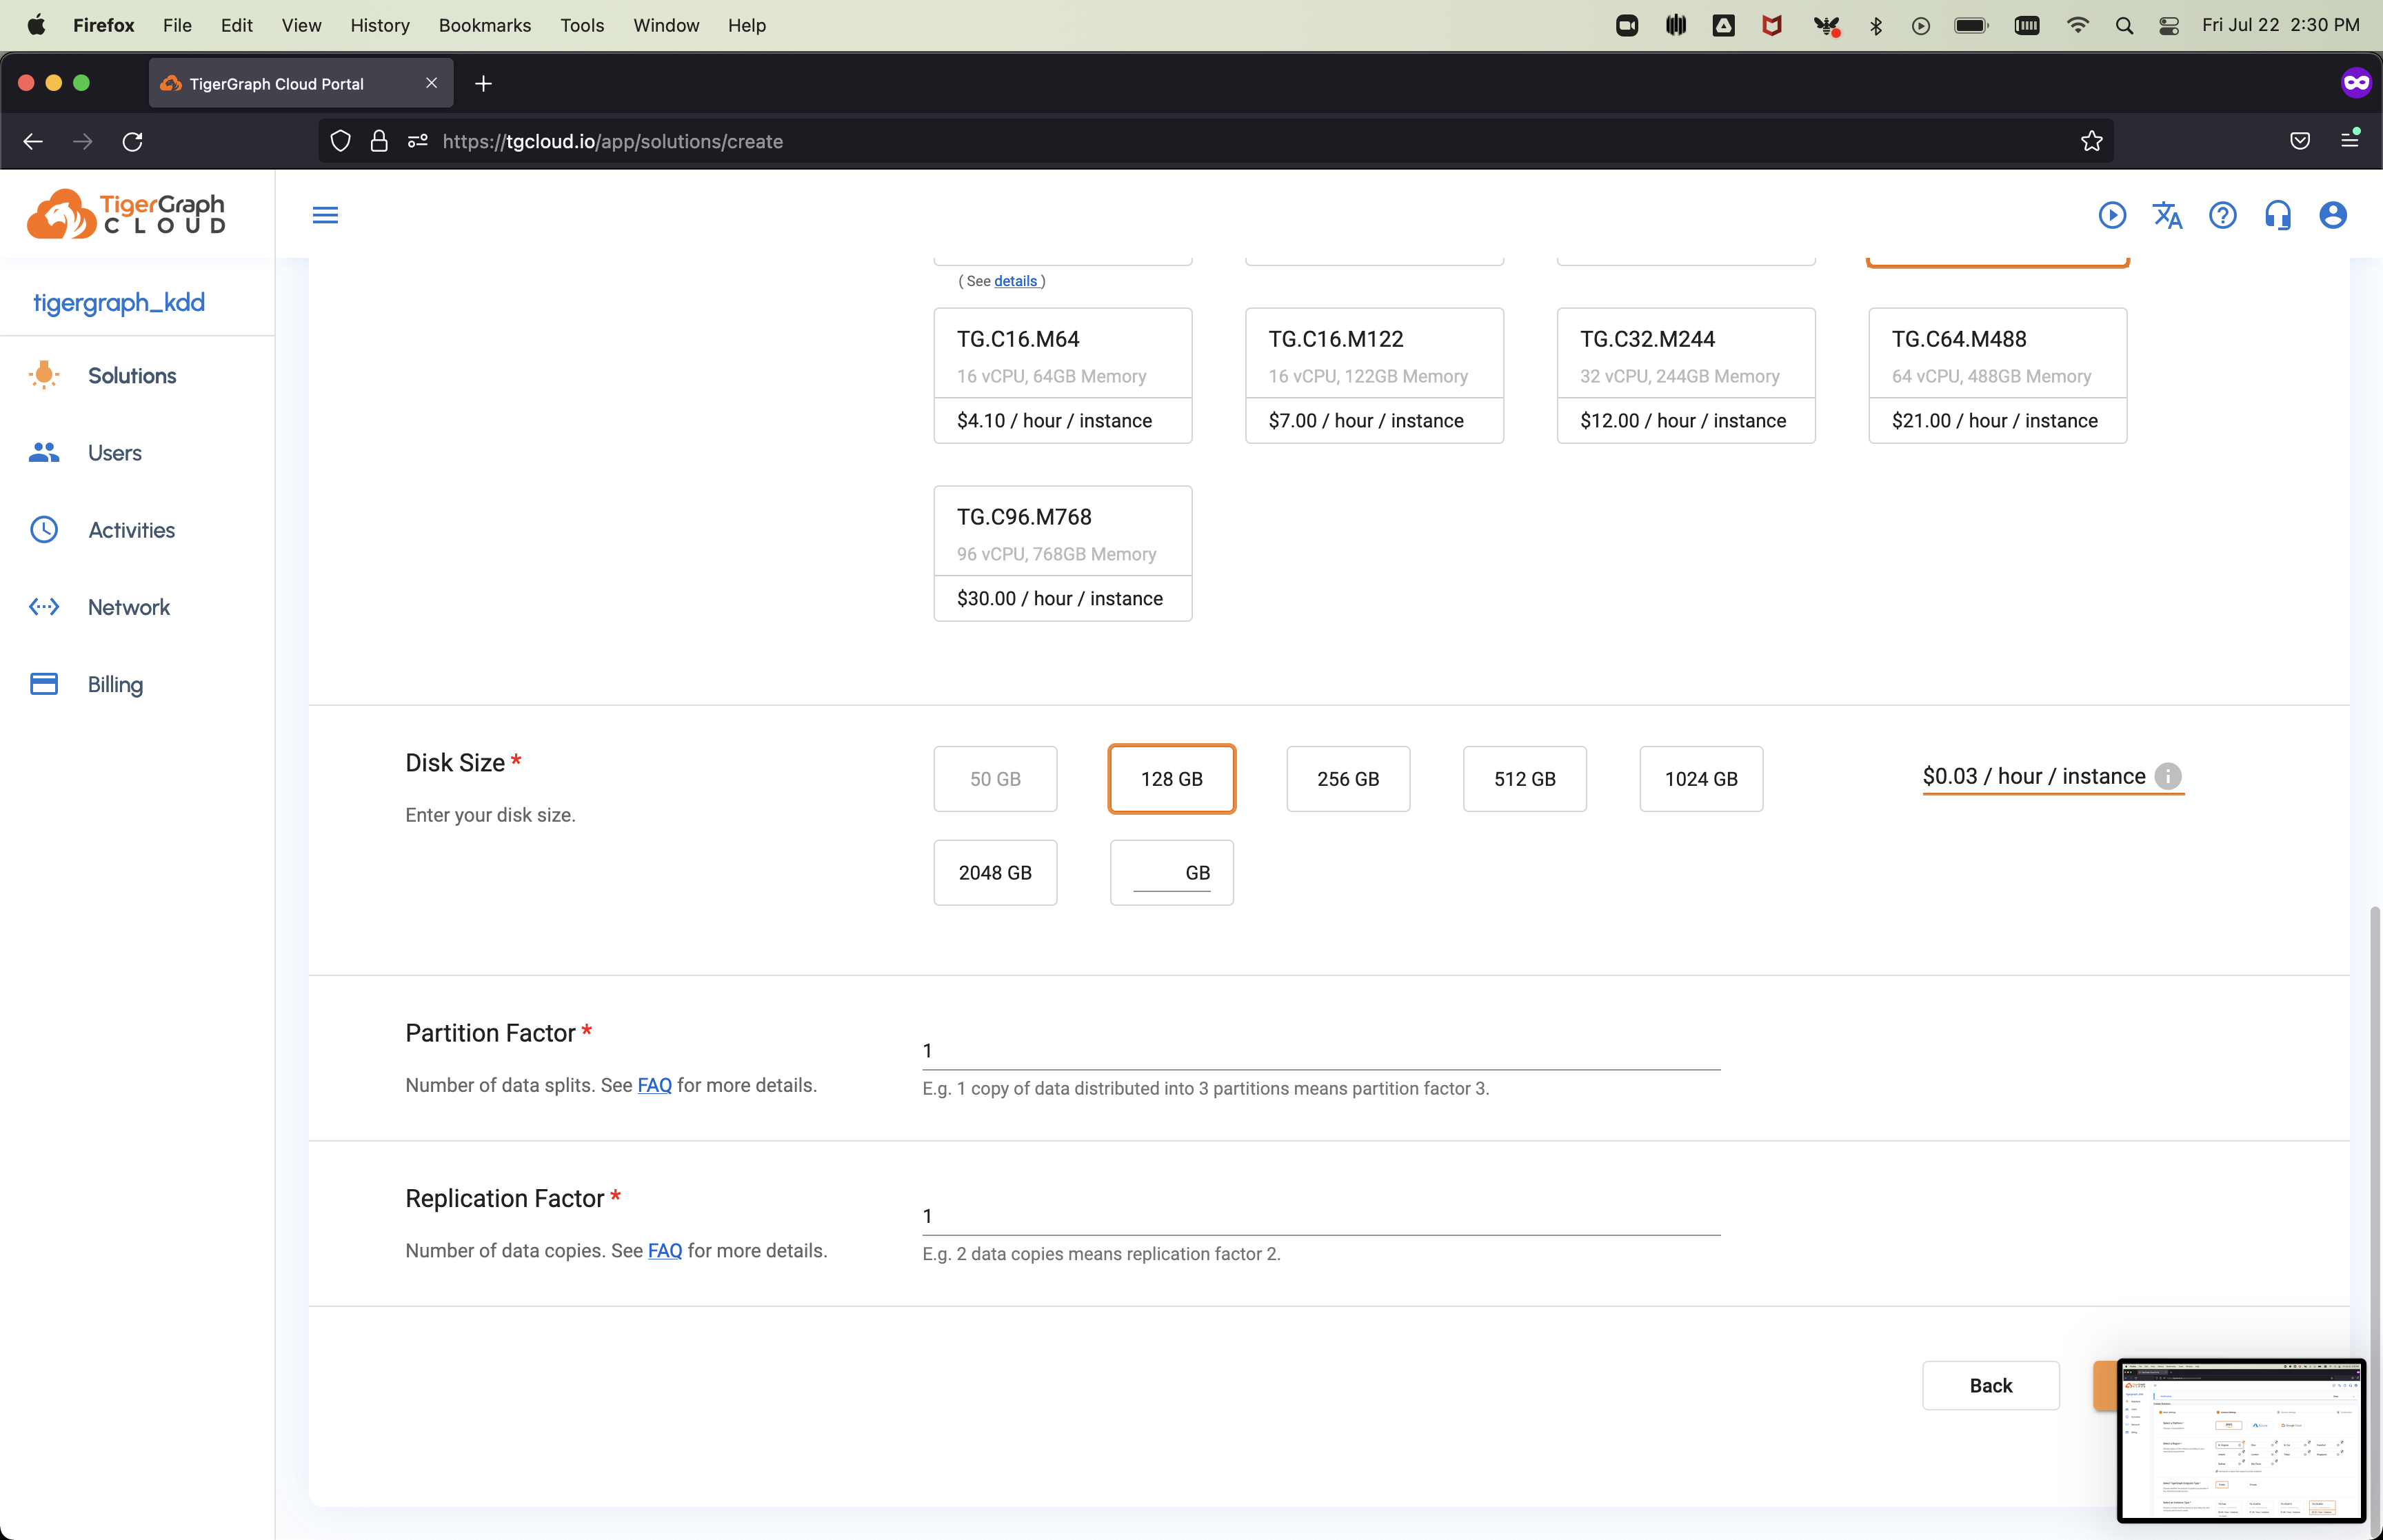
Select AWS as the platform, N. Virginia as the region, a Public endpoint, and the TG.C8.M32 Instance Type. Leave the defaults below, scroll to the bottom of the page, and click Next
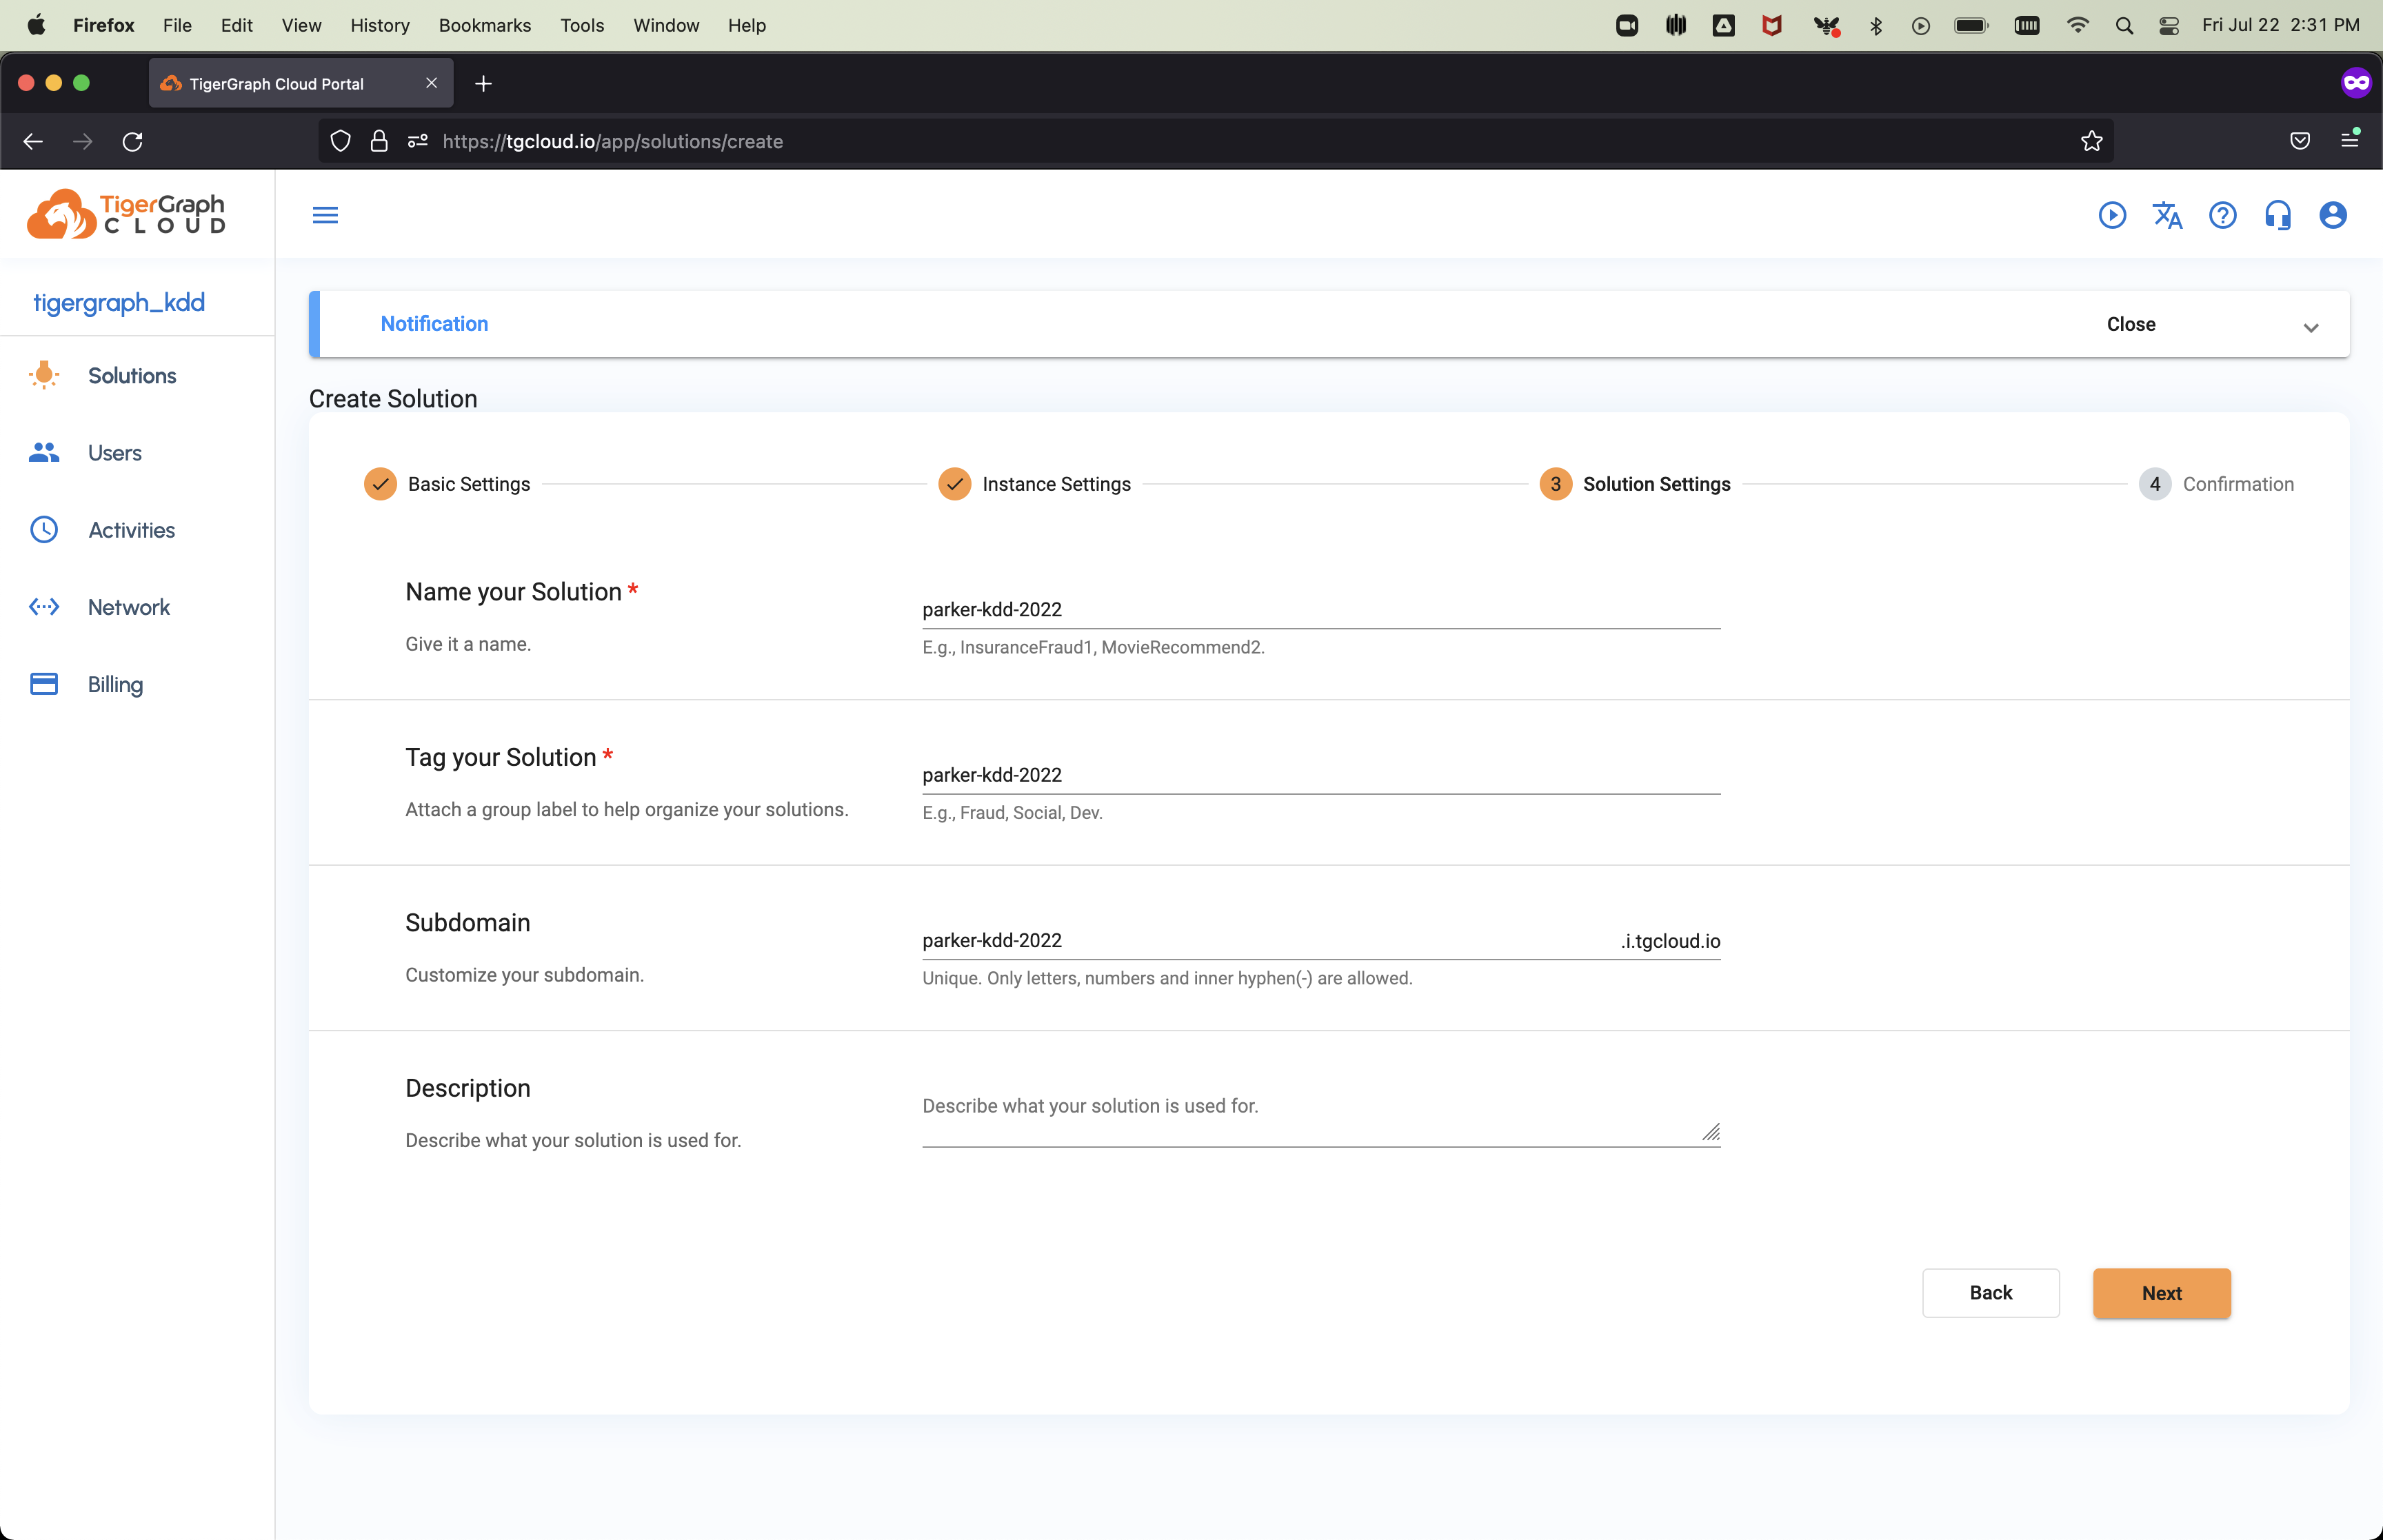
We will then name and tag the solution we are provisioning. The names, tags, and subdomains must be unique, so choose something that is identifiable to you.
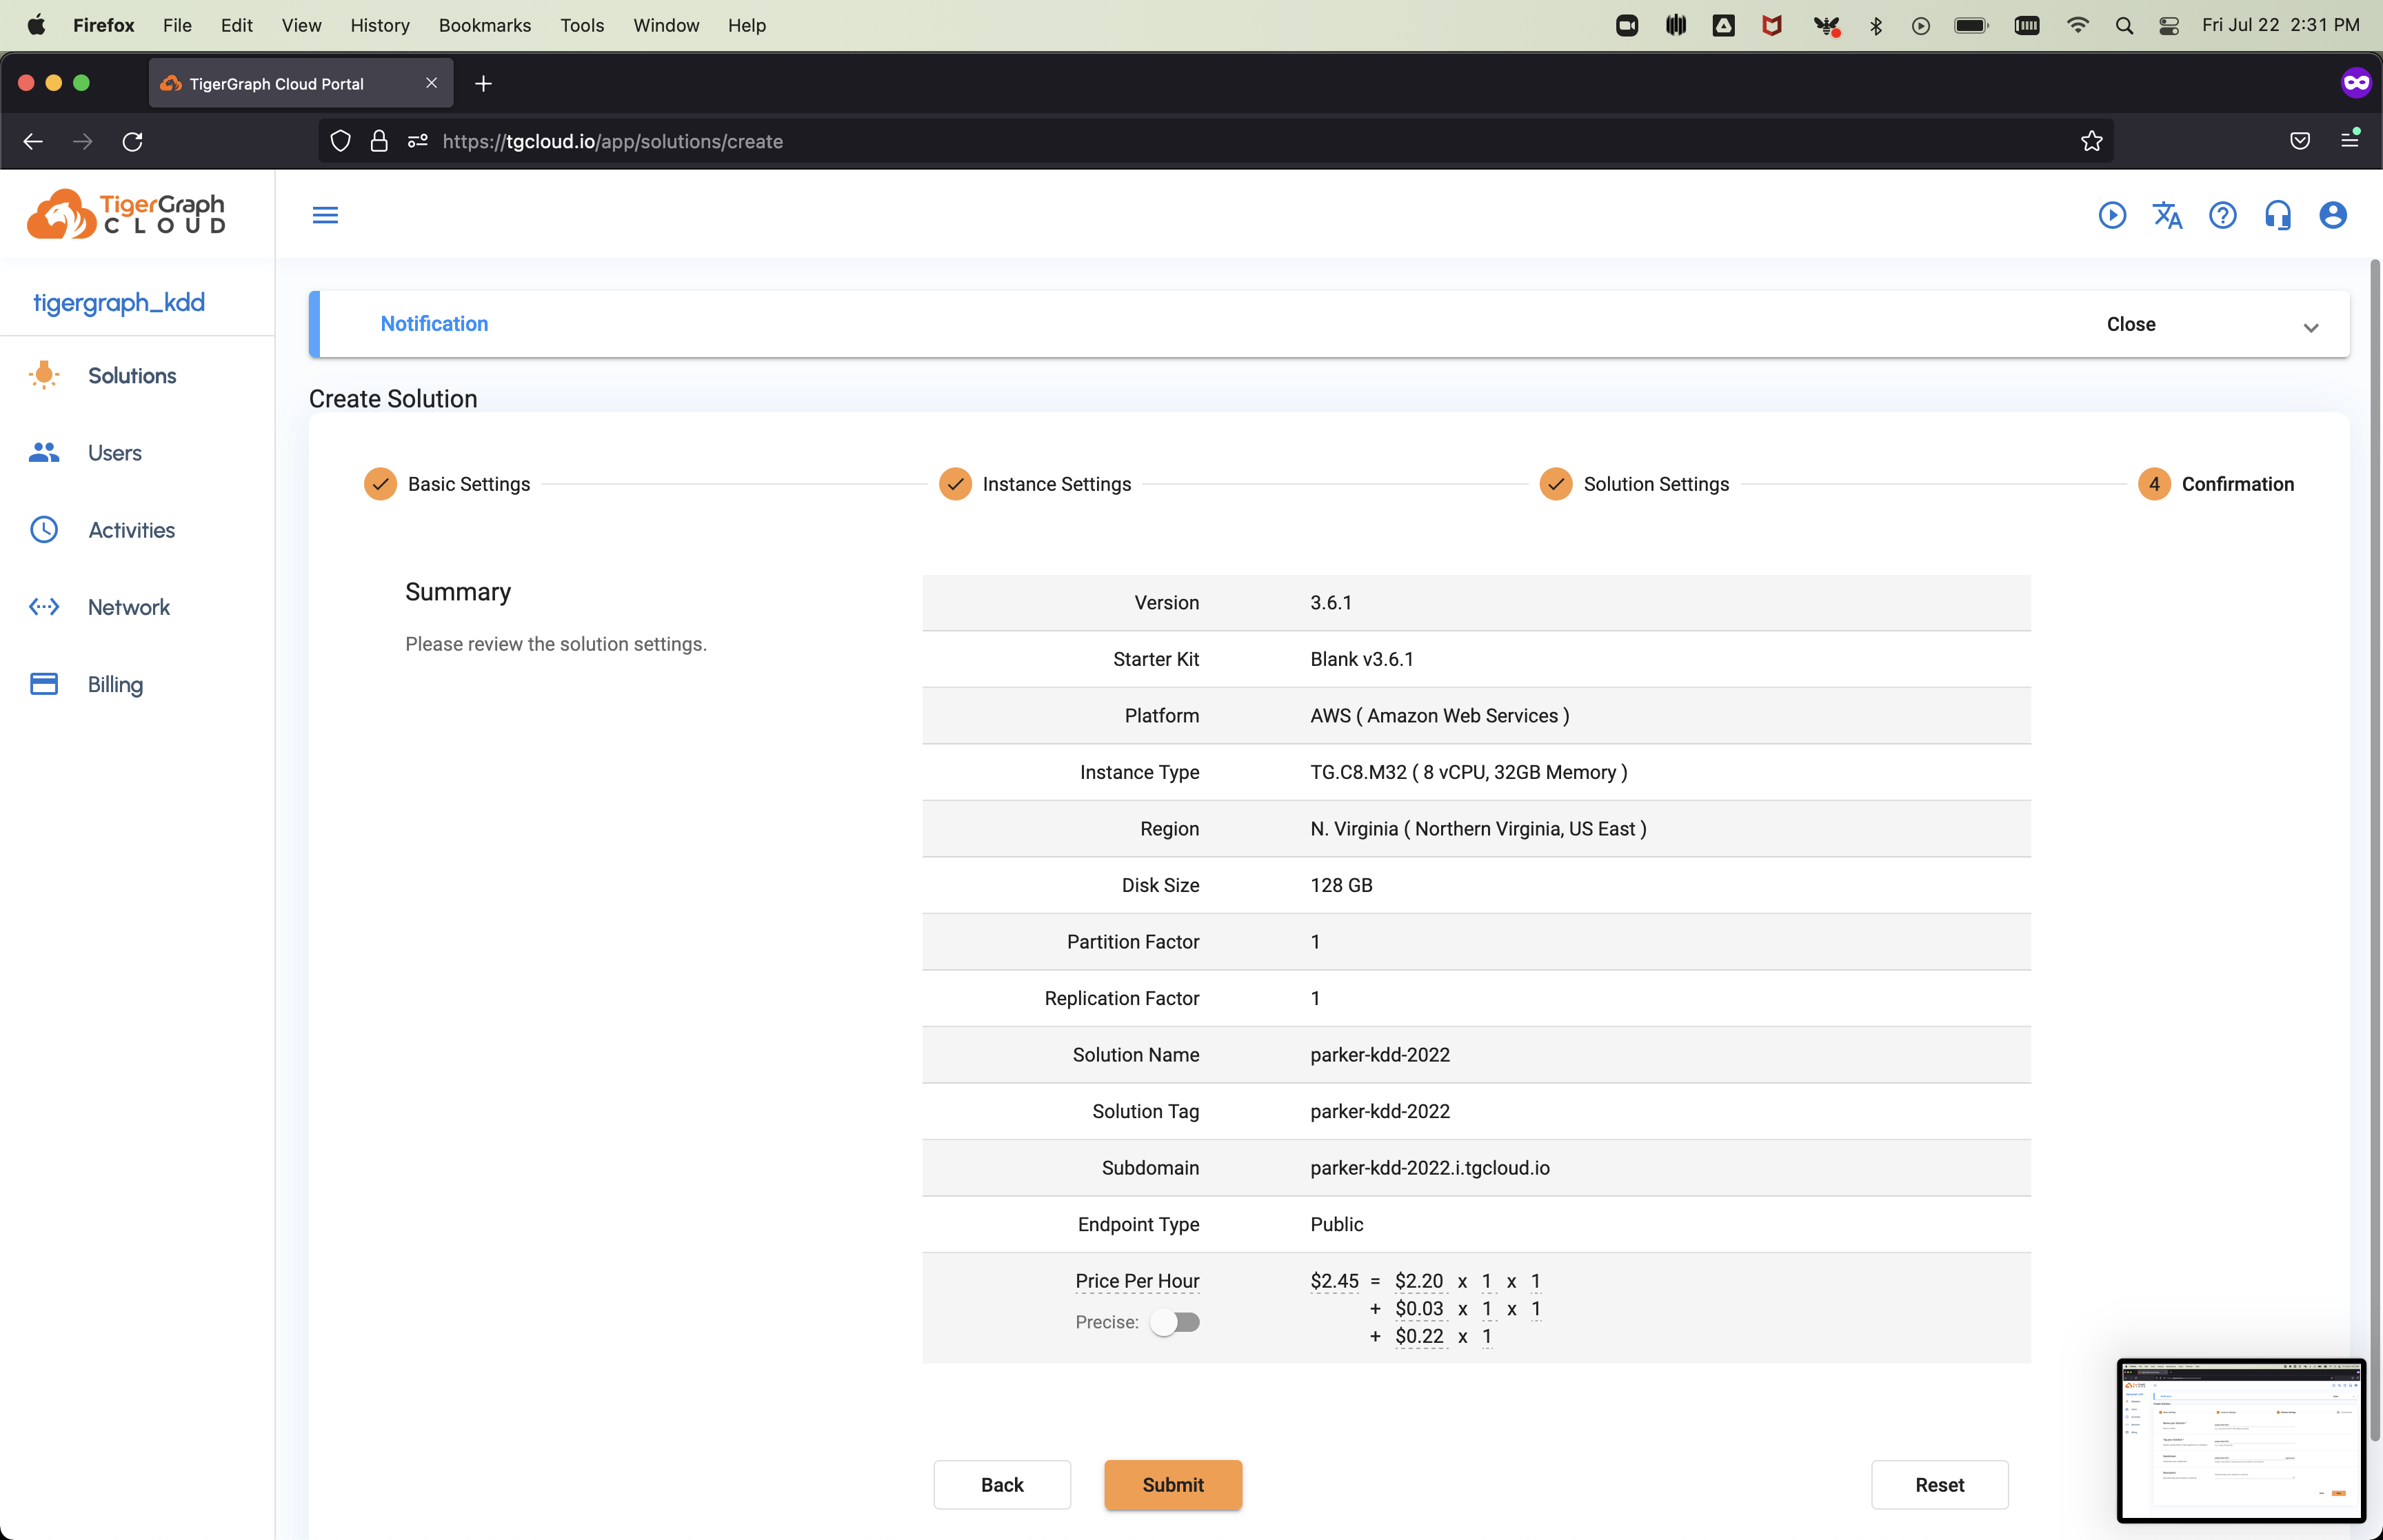
After clicking next, you should see a confirmation page where you can check the details and then hit Submit.
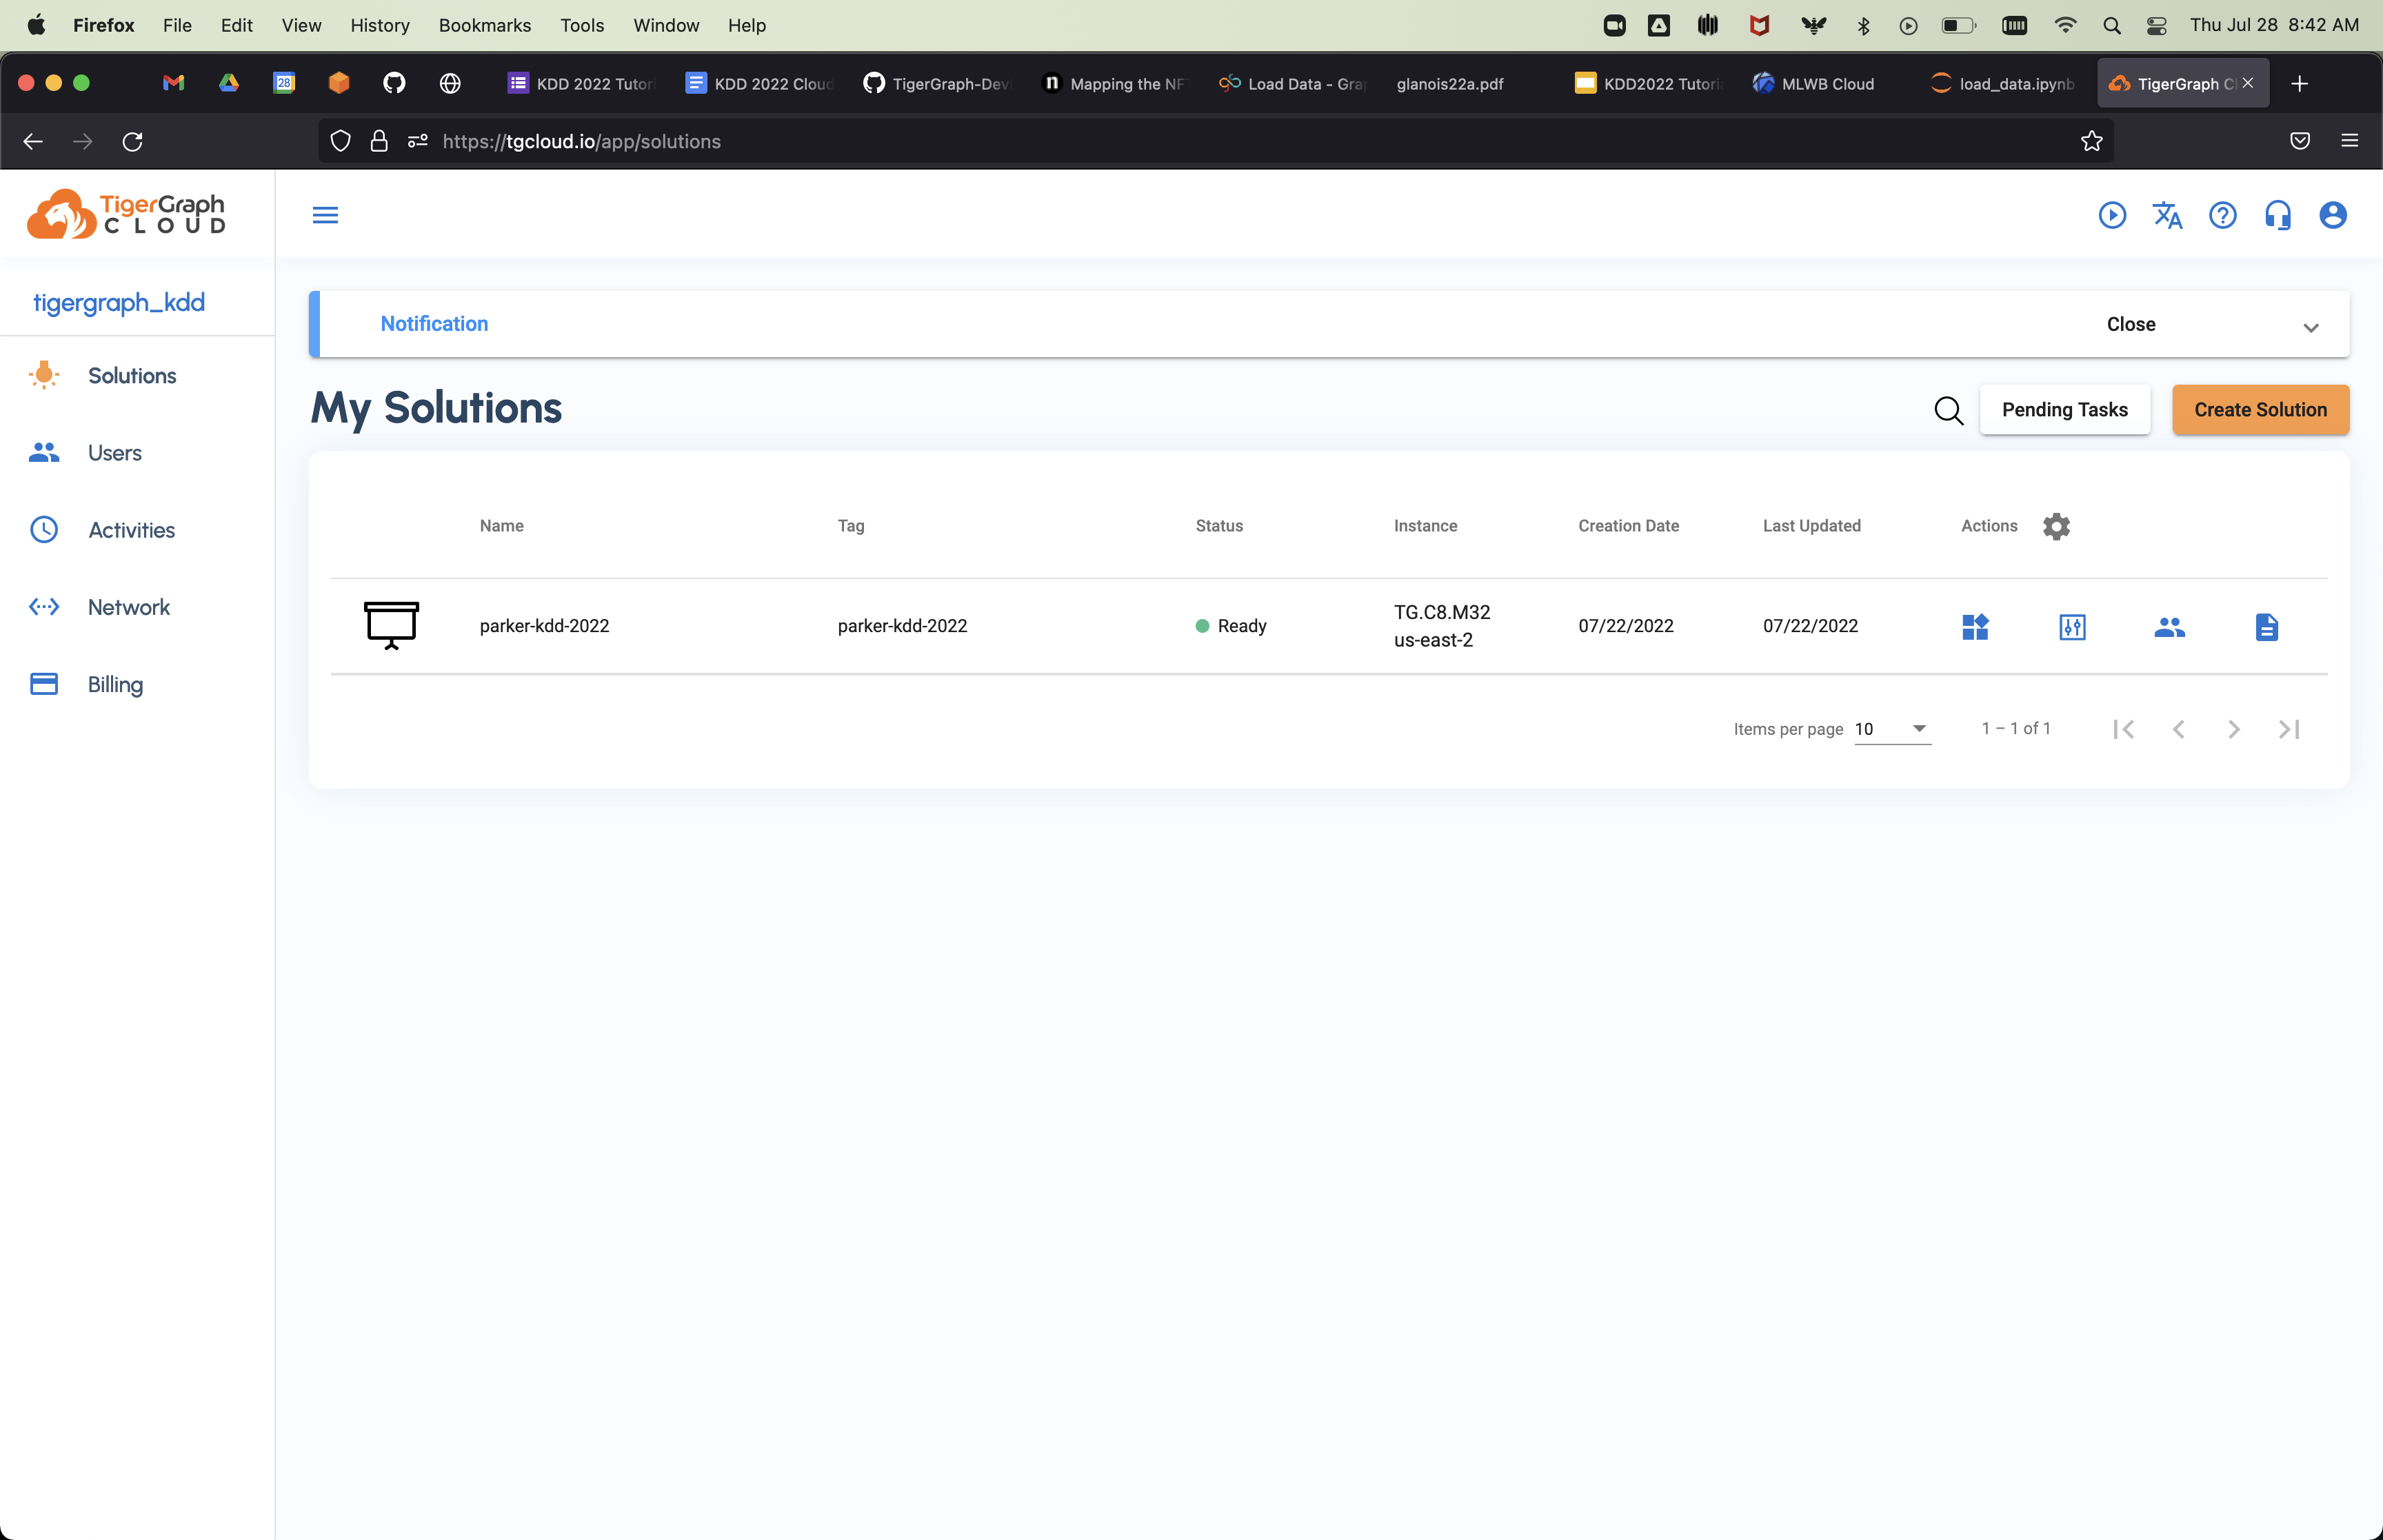
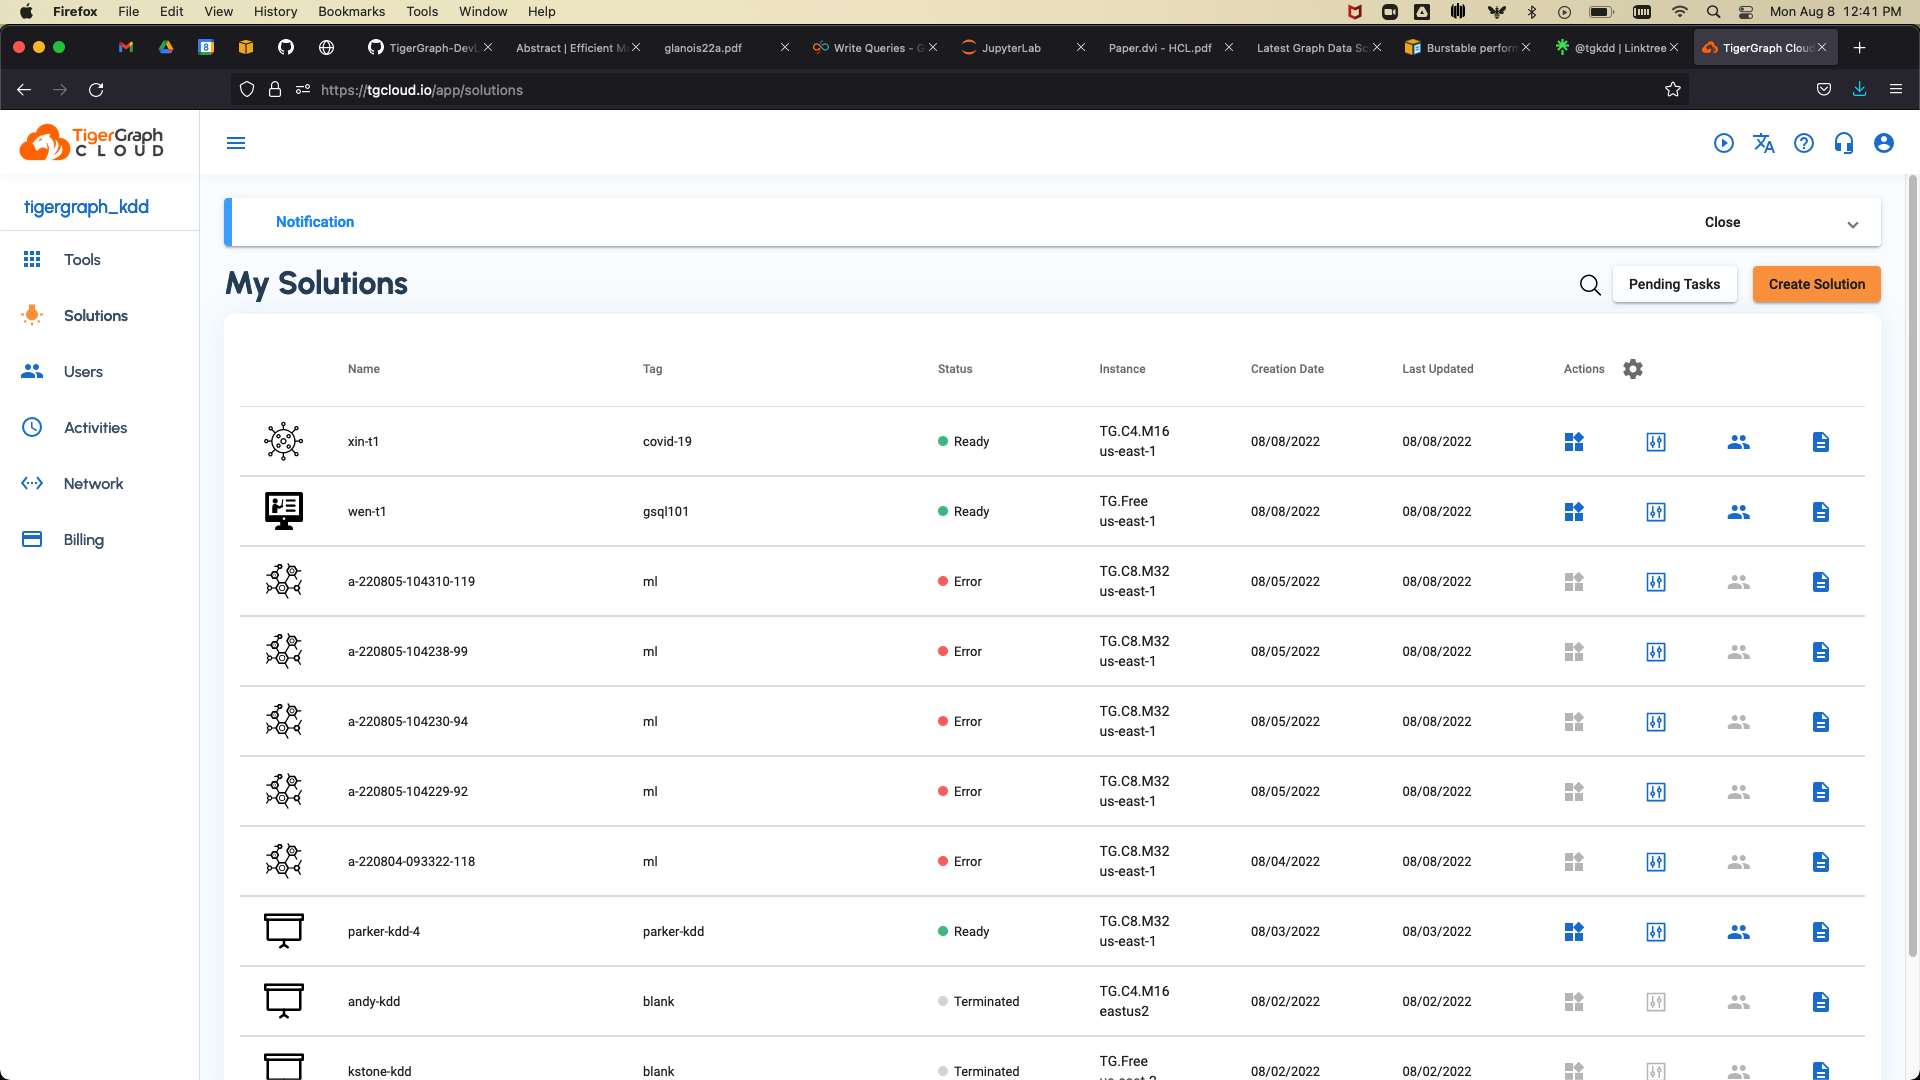
This will then take you back to the solutions page, where you can find your solution after a few minutes:
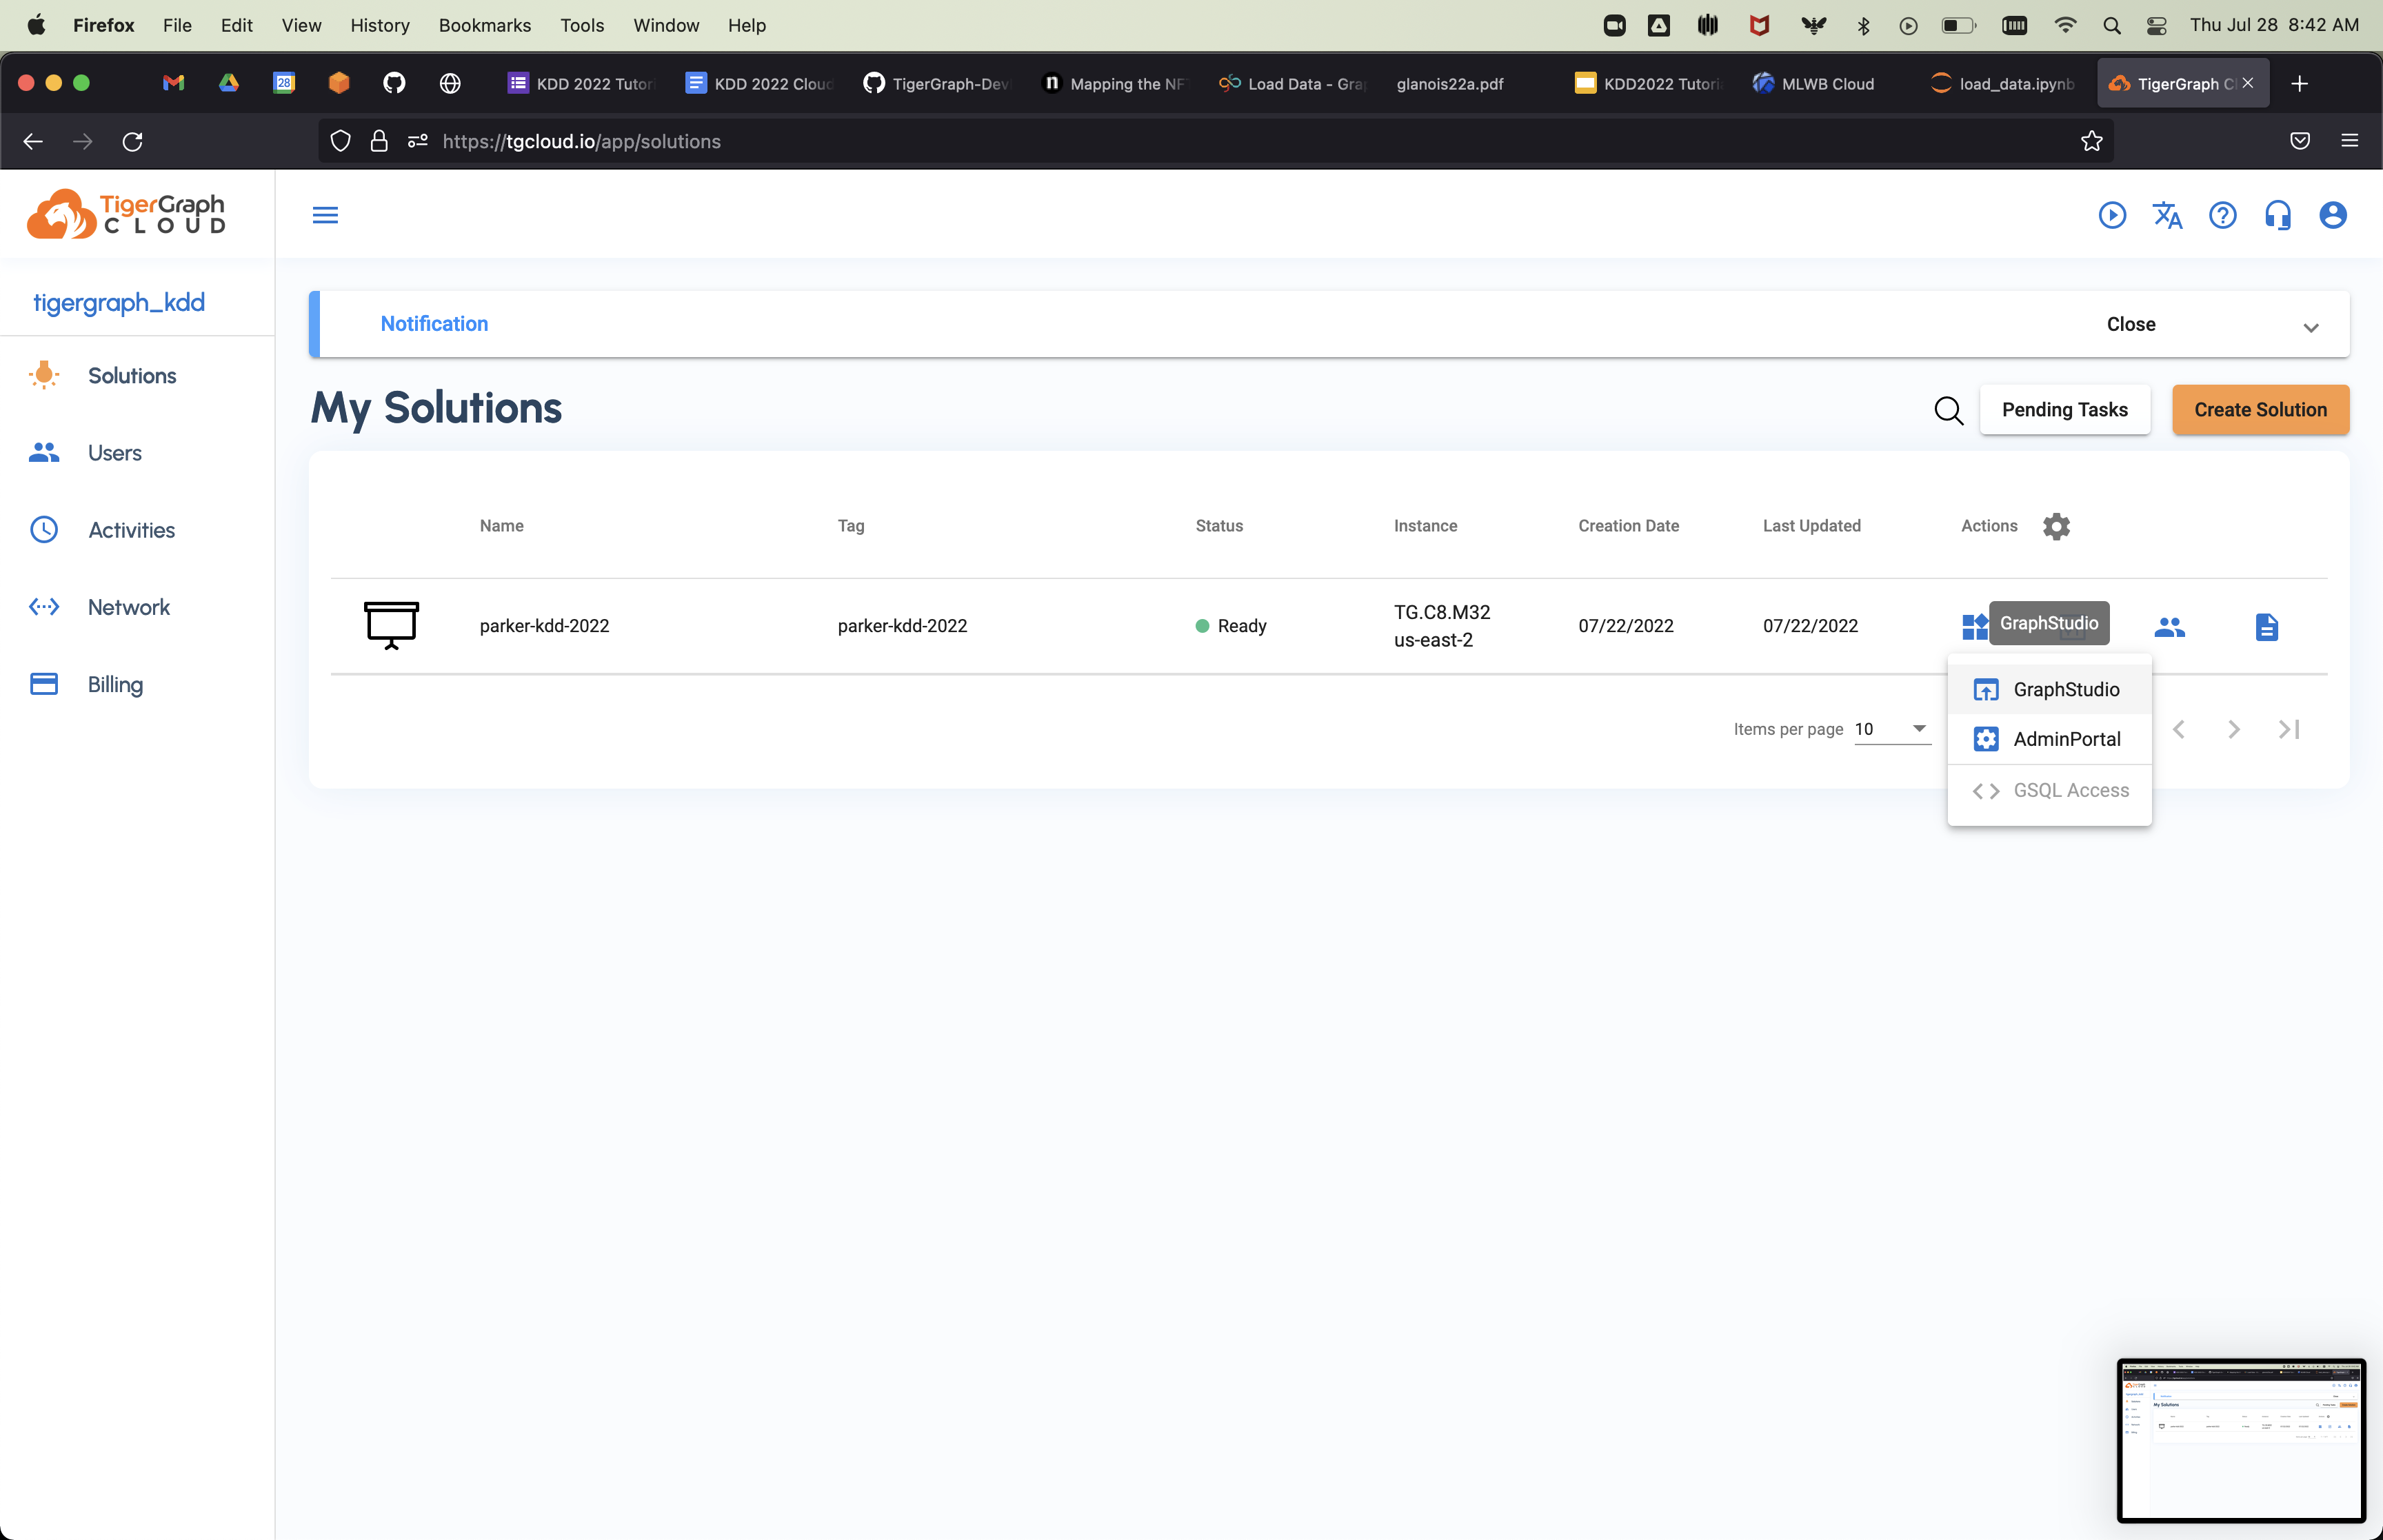
Once your solution is provisioned, we want to connect to the GraphStudio UI. To do this, click on the Applications icon and select GraphStudio.
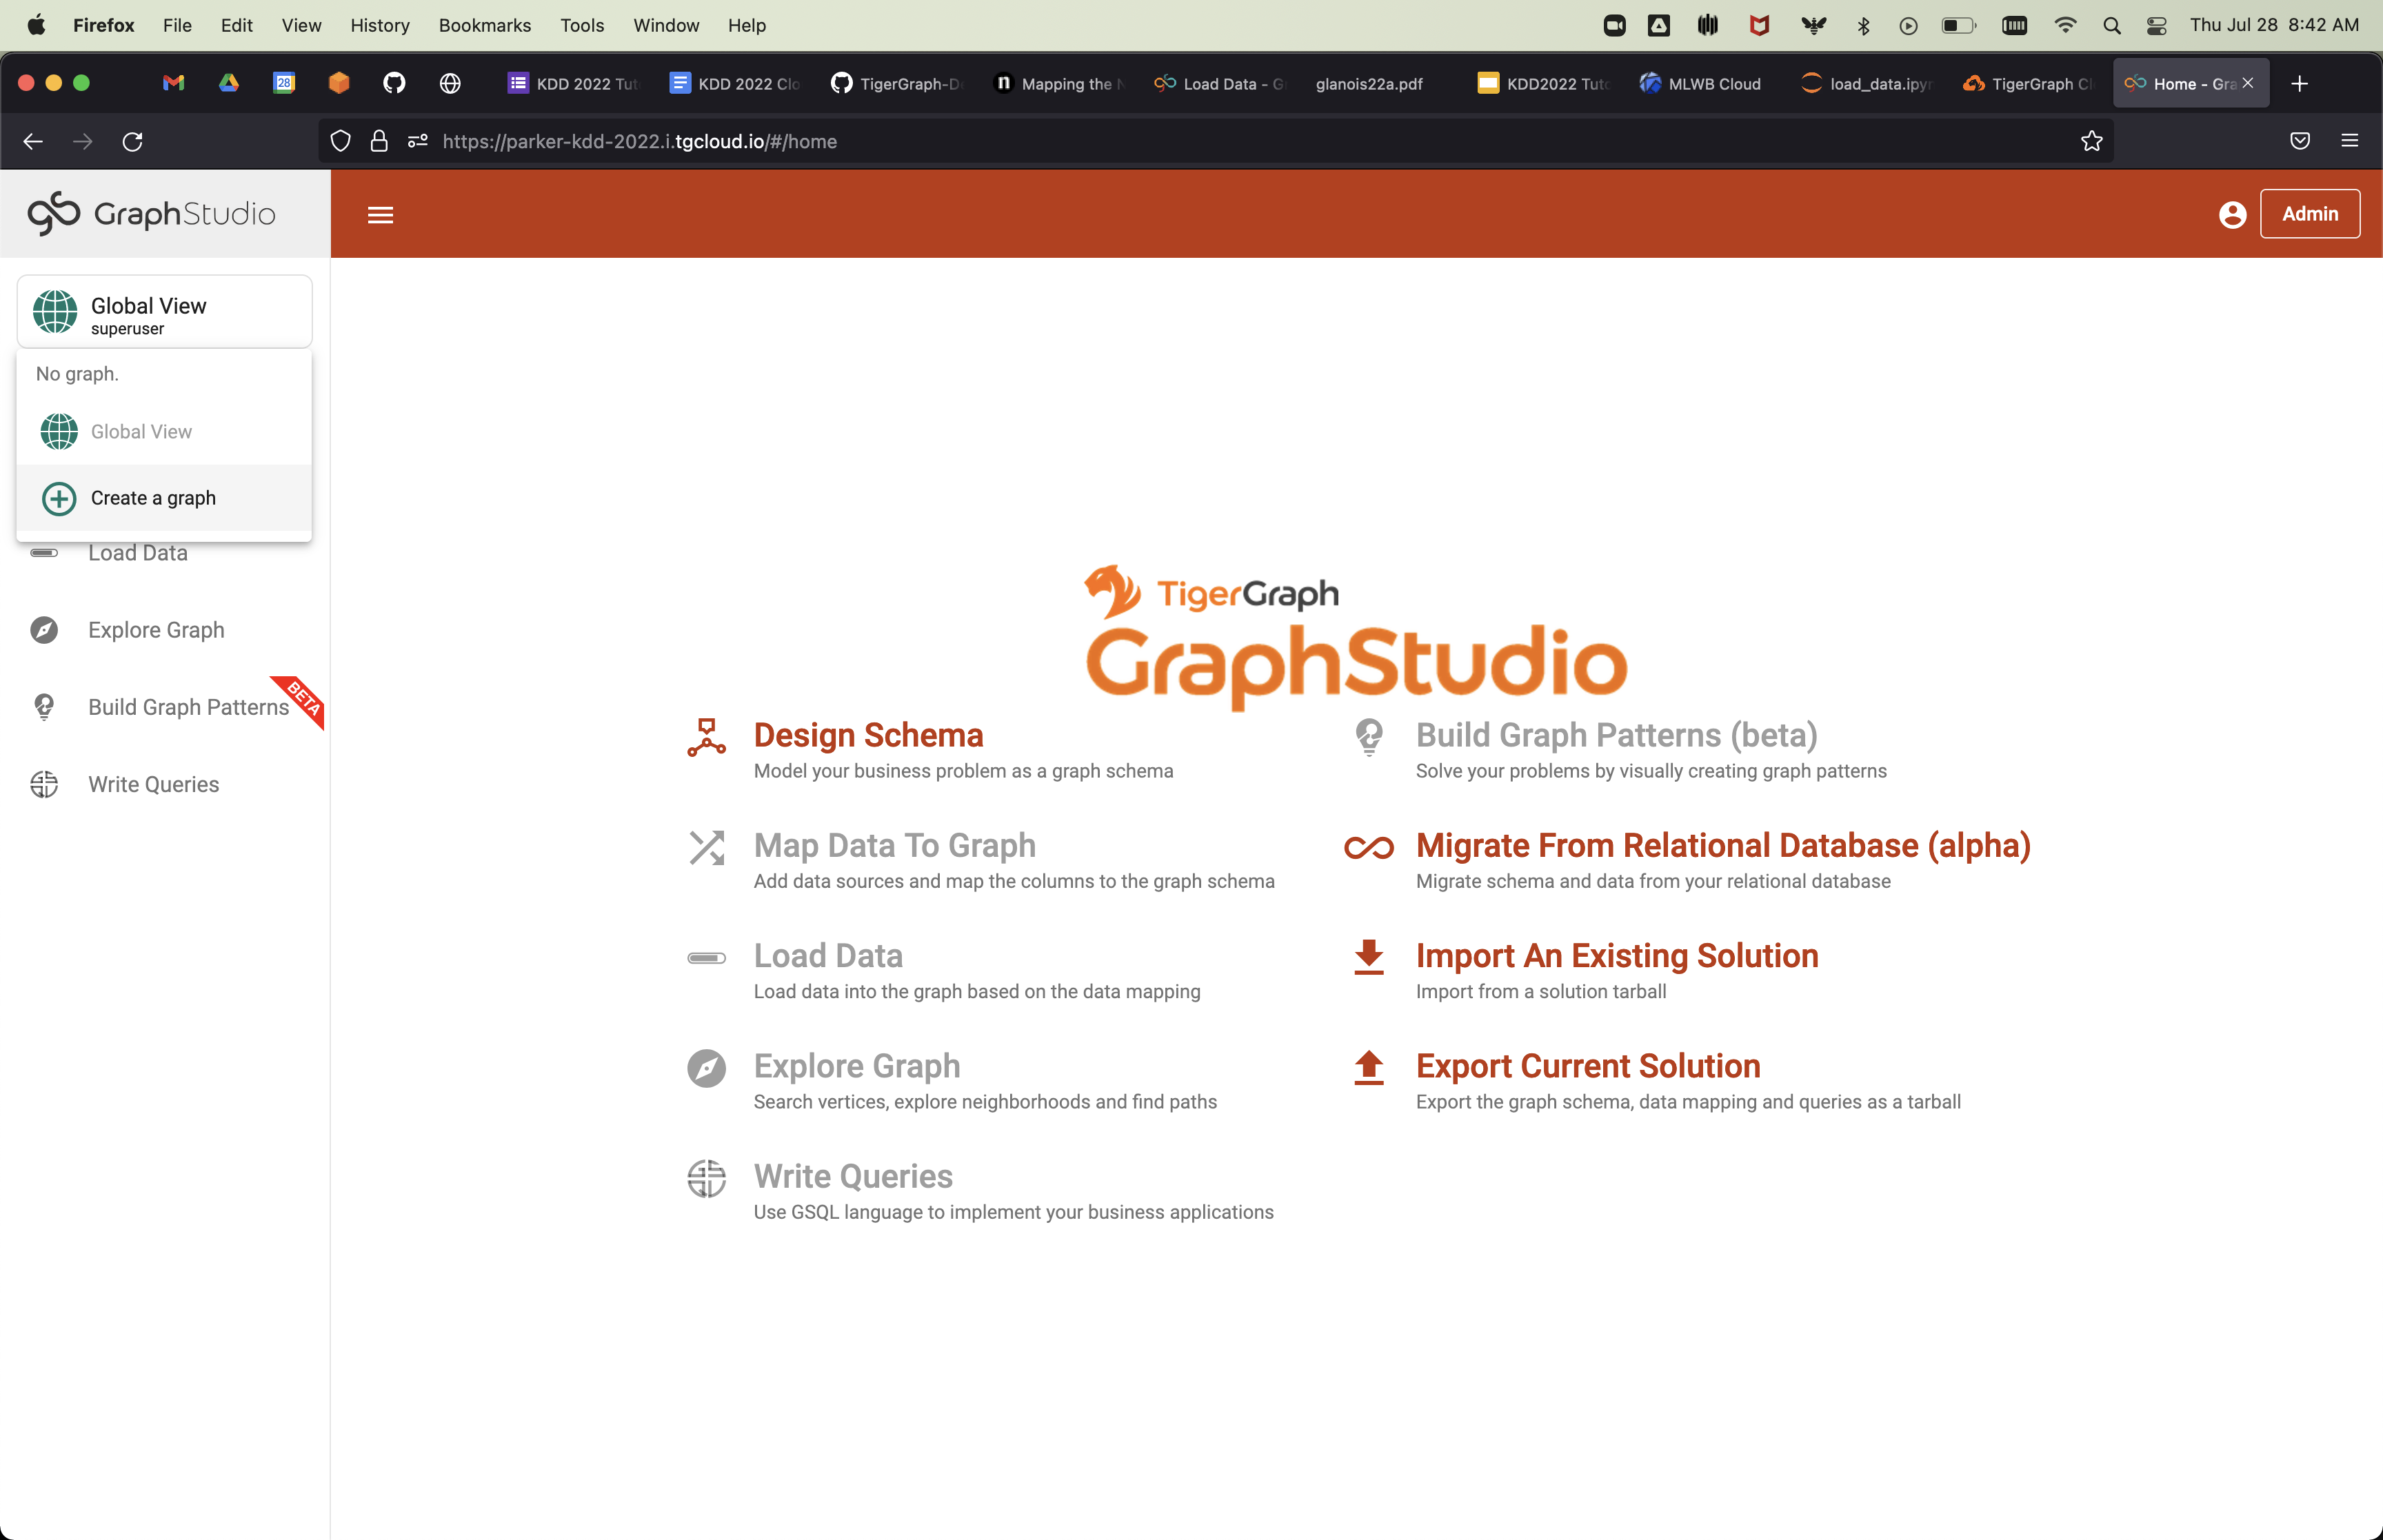
This will take you to the GraphStudio landing page, where we can create our graph. Click on the Global View button and select Create a graph:
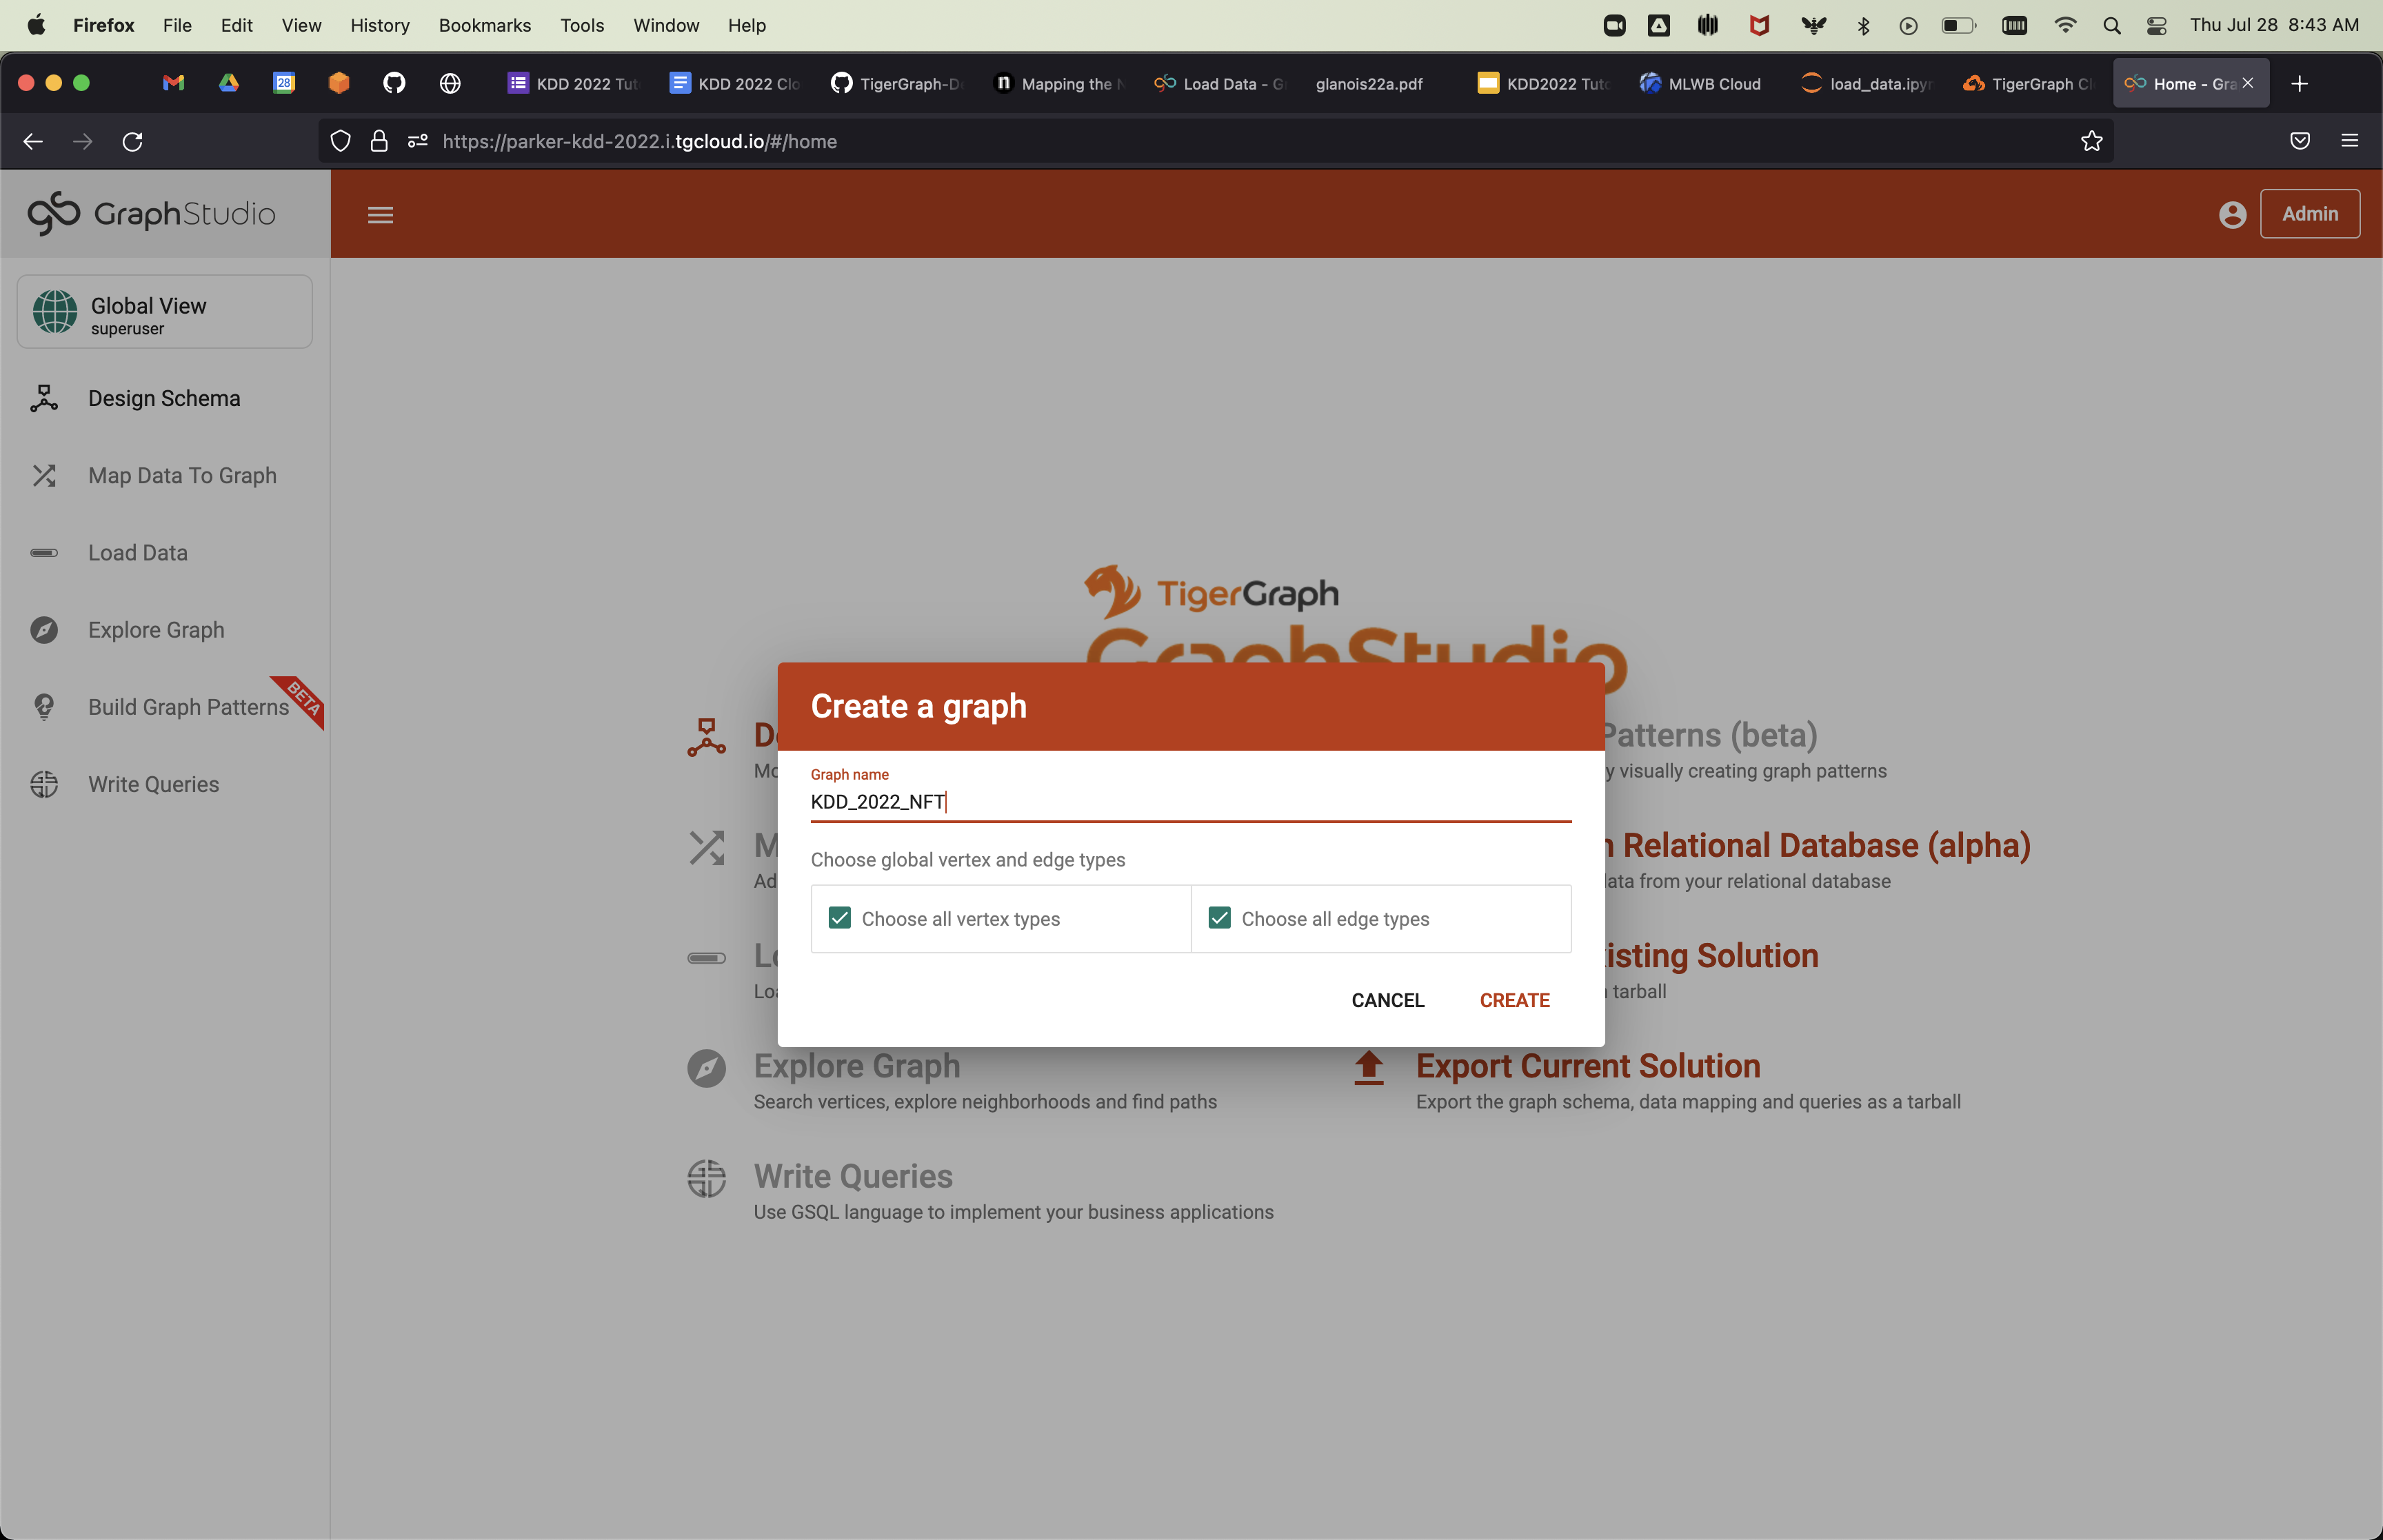
Clicking this will bring up the following pop-up. Fill in the graph name as KDD_2022_NFT, and then select Create:
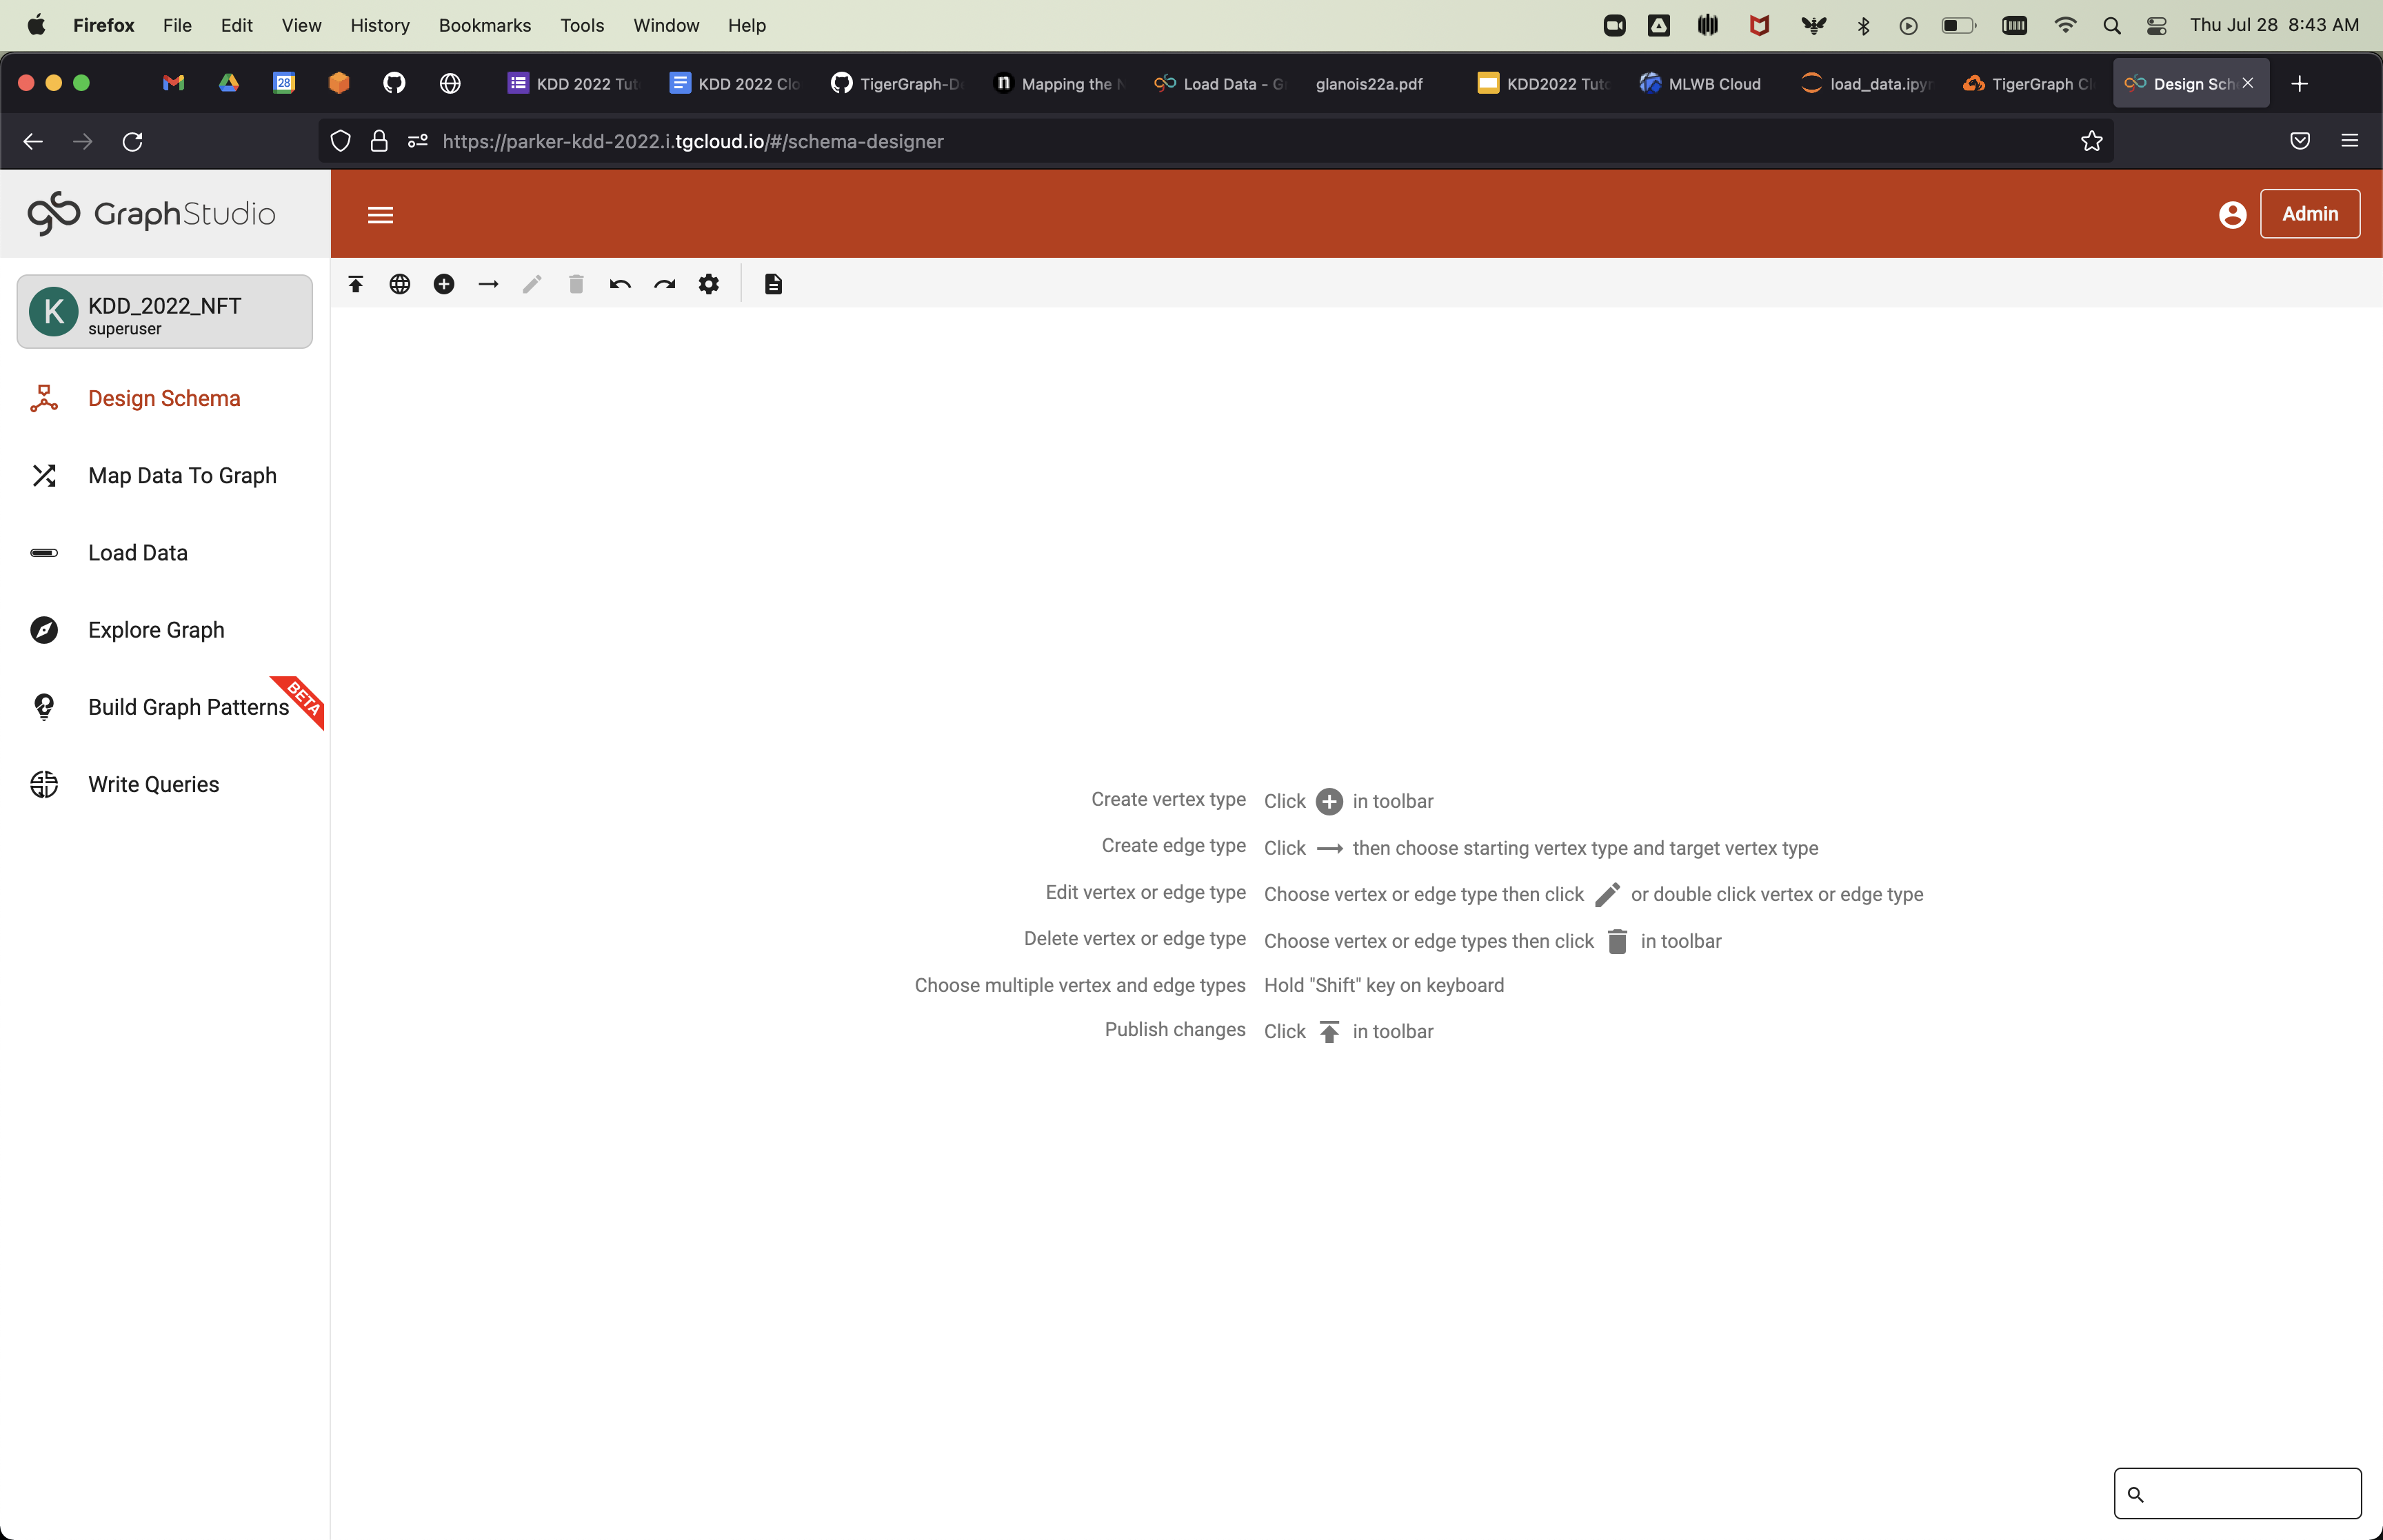
After this, you should see the following:
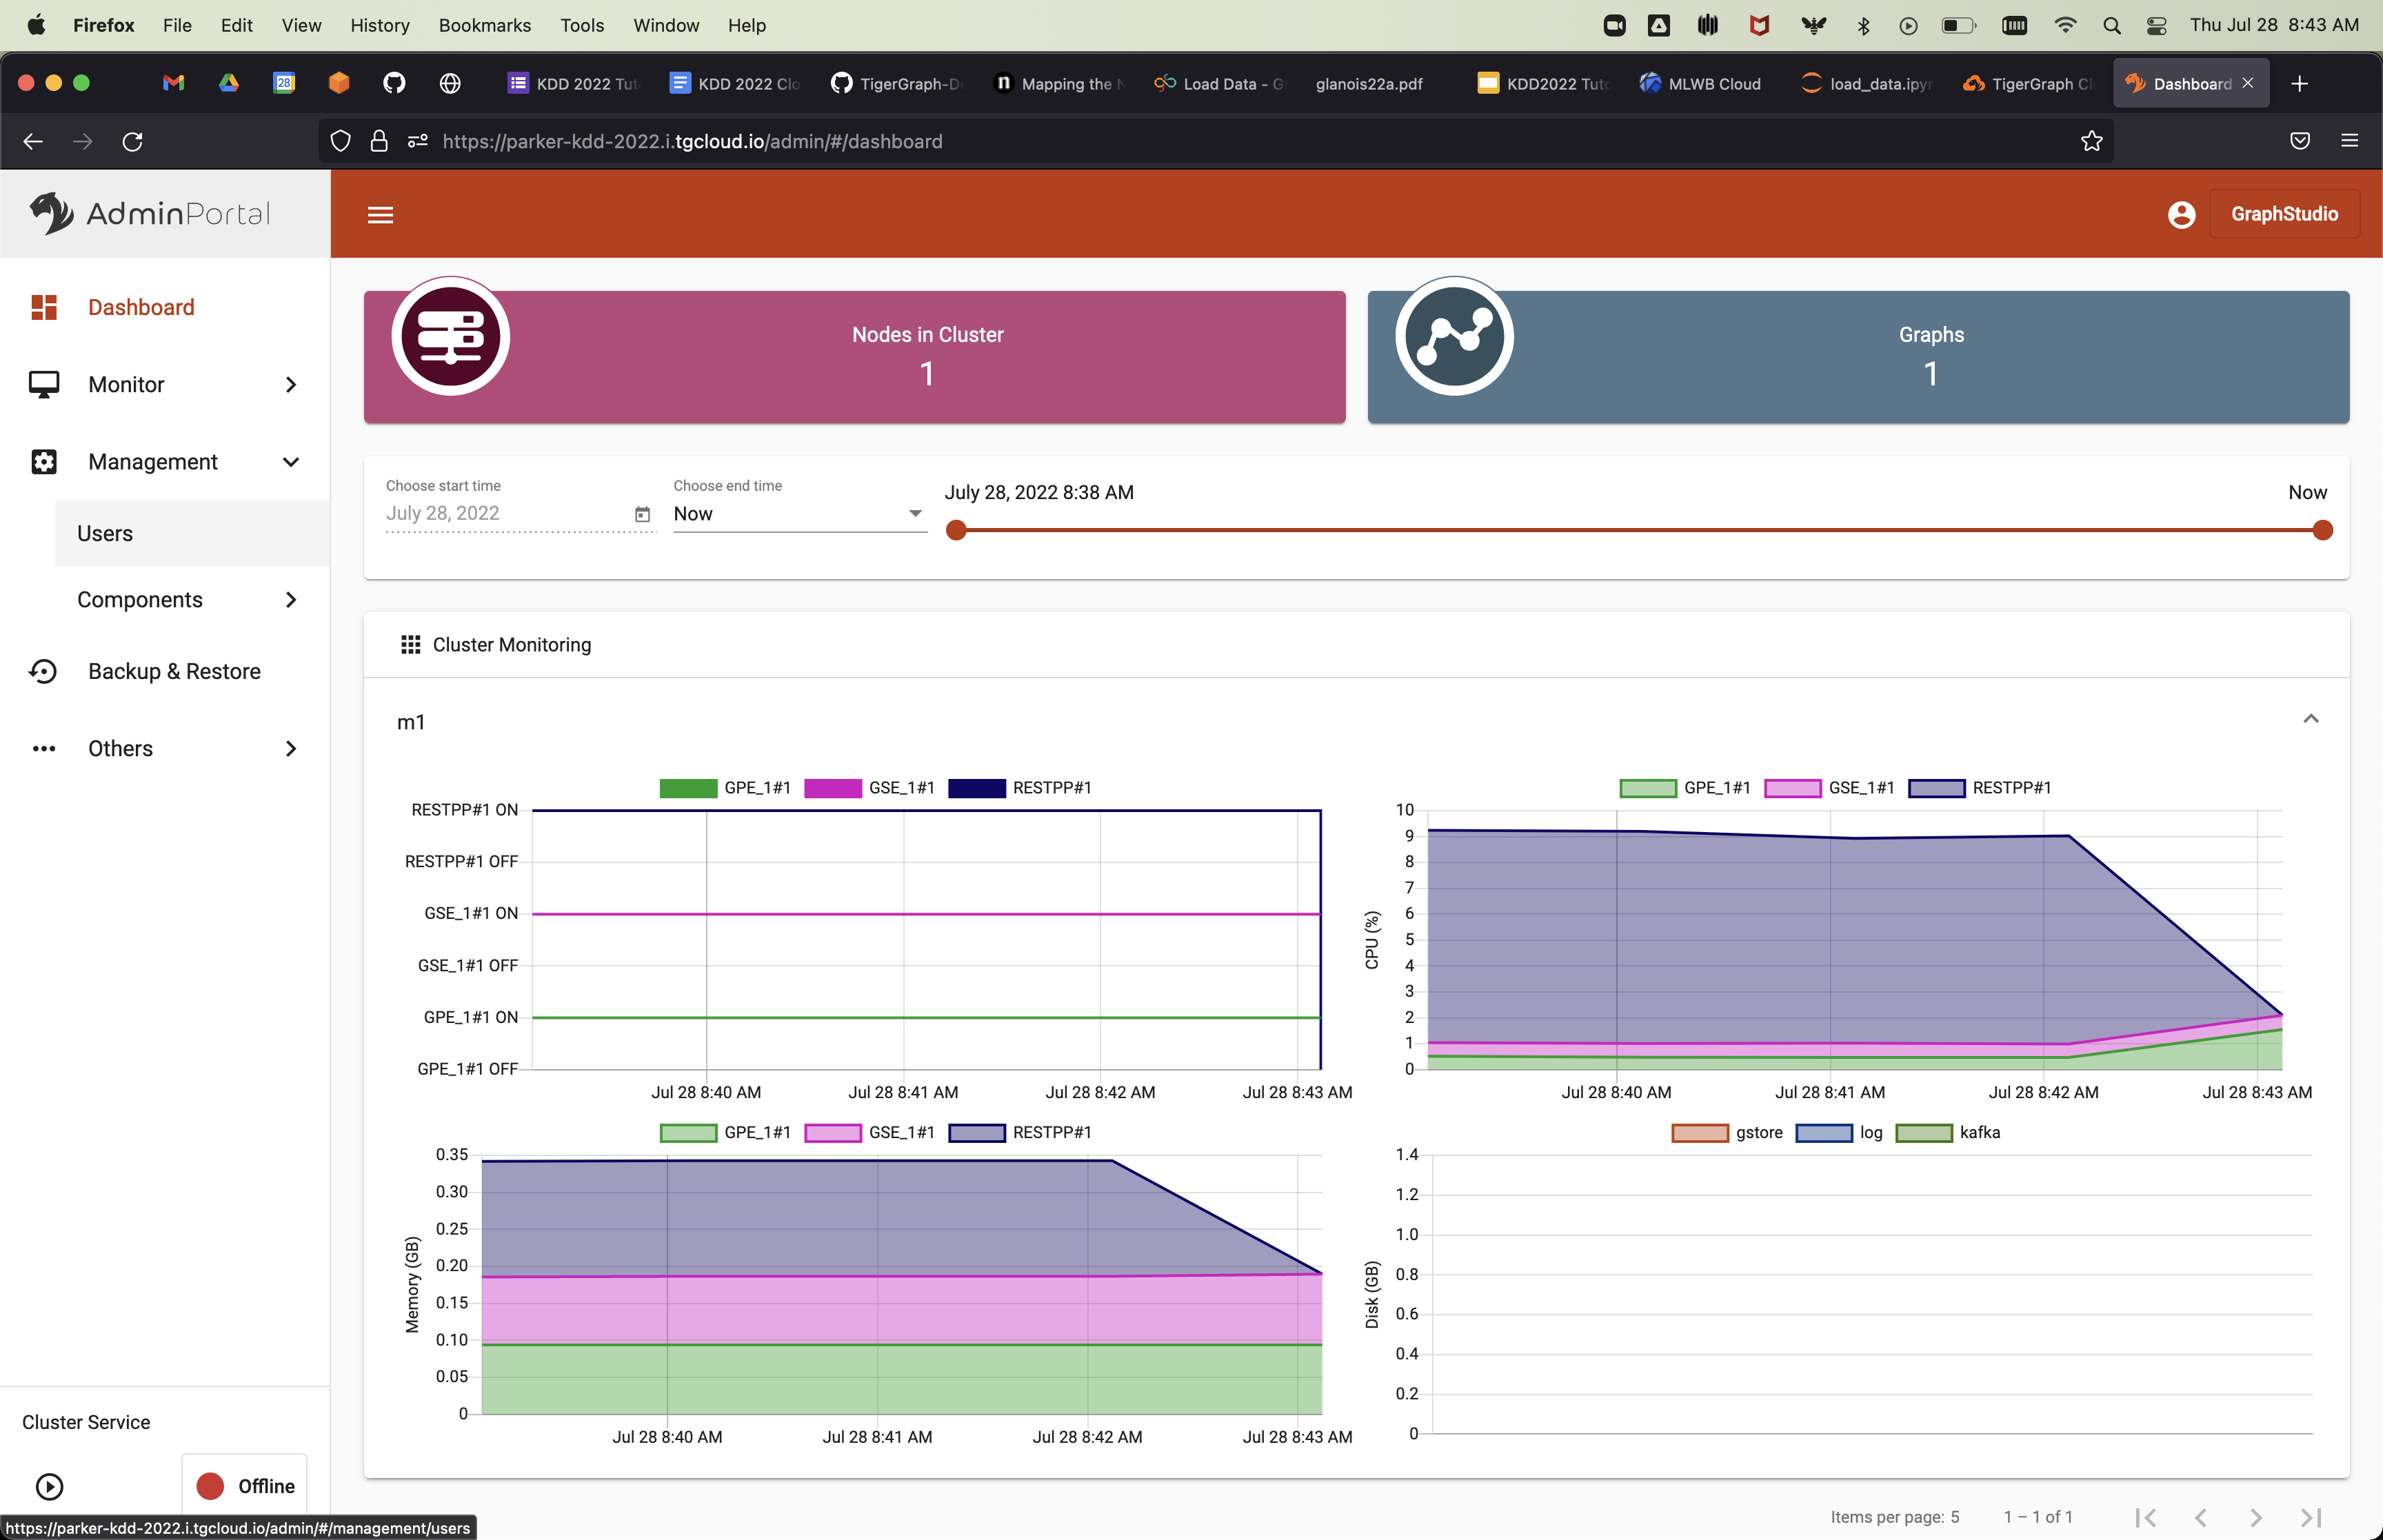
Once your graph is created, we can create a secret we will use for authentication with the database. From the previous screen, click on Admin Portal in the upper right corner. It will bring you to this screen:
Under the Management tab on the left hand menu bar, select Users. Here, you can create a secret. Define an alias and then click the + button:
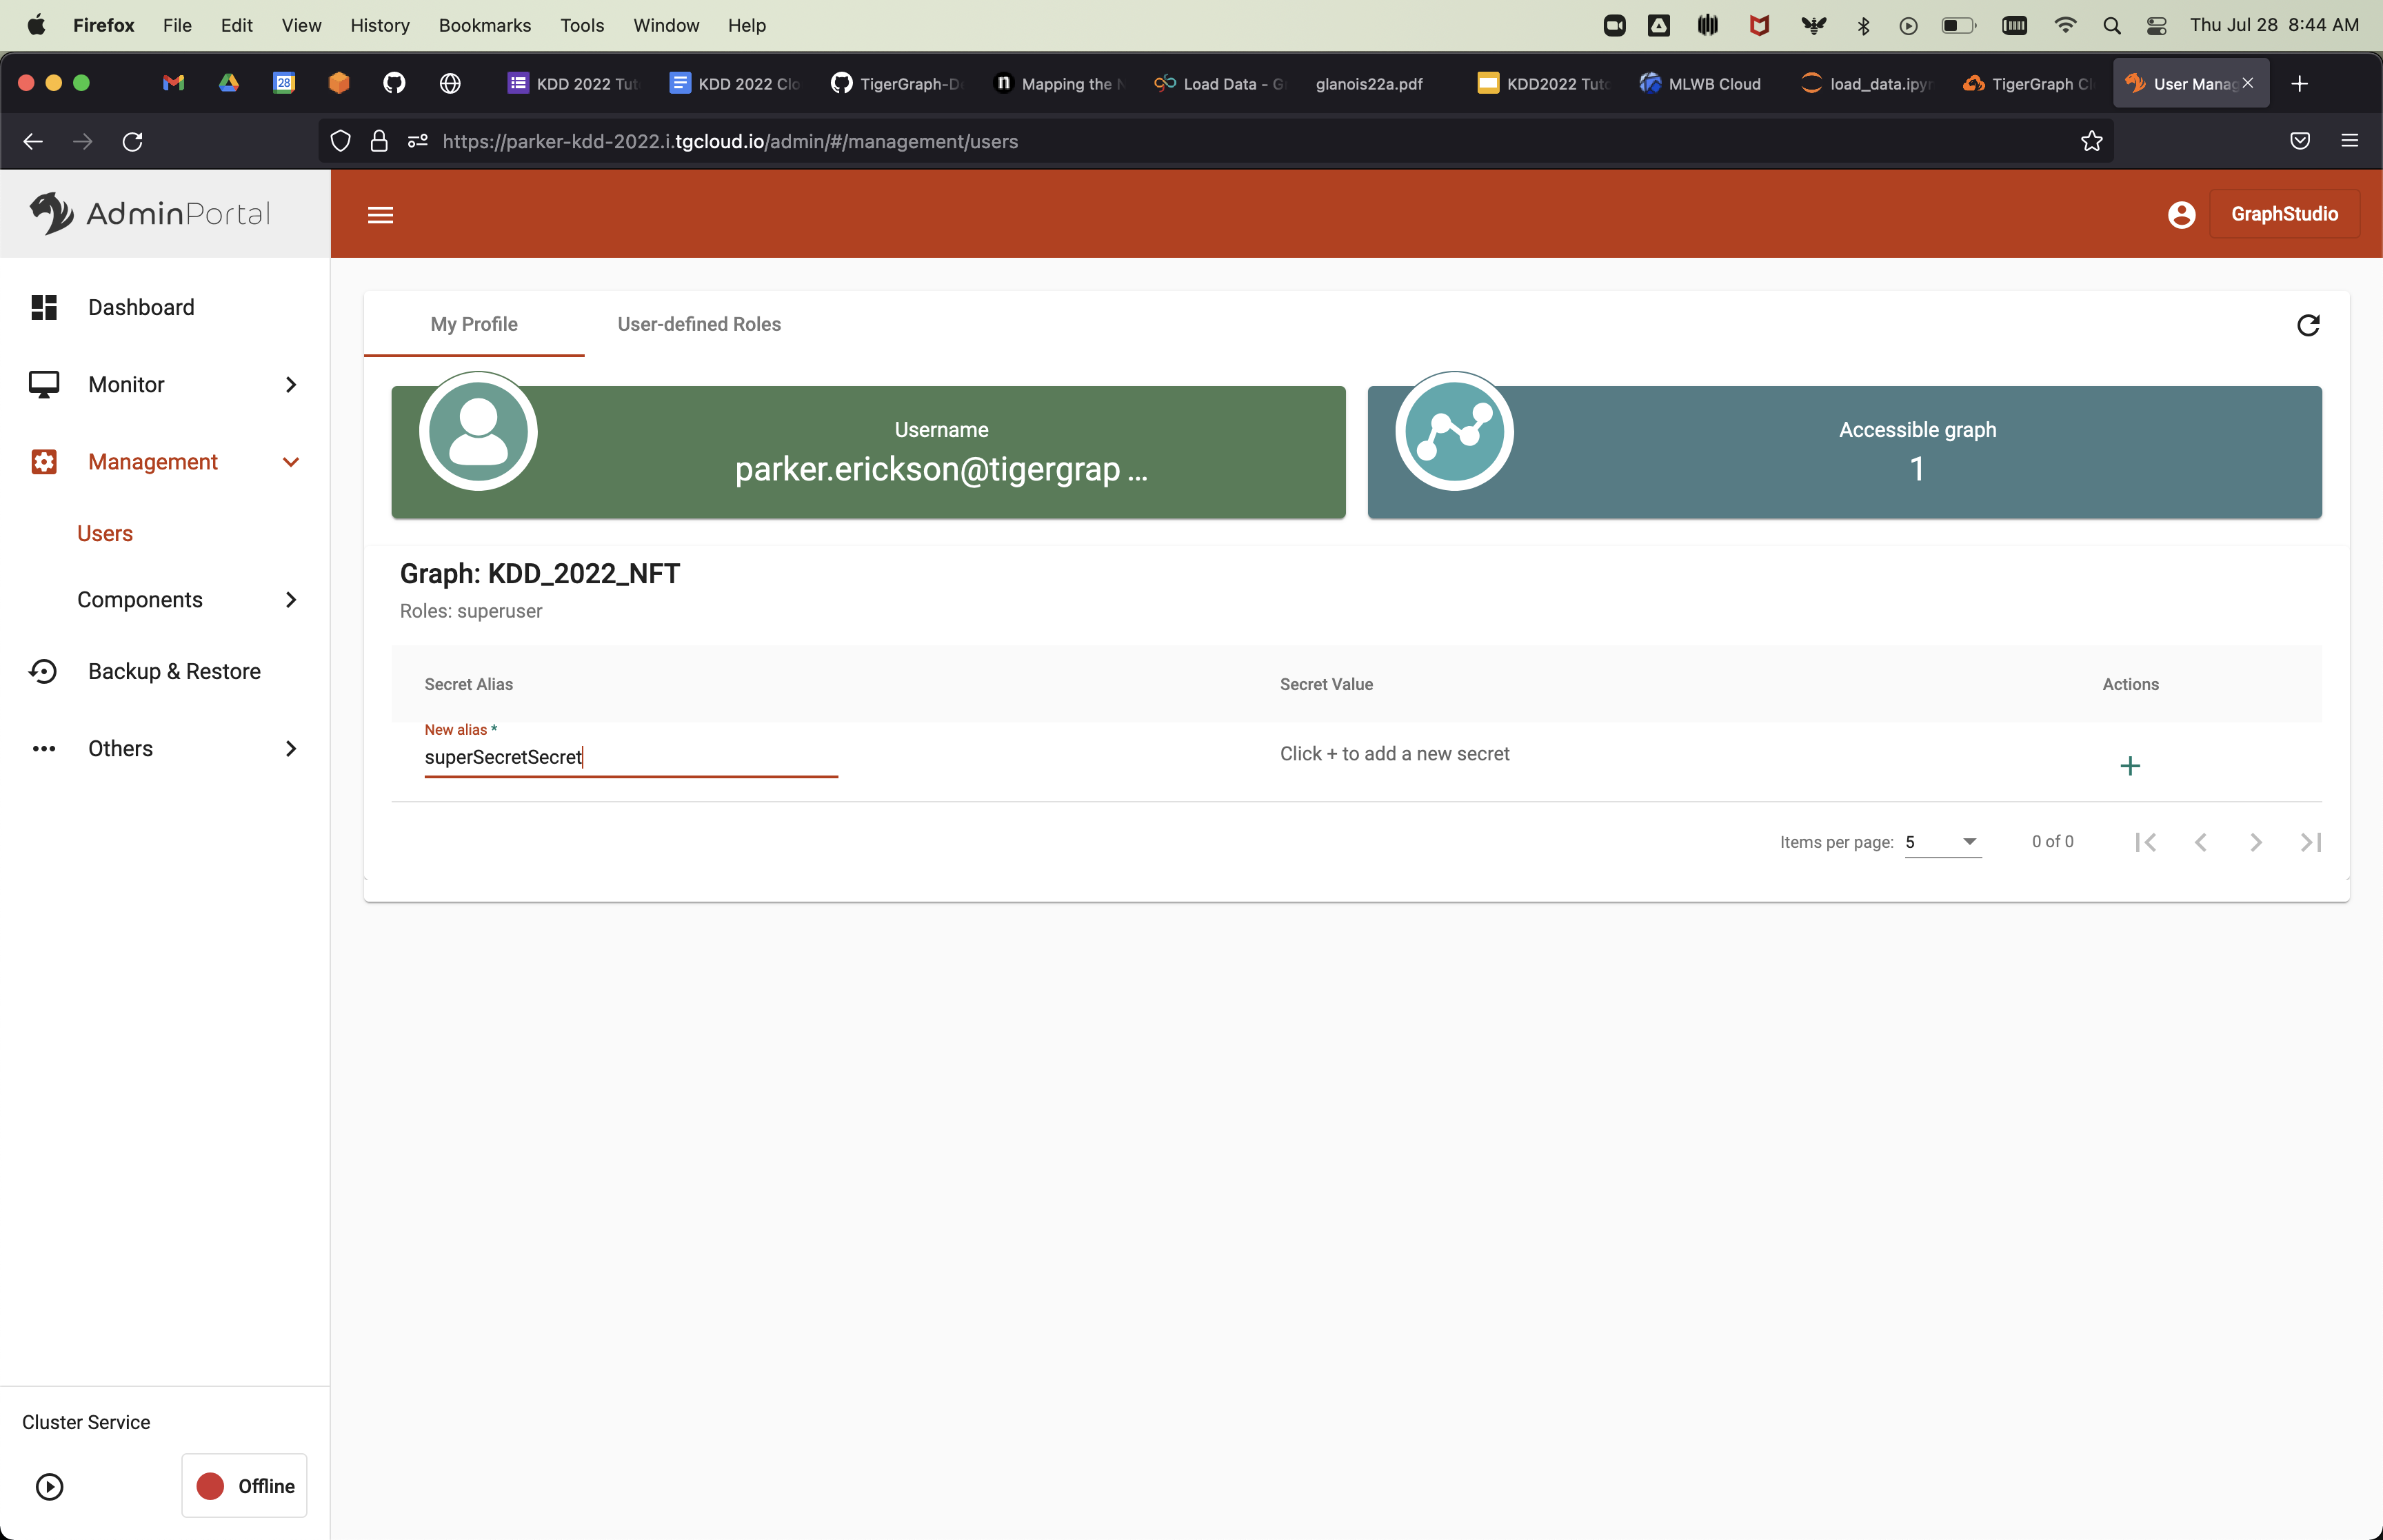
Make sure to copy the secret that is generated, as you will never see it again.
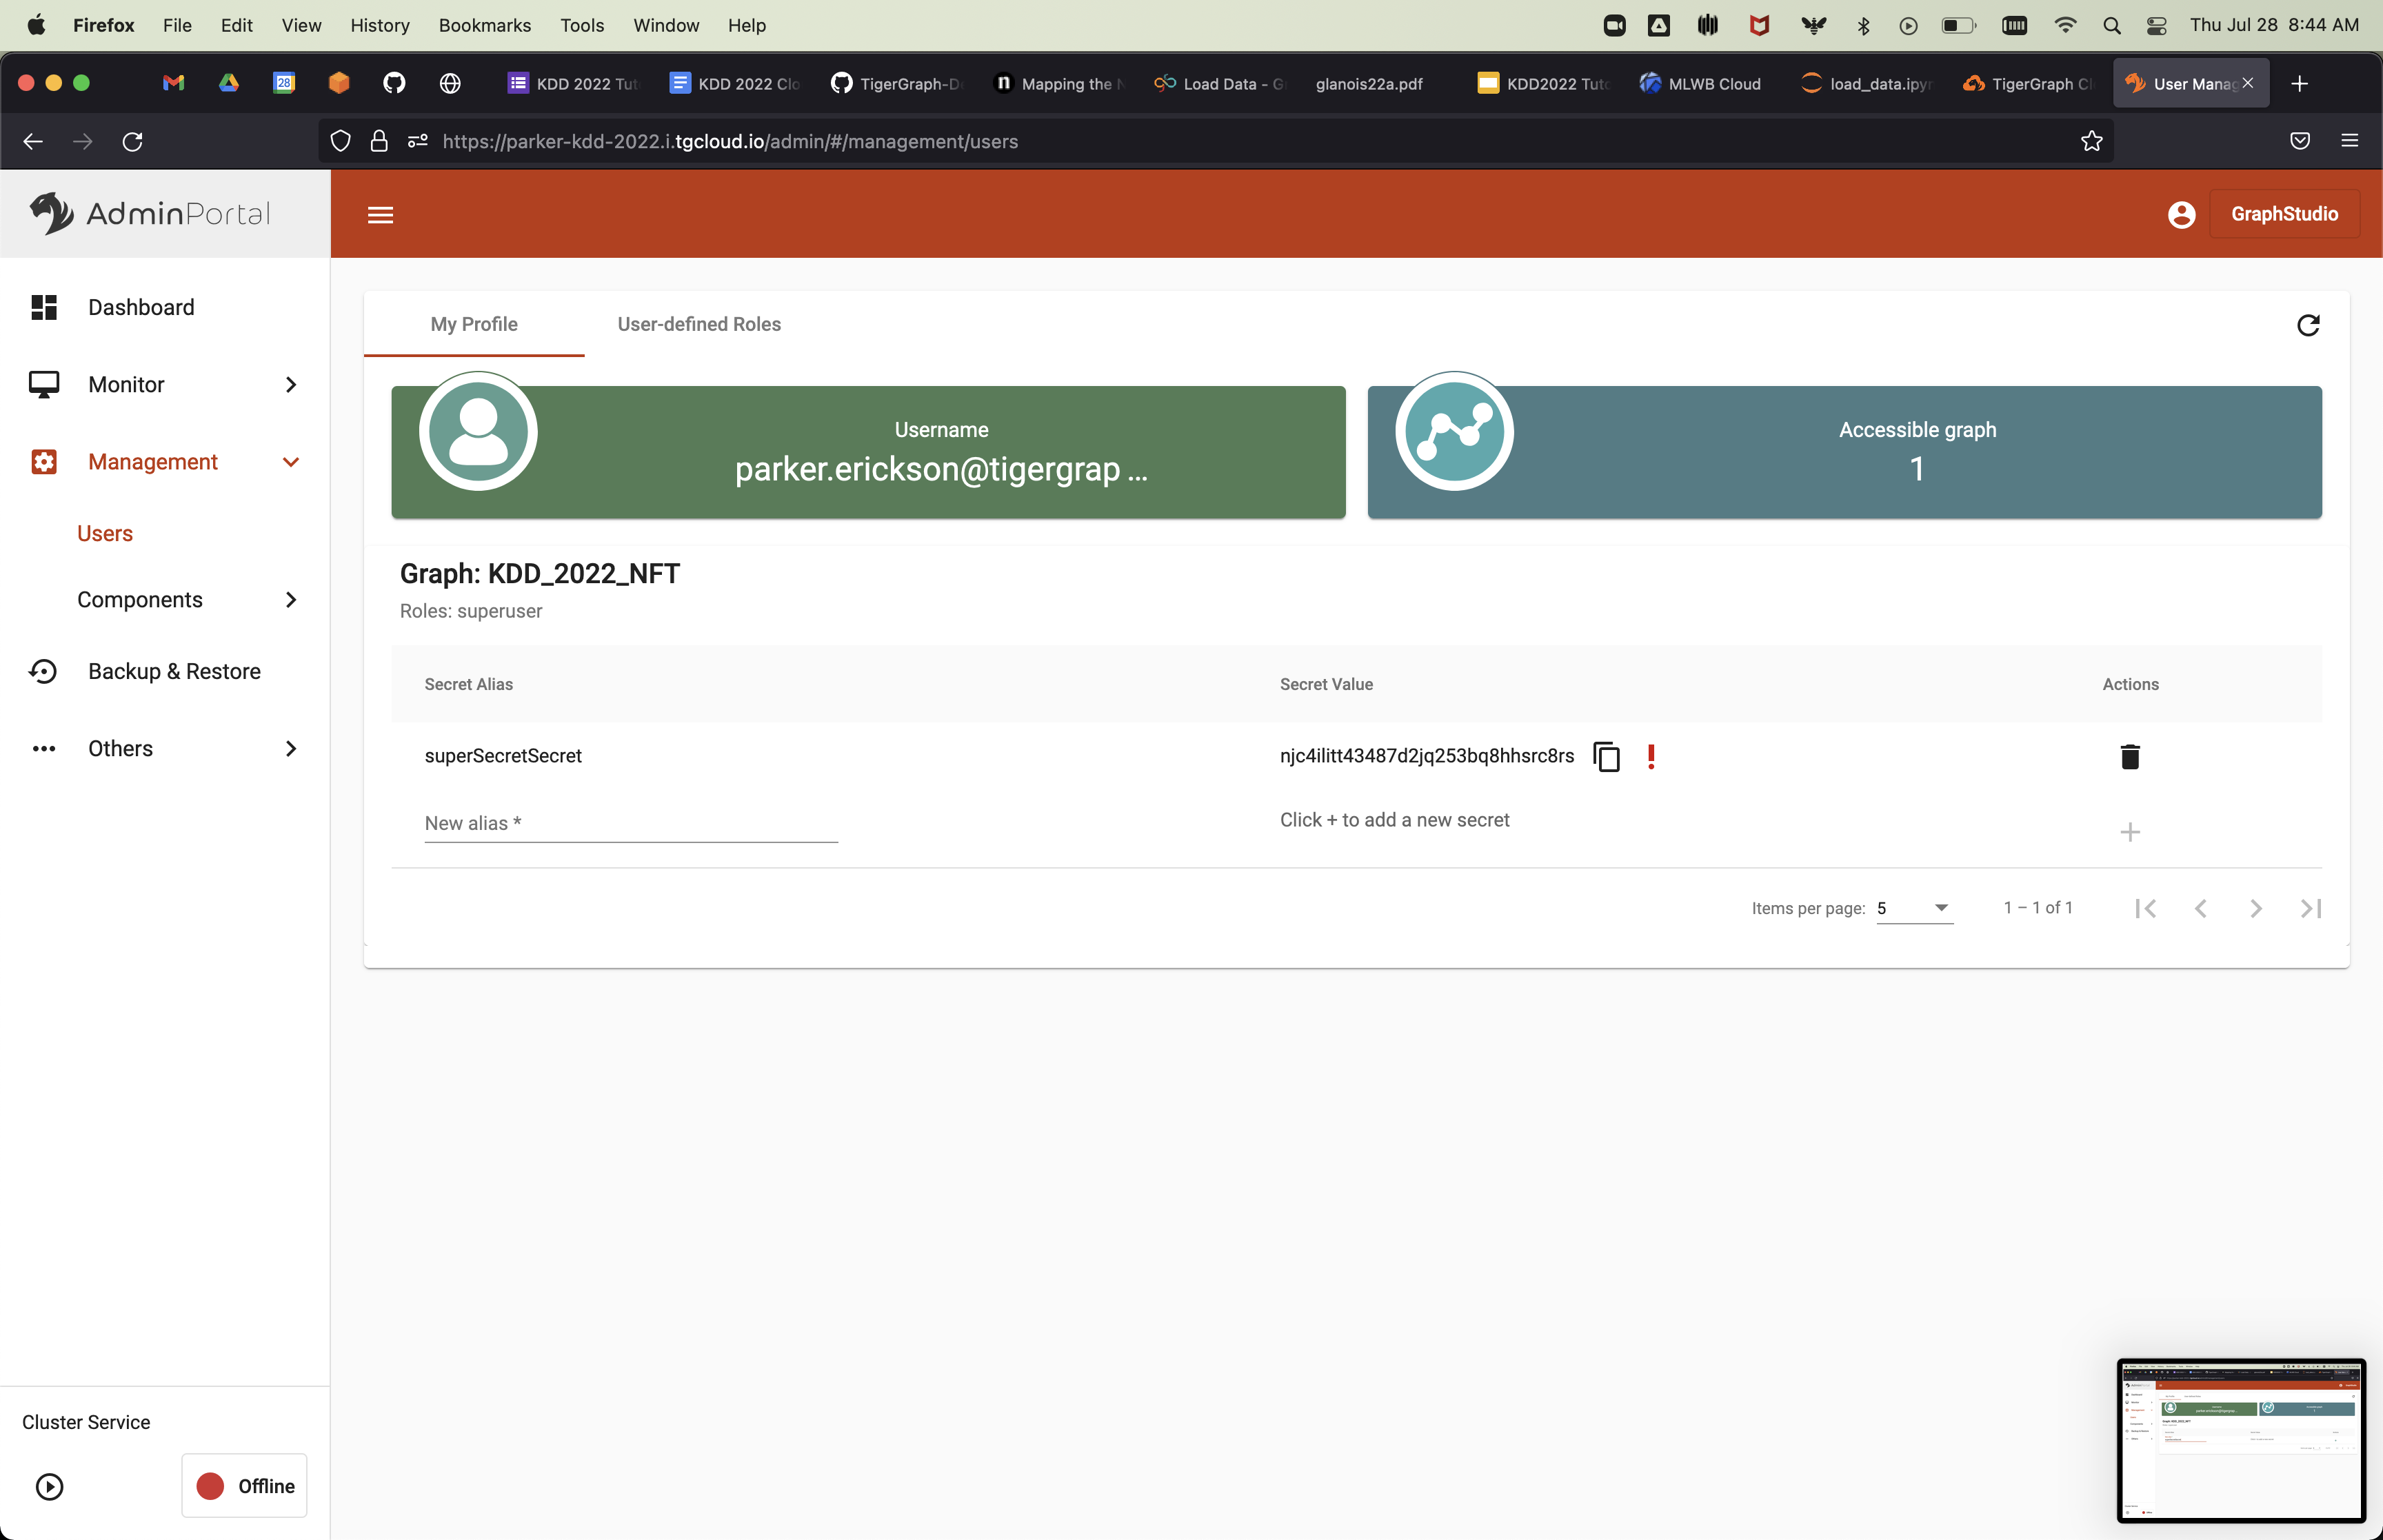
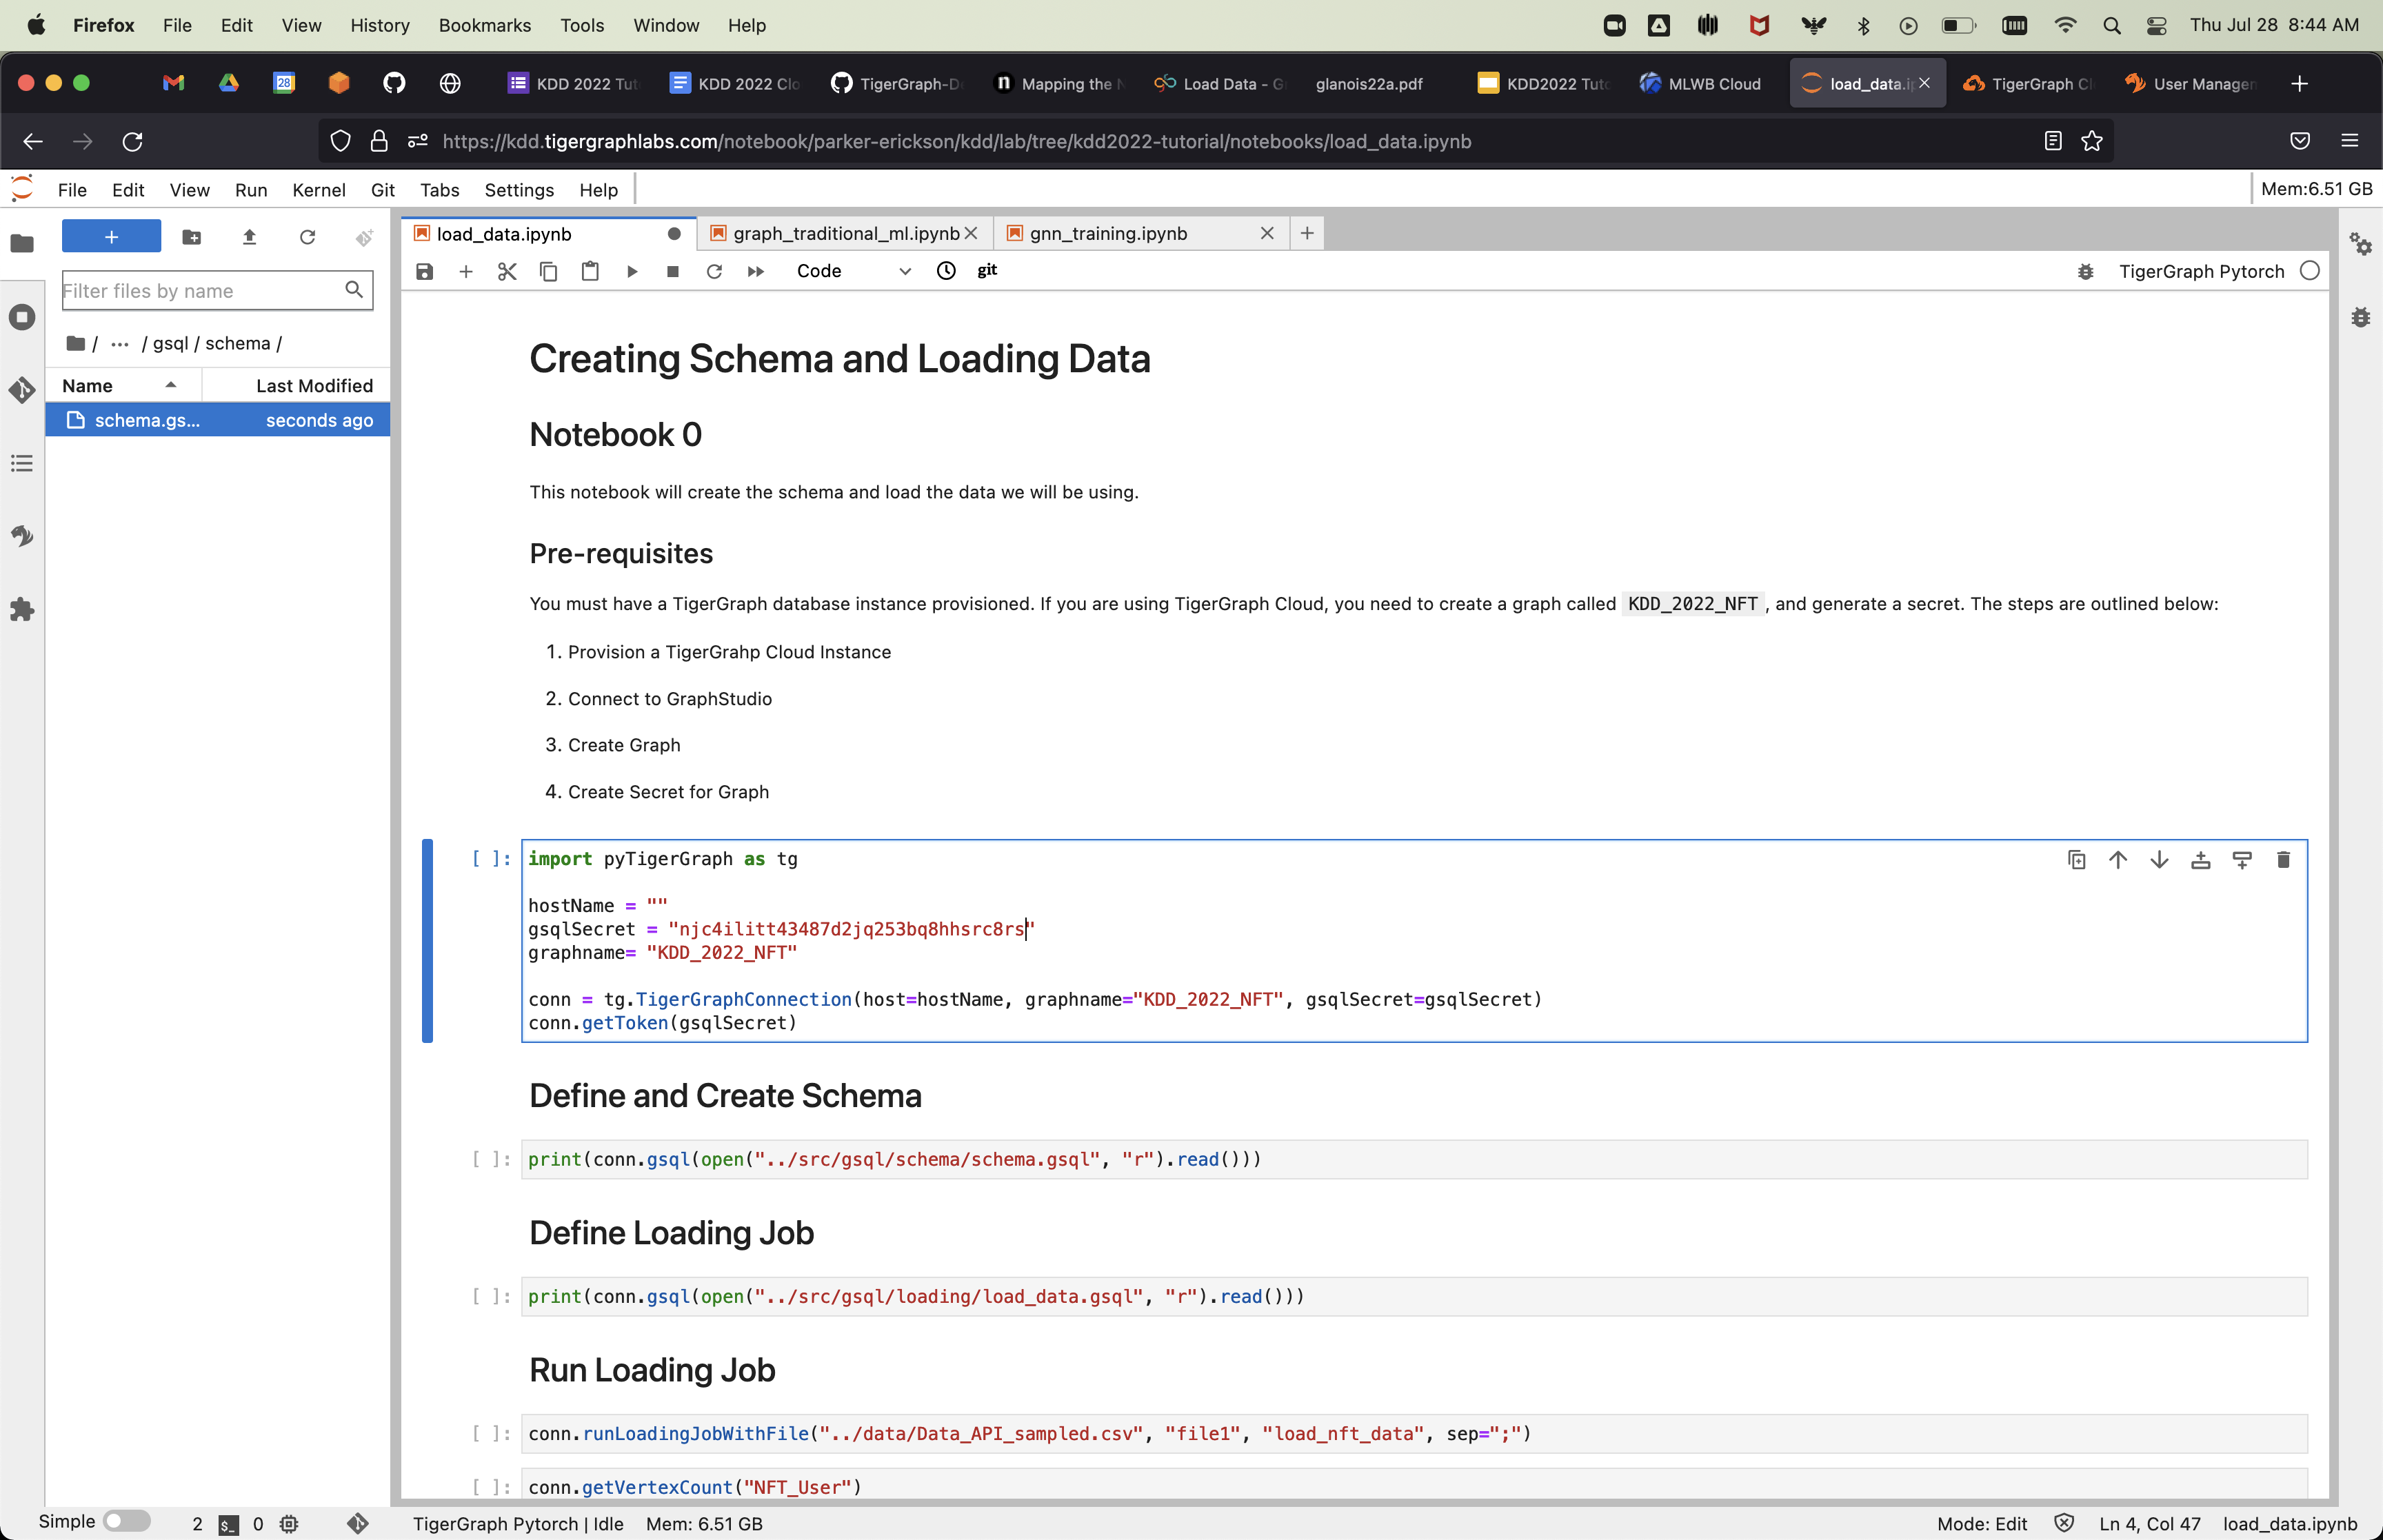
Finally, we can paste the secret into the notebook cell below:
We will use the ML Workbench to perform data analysis and machine learning on the graph data. To do this, we will provision a notebook server with 4 CPU cores and 16 GB of RAM. To start, view the Solutions page on TigerGraph Cloud:
In the upper left hand corner, click on the Tools tab. This will bring you to the following screen:
From there, click on the ML Workbench button:
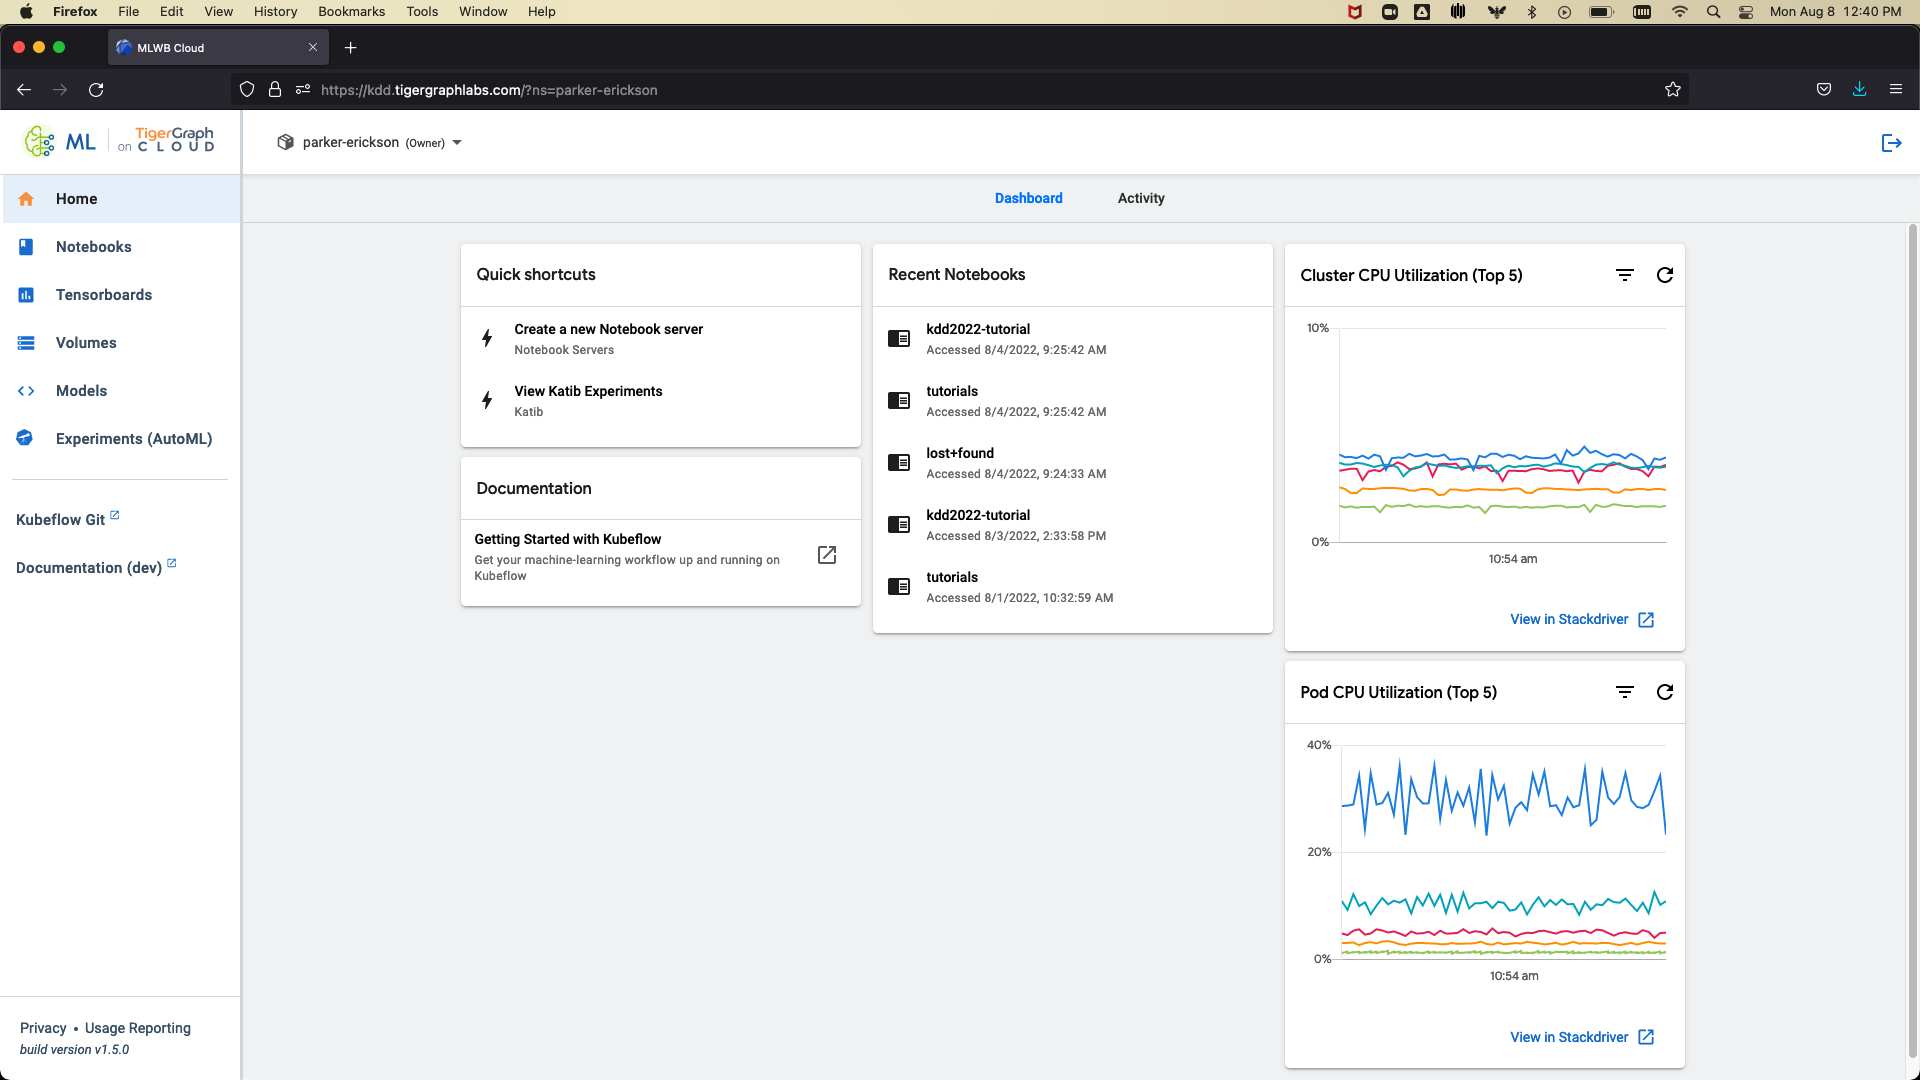
Once you are on the MLWB homepage, click on Notebooks in the left hand menu bar:
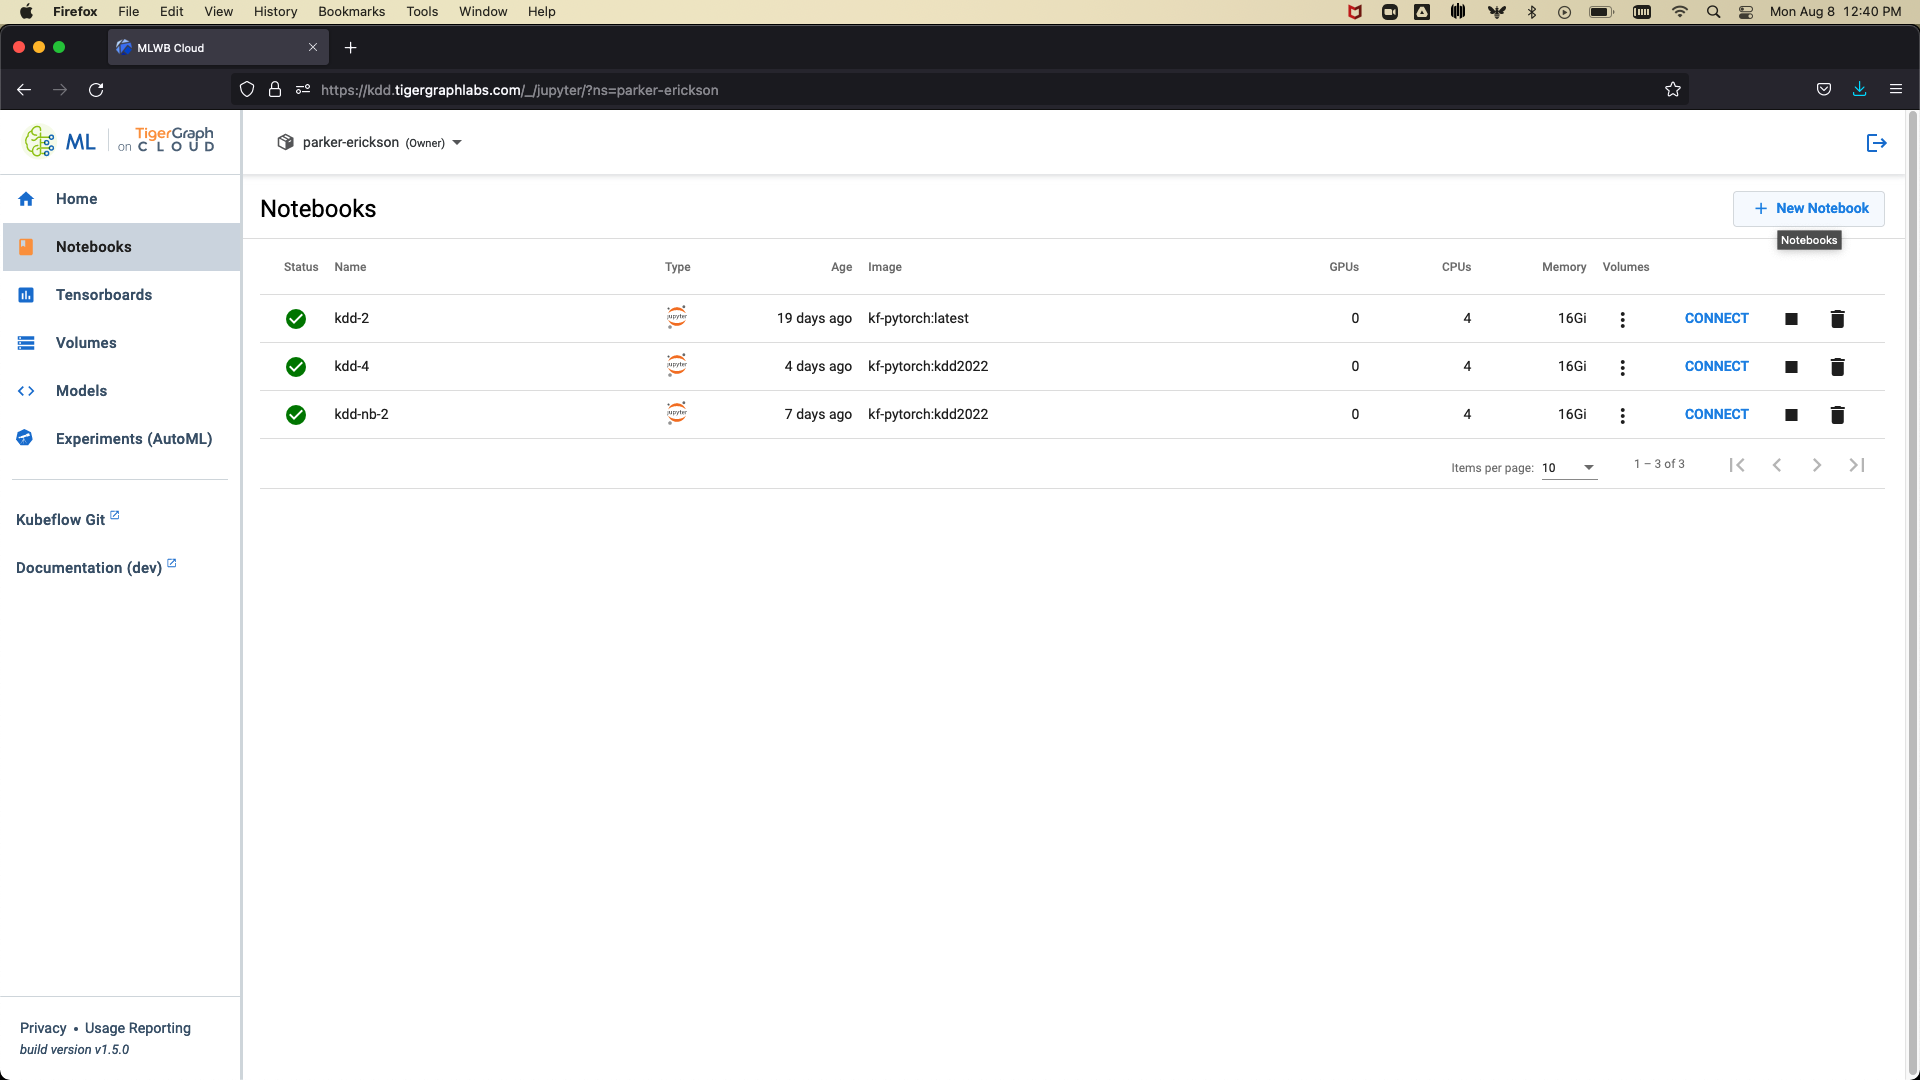
Click on the New Notebook button:
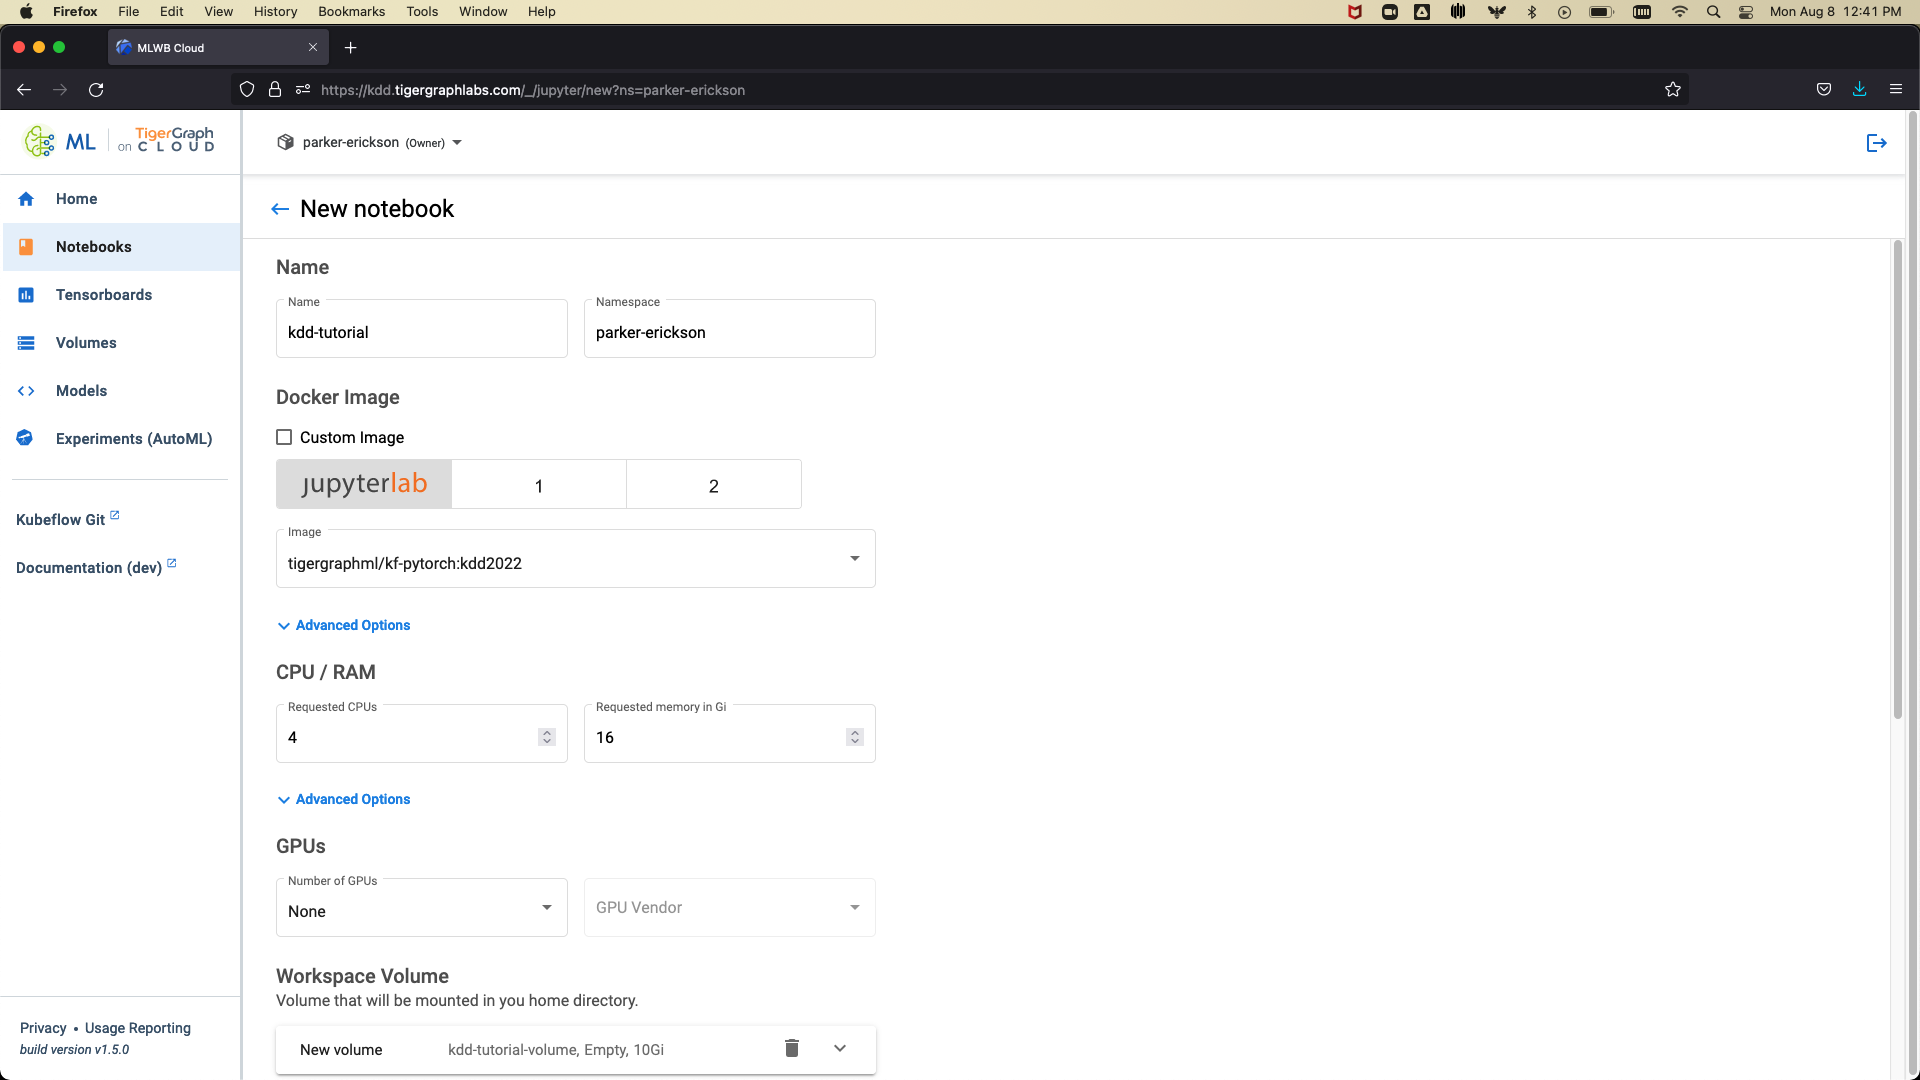
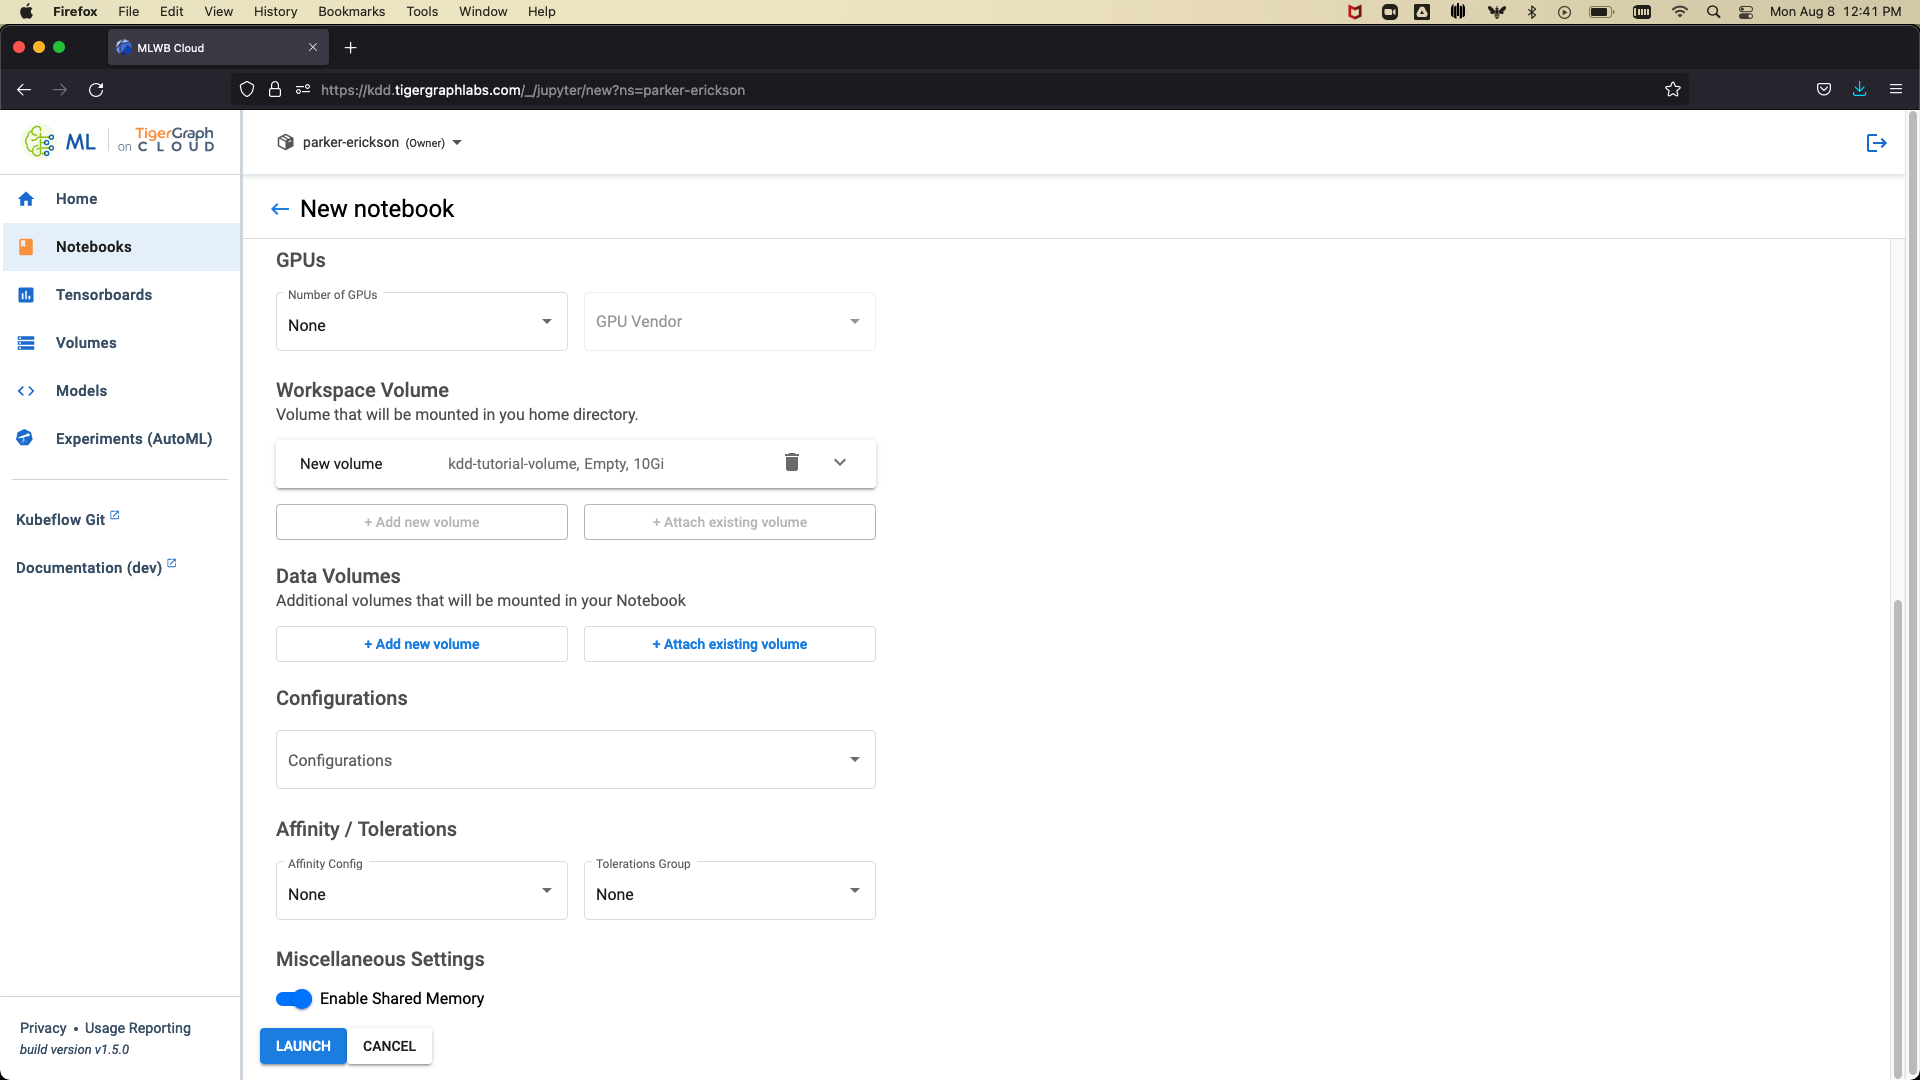
Name your notebook, select the tigergraphml/kf-pytorch:kdd2022 image, and use 4 CPU cores and 16 GB of RAM. Scroll to the bottom of the page and click Launch:
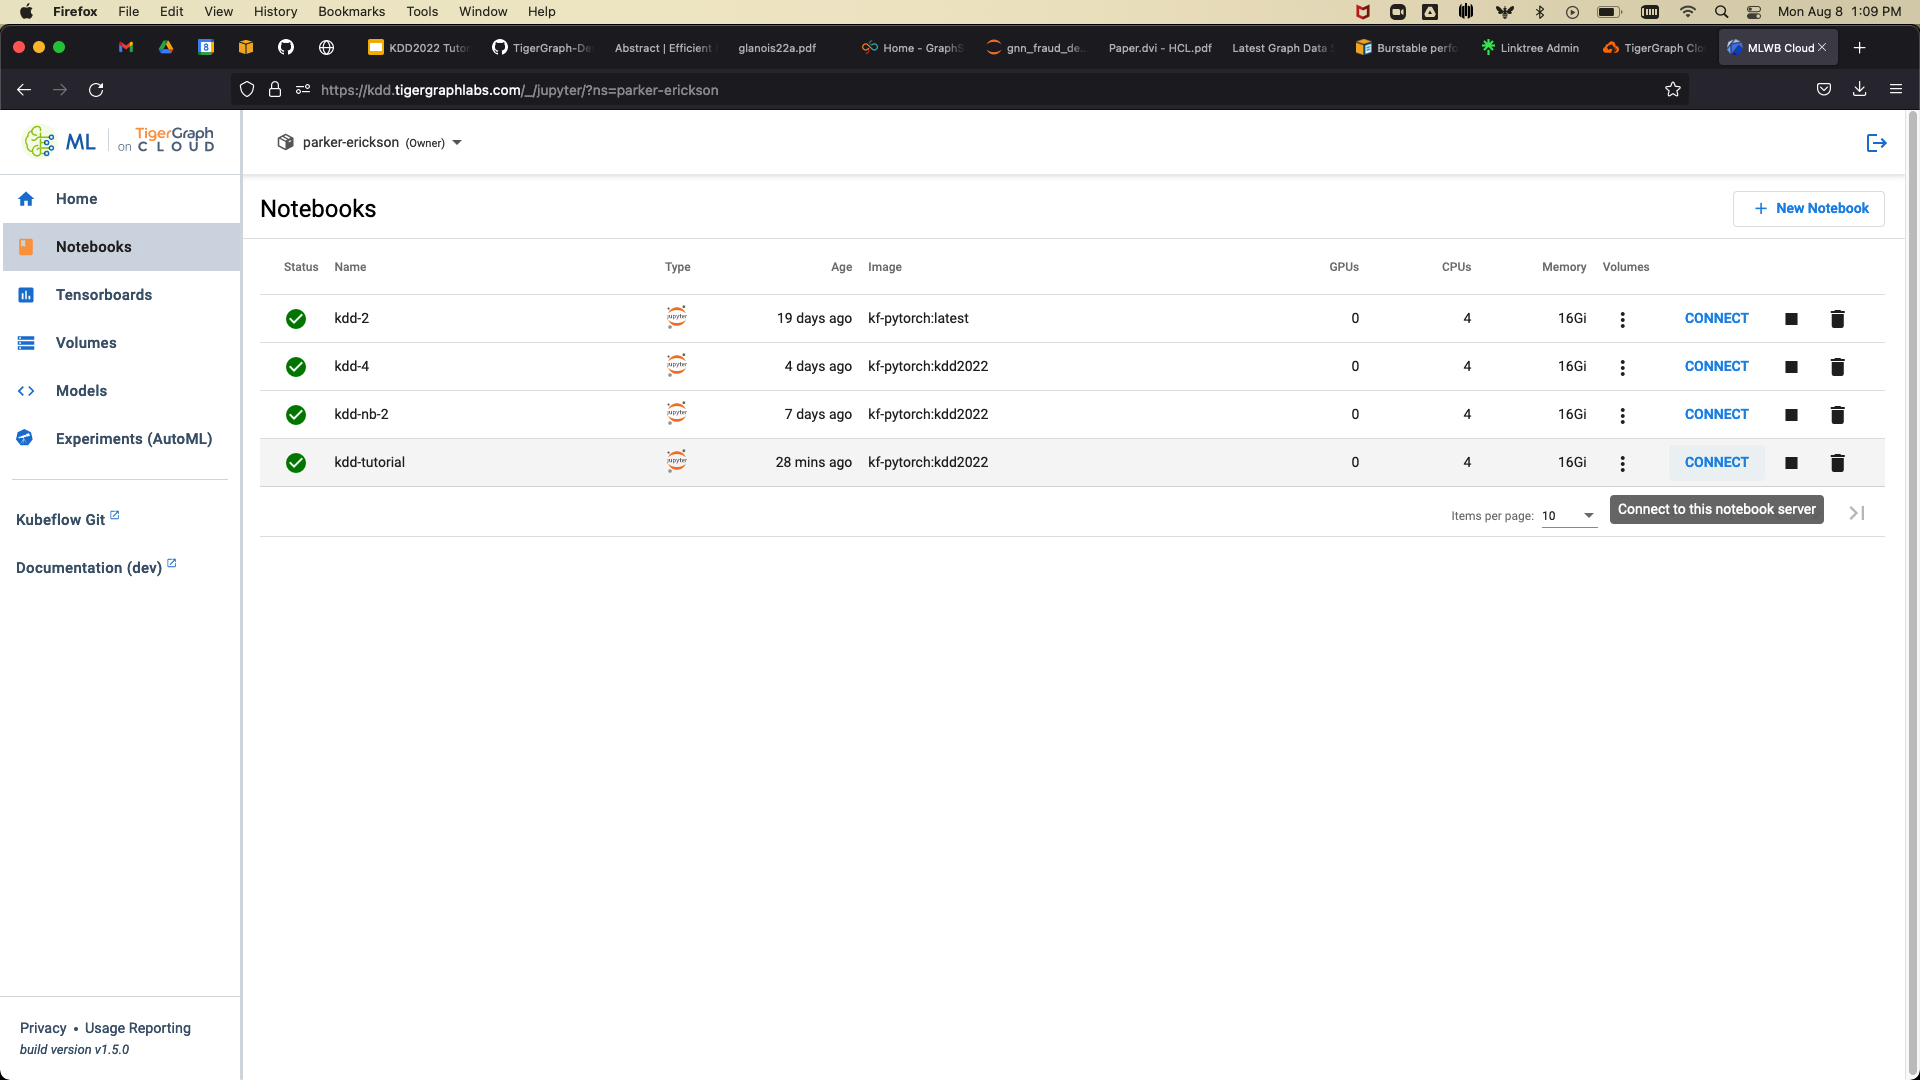
This will take you back to the MLWB notebooks homepage. Click on Connect to connect to the notebook server:
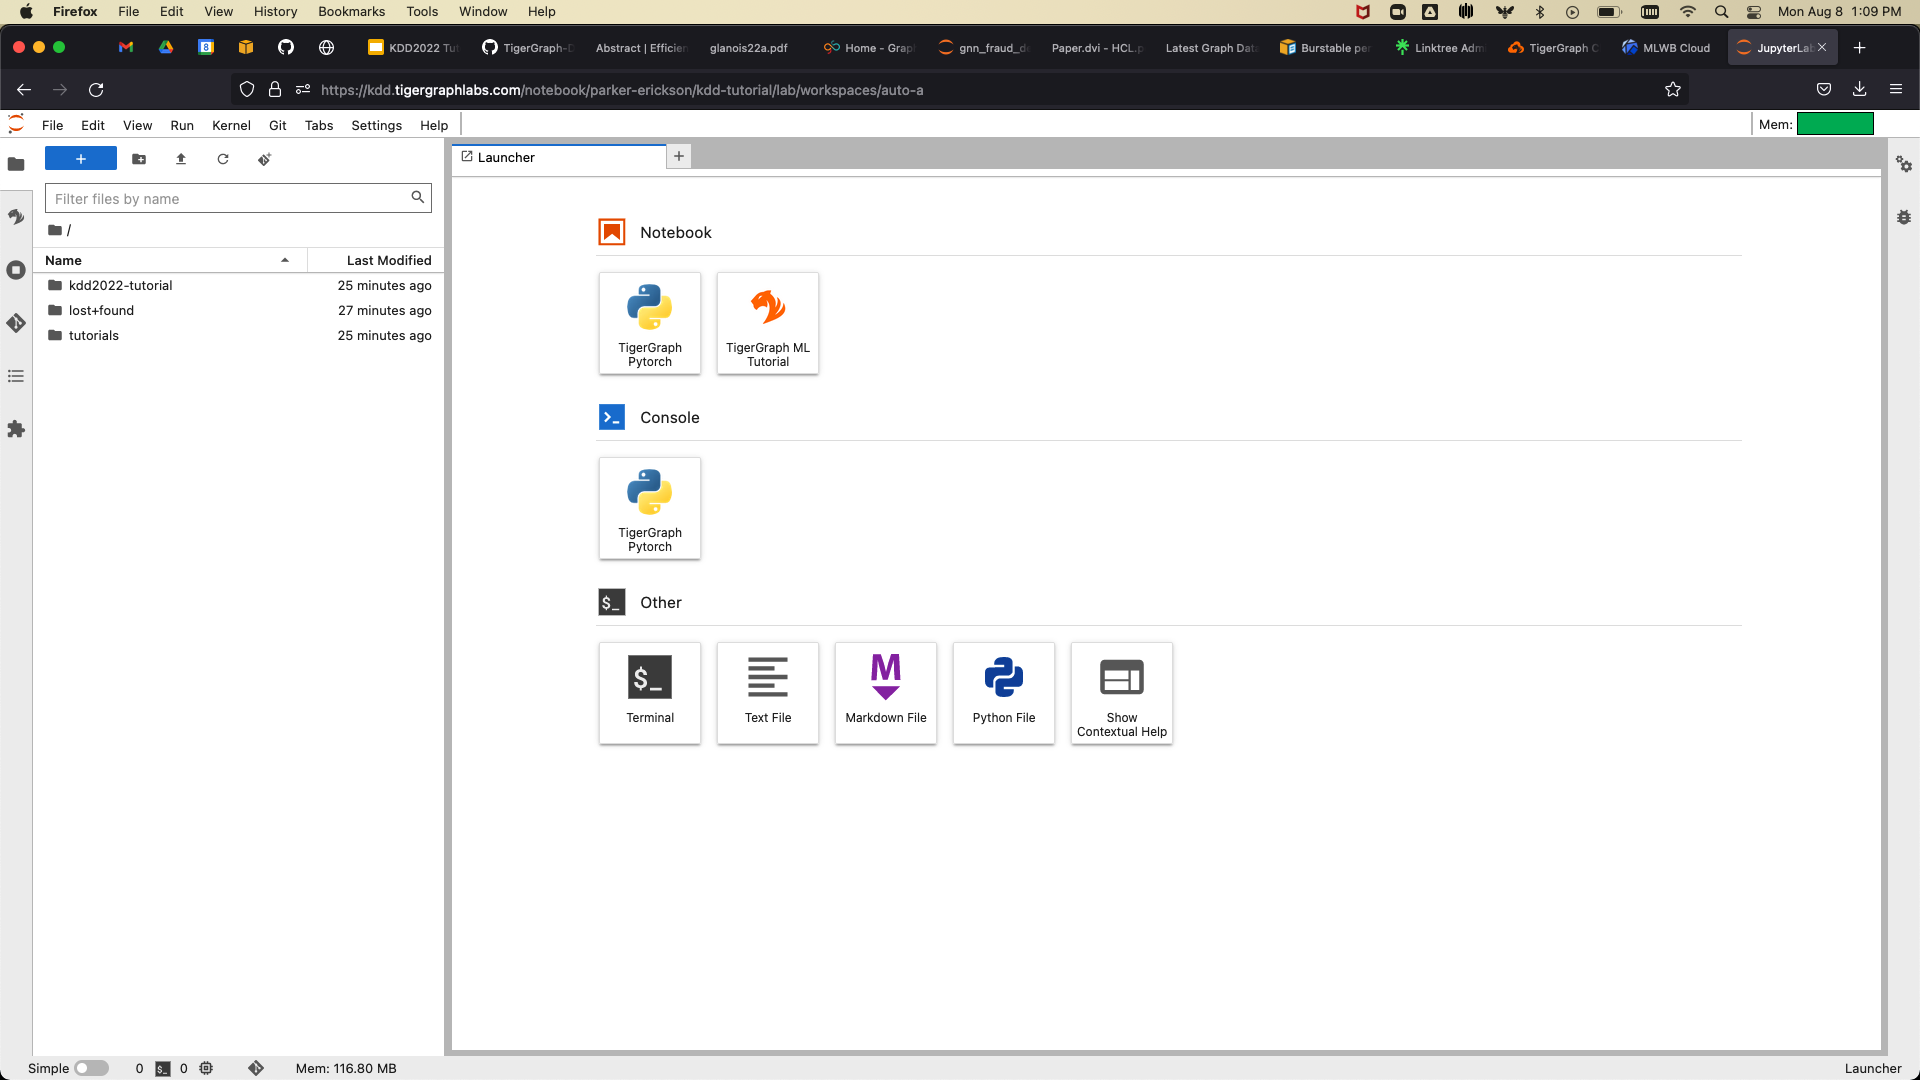
This will take you to the notebook homepage, seen here:
The code for this tutorial will be in the kdd2022-tutorial directory.
In this section, we will cover what TigerGraph is and its massively parallel processing architecture. The unique architecture allows TigerGraph to run highly-performant, distributed, and scalable graph data science algorithms. We will then load a dataset of transactions to TigerGraph Cloud and familiarize ourselves with the TigerGraph ML Workbench Cloud.
Algorithms such as Louvain community detection [1] have been very good at helping discover fraudulent transactions within financial interaction graphs. Maximal independent set has been used for non-conflicting routing problems. Cosine similarity of graph neighborhoods have been used in recommendation and classification tasks. In this section, we will cover some large classes of graph data science algorithms, such as community detection, centrality, and similarity that can be executed efficiently within the TigerGraph database. Using these algorithms, we will begin to analyze and perform exploratory data analysis on the NFT transaction dataset.
Combining traditional features as well as ones derived from the graph can be a powerful technique for improving the accuracy of machine learning algorithms without moving to graph neural networks. In this section, we will cover how to utilize the TigerGraph Graph Data Science Library and pyTigerGraph to enrich existing traditional machine learning models with graph data derived from algorithms like PageRank [7]. We will use the graph algorithms used in the section above to develop features for traditional machine learning algorithms such as XGBoost [2] to predict the selling price of NFTs in the network.
Graph Neural Network models have been exploding in popularity in recent years, yet there have not been great ways to store and query the data into subgraphs for training models such as GraphSAGE [5]. TigerGraph simplifies this process through our Machine Learning Workbench. Researchers and data scientists can now test new architectures on arbitrarily large datasets, using tools that they are already familiar with such as PyTorch Geometric and DGL. In this section, we will train and evaluate a Graph Neural Network with the NFT data stored in TigerGraph, incorporating both the visual feature data that describes the NFTs as well as the network information into our predictions.
Make sure to download your notebooks if you made any changes to them. The GitHub repository is always available to download the stock notebooks, found here. If you wish to load the data into your own TigerGraph instance, you can download the full data file here. Then, use the notebook initial_modelling.ipynb to process the data and downsample it if desired. By default, the data loading notebook uses the sampled data file.
There are many ways to get involved with TigerGraph. You can join the TigerGraph Community Forum to ask questions, share ideas, and more. We also have a community Discord Channel to chat with other TigerGraph users.
Two "Office Hour" sessions will be held after the tutorial. The first session will be held on August 22nd, 2022 at 10:00 AM Central Time. The second session will be held on August 24th, 2022 at 5:00 PM Central Time.
We will send out a survey to gather feedback from participants. Please fill out the survey and share your thoughts on the tutorial.
VP of Machine Learning and AI, TigerGraph
Victor wrote his Ph.D. dissertation on graph-based similarity and ranking. Dr. Lee has co-authored book chapters on decision trees and dense subgraph discovery. Teaching and training have also been central to his career journey, with activities ranging from developing training materials for chip design to writing the first version of TigerGraph’s technical documentation, from teaching 12 years as a full-time or part-time university instructor, to presenting numerous webinars and in-person workshops.
Machine Learning Engineer, TigerGraph
Parker received his M.S. of Computer Science from the University of Minnesota with a focus on machine learning in 2022. He is also the founding developer of pyTigerGraph, a Python package for interacting with TigerGraph databases. Formerly an intern at UnitedHealth Group, Parker worked on graph machine learning solutions for fraud detection, member similarity, training course recommendation, pharmacy formulary rules, and call center analytics.
Sr ML Architect and Manager, TigerGraph
Bill received his PhD in Applied Math with a research focus on complex networks. His work has been published in top academic journals and received coverage from widely circulated journals and news outlets, including Nature, The Guardian, The Los Angeles Times, and so on. Prior to joining TigerGraph, he led the Books Knowledge Graph initiative and graph machine learning research at Amazon and led the Social Network Analysis at Carolina program at UNC Chapel Hill. He has served as session organizer and chair for top academic conferences including NetSci 2017 and 2019, and Joint Mathematics Meetings 2018 and 2019. He also serves as a guest editor for the journals of Frontiers. He has taught various network analysis courses including one at datamatters.org and authored dozens of tutorials on data analysis for SAGE Research Methods.
Professor, Michigan State University
He was an associate professor from 2021 to 2022 and an assistant professor from 2016 to 2021 in the same department His research interests include data mining, machine learning and their applications in social media and education. He was the recipient of 2022 SDM IBM Early Career Data Mining Research Award, 2021 ICDM Tao Li Award, 2020 SIGKDD Rising Star Award, 2019 NSF Career Award, and 8 best paper awards (or runner-ups) including WSDM2018 and KDD2016. His dissertation won the 2015 KDD Best Dissertation runner up and Dean’s Dissertation Award. He serves as top data science conference organizers (e.g., KDD, SIGIR, WSDM, and SDM) and journal editors (e.g., TKDD and TKDE). He has published his research in highly ranked journals and top conference proceedings, which received more than 21,000 citations with h-index 69 and extensive media coverage
[1] Vincent D Blondel, Jean-Loup Guillaume, Renaud Lambiotte, and Etienne Lefebvre. 2008. Fast unfolding of communities in large networks. Journal of Statistical Mechanics: Theory and Experiment 2008, 10 (Oct 2008), P10008. https://doi.org/10.1088/1742-5468/2008/10/p10008
[2] Tianqi Chen and Carlos Guestrin.2016.XGBoost:AScalableTreeBoostingSystem. CoRR abs/1603.02754 (2016). arXiv:1603.02754 http://arxiv.org/abs/1603.02754
[3] Alin Deutsch, Yu Xu, Mingxi Wu, and Victor E. Lee. 2019. TigerGraph: A Native MPP Graph Database. CoRR abs/1901.08248 (2019). arXiv:1901.08248 http://arxiv.org/abs/1901.08248
[4] Matthias Fey and Jan Eric Lenssen. 2019. Fast Graph Representation Learning with PyTorch Geometric. CoRR abs/1903.02428 (2019). arXiv:1903.02428 http://arxiv.org/abs/1903.02428
[5] William L. Hamilton, Rex Ying, and Jure Leskovec. 2017. Inductive Representation Learning on Large Graphs. CoRR abs/1706.02216 (2017). arXiv:1706.02216 http://arxiv.org/abs/1706.02216
[6] Matthieu Nadini, Laura Alessandretti, Flavio Di Giacinto, Mauro Martino, Luca Maria Aiello, and Andrea Baronchelli. 2021. Mapping the NFT revolution: market trends, trade networks, and visual features. Scientific Reports 11, 1 (Oct 2021). https://doi.org/10.1038/s41598-021-00053-8
[7] Lawrence Page, Sergey Brin, Rajeev Motwani, and Terry Winograd. 1999. The PageRank Citation Ranking: Bringing Order to the Web. Technical Report 1999-66. Stanford InfoLab. http://ilpubs.stanford.edu:8090/422/ Previous number = SIDL-WP-1999-0120.
[8] Minjie Wang, Lingfan Yu, Da Zheng, Quan Gan, Yu Gai, Zihao Ye, Mufei Li, Jinjing Zhou, Qi Huang, Chao Ma, Ziyue Huang, Qipeng Guo, Hao Zhang, Haibin Lin, Junbo Zhao, Jinyang Li, Alexander J. Smola, and Zheng Zhang. 2019. Deep Graph Library: Towards Efficient and Scalable Deep Learning on Graphs. CoRR abs/1909.01315 (2019). arXiv:1909.01315 http://arxiv.org/abs/1909.01315
