- Challenge Summary
- Details of Implementation
- Building the Twitter Hashtag Graph
- Modifying the Twitter Hashtag Graph with Incoming Tweet
- Maintaining Data within the 60 Second Window
- Dealing with tweets which arrive out of order in time
- Collecting tweets from the Twitter API
- Writing clean, scalable, and well-tested code
- Testing your directory structure and output format
- FAQ
For this coding challenge, you will develop tools that could help analyze the community of Twitter users. Some of the challenges here mimic real world problems.
This challenge requires you to:
Calculate the average degree of a vertex in a Twitter hashtag graph for the last 60 seconds, and update this each time a new tweet appears. You will thus be calculating the average degree over a 60-second sliding window.
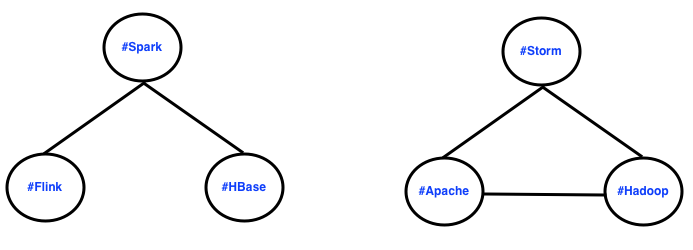
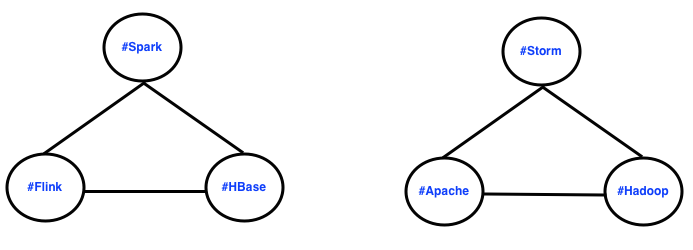
To clarify, a Twitter hashtag graph is a graph connecting all the hashtags that have been mentioned together in a single tweet. Examples of Twitter hashtags graphs are below.
We'd like you to implement your own version of this. However, we don't want this challenge to focus on the relatively uninteresting "dev ops" of connecting to the Twitter API, which can be complicated for some users. Normally, tweets can be obtained through Twitter's API in JSON format, but you may assume that this has already been done and written to a file named tweets.txt inside a directory named tweet_input.
This file tweets.txt will contain the actual JSON messages (and the messages emitted by the API about the connection and rate limits, which need to be properly removed from calculations). tweets.txt will have the content of each tweet on a newline:
tweets.txt:
{JSON of first tweet}
{JSON of second tweet}
{JSON of third tweet}
.
.
.
{JSON of last tweet}
One example of the data for a single Tweet might look like:
{"created_at":"Fri Oct 30 15:29:45 +0000 2015","id":660116384450347008,
"id_str":"660116384450347008","text":"We're #hiring! Click to apply: SMB Analyst - https:\/\/t.co\/lAy8j01BkE #BusinessMgmt #NettempsJobs #MenloPark, CA #Job #Jobs #CareerArc",
"source":"\u003ca href=\"http:\/\/www.tweetmyjobs.com\" rel=\"nofollow\"\u003eTweetMyJOBS\u003c\/a\u003e","truncated":false,"in_reply_to_status_id":null,"in_reply_to_status_id_str":null,"in_reply_to_user_id":null,
"in_reply_to_user_id_str":null,"in_reply_to_screen_name":null,"user":{"id":24315640,"id_str":"24315640","name":"TMJ-SJC Mgmt. Jobs","screen_name":"tmj_sjc_mgmt","location":"San Jose, CA","url":"http:\/\/tweetmyjobs.com",
"description":"Follow this account for geo-targeted Business\/Mgmt. job tweets in San Jose, CA from TweetMyJobs. Need help? Tweet us at @TweetMyJobs!","protected":false,"verified":false,"followers_count":389,
"friends_count":256,"listed_count":23,"favourites_count":0,"statuses_count":422,"created_at":"Sat Mar 14 02:57:56 +0000 2009","utc_offset":-14400,"time_zone":"Eastern Time (US & Canada)",
"geo_enabled":true,"lang":"en","contributors_enabled":false,"is_translator":false,"profile_background_color":"253956",
"profile_background_image_url":"http:\/\/pbs.twimg.com\/profile_background_images\/315515499\/Twitter-BG_2_bg-image.jpg",
"profile_background_image_url_https":"https:\/\/pbs.twimg.com\/profile_background_images\/315515499\/Twitter-BG_2_bg-image.jpg","profile_background_tile":false,"profile_link_color":"96BEDF",
"profile_sidebar_border_color":"000000","profile_sidebar_fill_color":"407DB0","profile_text_color":"000000",
"profile_use_background_image":true,"profile_image_url":"http:\/\/pbs.twimg.com\/profile_images\/2303732039\/Logo_tmj_new2b_normal.png",
"profile_image_url_https":"https:\/\/pbs.twimg.com\/profile_images\/2303732039\/Logo_tmj_new2b_normal.png","profile_banner_url":"https:\/\/pbs.twimg.com\/profile_banners\/24315640\/1349361844",
"default_profile":false,"default_profile_image":false,"following":null,"follow_request_sent":null,"notifications":null},"geo":{"type":"Point","coordinates":[37.4484914,-122.1802812]},"coordinates":{"type":"Point","coordinates":[-122.1802812,37.4484914]},"place":{"id":"490bdb082950484f",
"url":"https:\/\/api.twitter.com\/1.1\/geo\/id\/490bdb082950484f.json","place_type":"city","name":"Menlo Park","full_name":"Menlo Park, CA",
"country_code":"US","country":"United States","bounding_box":{"type":"Polygon","coordinates":[[[-122.228635,37.416515],[-122.228635,37.507328],[-122.120415,37.507328],[-122.120415,37.416515]]]},
"attributes":{}},"contributors":null,"is_quote_status":false,"retweet_count":0,"favorite_count":0,
"entities":{"hashtags":[{"text":"hiring","indices":[6,13]},{"text":"BusinessMgmt","indices":[69,82]},{"text":"NettempsJobs","indices":[83,96]},{"text":"MenloPark","indices":[97,107]},
{"text":"Job","indices":[112,116]},{"text":"Jobs","indices":[117,122]},{"text":"CareerArc","indices":[123,133]}],"urls":[{"url":"https:\/\/t.co\/lAy8j01BkE",
"expanded_url":"http:\/\/bit.ly\/1XEF1ja","display_url":"bit.ly\/1XEF1ja","indices":[45,68]}],"user_mentions":[],"symbols":[]},"favorited":false,"retweeted":false,"possibly_sensitive":false,"filter_level":"low","lang":"en",
"timestamp_ms":"1446218985079"}
Although this contains a lot of information, you will only need the hashtags and created_at fields of each entry, which are in bold in the above entry.
You will update the Twitter hashtag graph each time you process a new tweet and hence, the average degree of the graph. The graph should only consist of tweets that arrived in the last 60 seconds as compared to the maximum timestamp that has been processed.
As new tweets come in, edges formed with tweets older than 60 seconds from the maximum timestamp being processed should be evicted. For each incoming tweet, only extract the following fields from the JSON response
Although the hashtags also appear in the "text" field, there is no need to go through the effort of extracting the hashtags from that field since there already is a "hashtags" field. Similarly, although there is a "timestamp_ms" field, please only use the "created_at" field.
Here is an example of the extracted information from 4 tweets:
hashtags = [Spark , Apache],        created_at: Thu Mar 24 17:51:10 +0000 2016
hashtags = [Apache, Hadoop, Storm], created_at: Thu Mar 24 17:51:15 +0000 2016
hashtags = [Apache],                created_at: Thu Mar 24 17:51:30 +0000 2016
hashtags = [Flink, Spark],          created_at: Thu Mar 24 17:51:55 +0000 2016
Two hashtags will be connected if and only if they are present in the same tweet. Only tweets that contain two or more DISTINCT hashtags can create new edges.
NOTE: The order of the tweets coming in might not be ordered by time (we'll see an example below on how to deal with tweets which are out of order in time), which mimics what one would get from Twitter's streaming API.
A good way to create this graph is with an edge list where an edge is defined by two hashtags that are connected.
In this case, the first tweet that enters the system has a timestamp of Thu Mar 24 17:51:10 +0000 2016 and the edge formed is
Spark <-> Apache
The average degree will be calculated by summing the degrees of both nodes in the graph and dividing by the total number of nodes in the graph.
Average Degree = (1+1) / 2 = 1.00
The rolling average degree output is
1.00
The second tweet is in order and it will form new edges in the graph.
The edge list by first two tweets are:
#Spark <-> #Apache

#Apache <-> #Hadoop
#Hadoop <-> #Storm
#Storm <-> #Apache
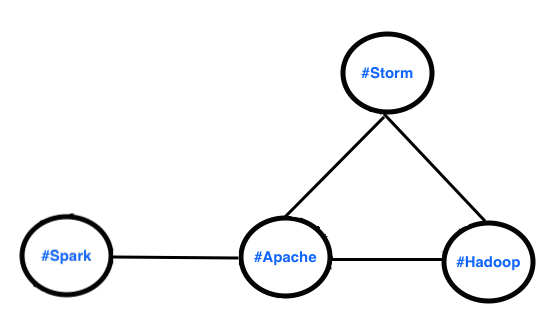
The second tweet contains 3 hashtags #Apache, #Hadoop, and #Storm. #Apache already exists in the graph, so only #Hadoop and #Storm are added to the graph and the graph now is:
Average Degree = (1+3+2+2) / 4 = 2.00
The rolling average degree output is
1.00
2.00
The third tweet has only one hashtag and hence, it doesn't generate any edges, so no new nodes will be added to the graph. The rolling average degree output is:
1.00
2.00
2.00
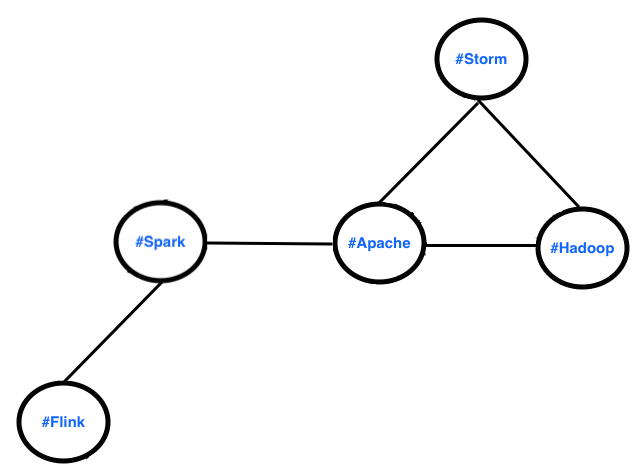
The fourth tweet is in order of time and forms new edges. The edges in the graph are:
#Spark <-> #Apache

#Apache <-> #Hadoop
#Hadoop <-> #Storm
#Storm <-> #Apache

#Flink <-> #Spark
The fourth tweet contains #Flink and #Spark. #Spark already exists, so only #Flink will be added.
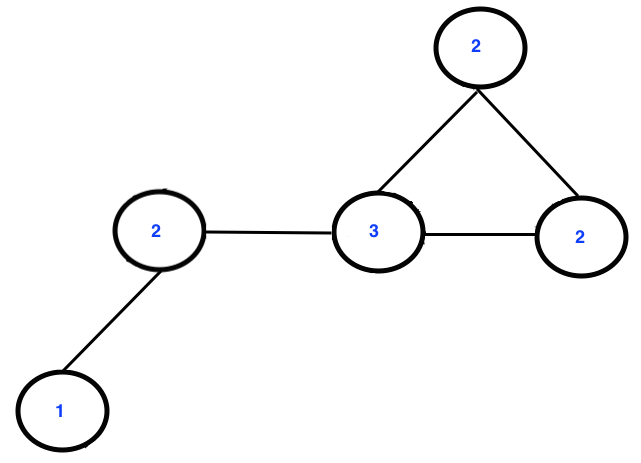
We can now calculate the degree of each node which is defined as the number of connected neighboring nodes.
Average Degree = (1+2+3+2+2) / 5 = 2.00
The rolling average degree output at the end of fourth tweet is
1.00
2.00
2.00
2.00
Note that all the tweets are in order of time in this example and for every incoming tweet, all the old tweets are in the 60 second window of the timestamp of the latest incoming tweet and hence, no tweets are evicted (we'll see an example below on how the edge eviction should be handled with time).
Now let's say another tweet has arrived and the extracted information is
hashtags = [Spark , HBase], created_at: Thu Mar 24 17:51:58 +0000 2016
The edge list now becomes:
#Spark <-> #Apache

#Apache <-> #Hadoop
#Hadoop <-> #Storm
#Storm <-> #Apache

#Flink <-> #Spark

#HBase <-> $Spark
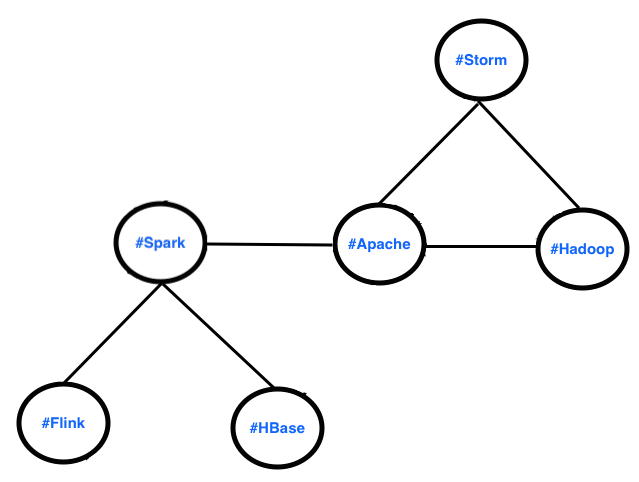
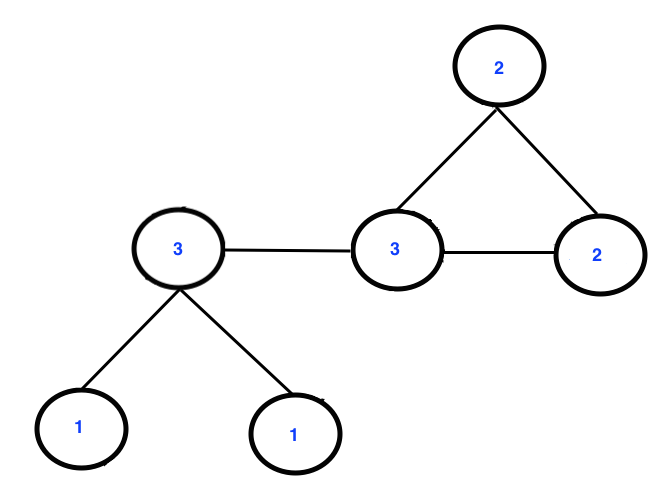
The graph now looks like the following
The updated degree calculation for each node is as follow. Here only #Spark needs to be incremented due to the additional #HBase node.
The average degree will be recalculated using the same formula as before.
Average Degree = (1+3+1+3+2+2) / 6 = 2.00
The rolling average degree is
1.00
2.00
2.00
2.00
2.00
Now let's say that the next tweet comes in and the extracted information is
hashtags = [Hadoop, Apache], created_at: Thu Mar 24 17:52:12 +0000 2016
Extracted information from all the tweets is
hashtags = [Spark , Apache],        created_at: Thu Mar 24 17:51:10 +0000 2016
hashtags = [Apache, Hadoop, Storm], created_at: Thu Mar 24 17:51:15 +0000 2016
hashtags = [Apache],                created_at: Thu Mar 24 17:51:30 +0000 2016
hashtags = [Flink, Spark],          created_at: Thu Mar 24 17:51:55 +0000 2016
hashtags = [Spark , HBase],         created_at: Thu Mar 24 17:51:58 +0000 2016
hashtags = [Hadoop, Apache],        created_at: Thu Mar 24 17:52:12 +0000 2016
We can see that the very first tweet has a timestamp that is more than 60 seconds behind this new tweet. This means that the edges formed by the first tweet should be evicted and the first tweet should not be included in our average degree calculation.
The new hashtags to be used in constructing the graph are as follows
hashtags = [Apache, Hadoop, Storm], created_at: Thu Mar 24 17:51:15 +0000 2016
hashtags = [Apache],                created_at: Thu Mar 24 17:51:30 +0000 2016
hashtags = [Flink, Spark],          created_at: Thu Mar 24 17:51:55 +0000 2016
hashtags = [Spark , HBase],         created_at: Thu Mar 24 17:51:58 +0000 2016
hashtags = [Hadoop, Apache],        created_at: Thu Mar 24 17:52:12 +0000 2016
The new edge list only has the #Spark <-> #Apache edge removed. The edge #Hadoop <-> #Apache from the new tweet already exists in the edge list.
#Apache <-> #Hadoop
#Hadoop <-> #Storm
#Storm <-> #Apache

#Flink <-> #Spark

#HBase <-> $Spark
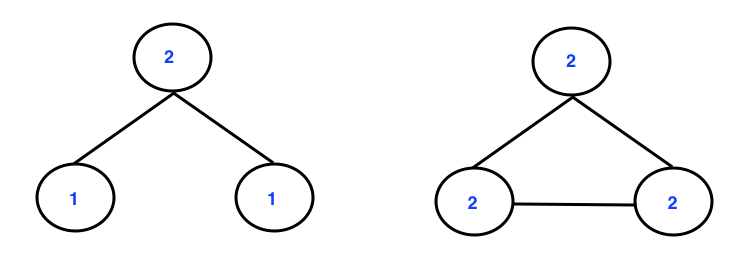
The old graph has now been disconnected forming two graphs.
We'll then calculate the new degree for all the nodes in both graphs.
Recalculating the average degree of all nodes in all graphs is as follows
Average Degree = (1+2+1+2+2+2)/6 = 1.66
Normally the average degree is calculated for a single graph, but maintaining multiple graphs for this problem can be quite difficult. For simplicity, we are only interested in calculating the average degree of of all the nodes in all graphs despite them being disconnected.
The rolling average degree now becomes
1.00
2.00
2.00
2.00
2.00
1.66
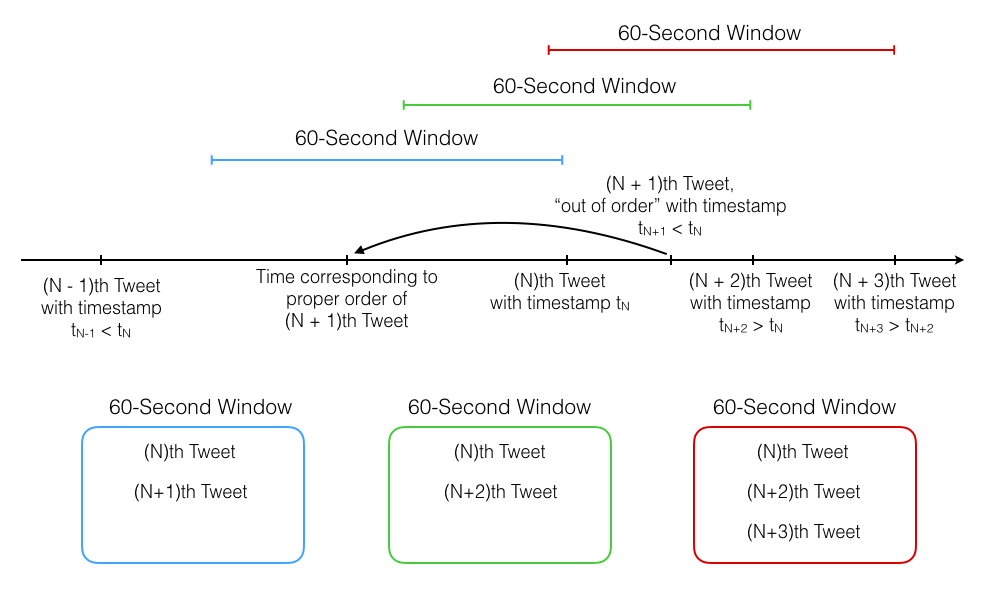
Tweets which are out of order and fall within the 60 sec window of the maximum timestamp processed or in other words, are less than 60 sec older than the maximum timestamp being processed, will create new edges in the graph. However, tweets which are out of order in time and are outside the 60-second window of the maximum timestamp processed (or more than 60 seconds older than the maximum timestamp being processed) should be ignored and such tweets won't contribute to building the graph. Below is a diagram showing this, with the Nth tweet corresponding to the tweet on the the Nth line of the tweets.txt file.
It's easiest to understand this with an example. Let's say that a new tweet comes in and the extracted information is
hashtags = [Flink, HBase], created_at: Thu Mar 24 17:52:10 +0000 2016
This tweet is out of order in time but falls within the 60 second time window of the maximum timestamp processed (latest timestamp), i.e., Thu Mar 24 17:52:12 +0000 2016.
The new hashtags to be used in constructing the graph are as follows
hashtags = [Apache, Hadoop, Storm], created_at: Thu Mar 24 17:51:15 +0000 2016
hashtags = [Apache],                created_at: Thu Mar 24 17:51:30 +0000 2016
hashtags = [Flink, Spark],          created_at: Thu Mar 24 17:51:55 +0000 2016
hashtags = [Spark , HBase],         created_at: Thu Mar 24 17:51:58 +0000 2016
hashtags = [Hadoop, Apache],        created_at: Thu Mar 24 17:52:12 +0000 2016
hashtags = [Flink, HBase],          created_at: Thu Mar 24 17:52:10 +0000 2016
A new edge is added to the graph and the edge list becomes
#Apache <-> #Hadoop
#Hadoop <-> #Storm
#Storm <-> #Apache

#Flink <-> #Spark

#HBase <-> $Spark

#HBase <-> #Flink
The graph can be visualized as
The average degree is (2+2+2+2+2+2) / 6 = 2.00
The rolling average degree output becomes
1.00
2.00
2.00
2.00
2.00
1.66
2.00
Now, let's say that a new tweet comes in and the extracted information is
hashtags = [Cassandra, NoSQL], created_at: Thu Mar 24 17:51:10 +0000 2016
This tweet is out of order and is outside the 60 second window of the maximum timestamp processed (latest timestamp), i.e., Thu Mar 24 17:52:12 +0000 2016. This tweet should be ignored. It will not form new edges and will not contribute to the graph formation. The graph remains the same as before this tweet arrived.
Consider that a new tweet arrives and the extracted information is
hashtags = [Kafka, Apache], created_at: Thu Mar 24 17:52:20 +0000 2016
We can see that the tweet with hashtags [Apache, Hadoop, Storm] has a timestamp that is more than 60 seconds behind this new tweet. This means that the edges formed by the tweet 60 seconds behind the maximum timestamp processed (latest timestamp) should be evicted and the edges formed by that should not be included in our average degree calculation.
The new hashtags to be used in constructing the graph are as follows
hashtags = [Apache],                created_at: Thu Mar 24 17:51:30 +0000 2016
hashtags = [Flink, Spark],          created_at: Thu Mar 24 17:51:55 +0000 2016
hashtags = [Spark , HBase],         created_at: Thu Mar 24 17:51:58 +0000 2016
hashtags = [Hadoop, Apache],        created_at: Thu Mar 24 17:52:12 +0000 2016
hashtags = [Flink, HBase],          created_at: Thu Mar 24 17:52:10 +0000 2016
hashtags = [Kafka, Apache],         created_at: Thu Mar 24 17:52:20 +0000 2016
The edge list now becomes
#Flink <-> #Spark

#HBase <-> $Spark

#Apache <-> #Hadoop

#HBase <-> #Flink

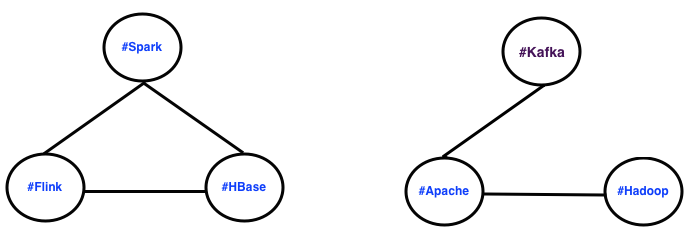
#Kafka <-> #Apache
The graph is as follows
The average degree of the graph is (2+2+2+2+1+1) / 6 = 1.66
The rolling average degree output is
1.00
2.00
2.00
2.00
2.00
1.66
2.00
1.66
The output should be a file in the tweet_output directory named output.txt that contains the rolling average for each tweet in the file (e.g. if there are three input tweets, then there should be 3 averages), following the format above. The precision of the average should be two digits after the decimal place with truncation.
Ideally, the updates of the average degree of a Twitter hashtag graph as each tweet arrives would be connected to the Twitter streaming API and would add new tweets to the end of tweets.txt. However, connecting to the API requires more system specific "dev ops" work, which isn't the primary focus for data engineers. Instead, you should simply assume that each new line of the text file corresponds to a new tweet and design your program to handle a text file with a large number of tweets. Your program should output the results to a text file named output.txt in the tweet_output directory.
As a data engineer, it’s important that you write clean, well-documented code that scales for large amounts of data. For this reason, it’s important to ensure that your solution works well for a huge number of tweets, rather than just the simple examples above. For example, your solution should be able to account for a large number of tweets coming in a short period of time, and need to keep up with the input (i.e. need to process a minute of tweets in less than a minute). It's also important to use software engineering best practices like unit tests, especially since public data is not clean and predictable. For more details about the implementation, please refer to the FAQ below or email us at cc@insightdataengineering.com
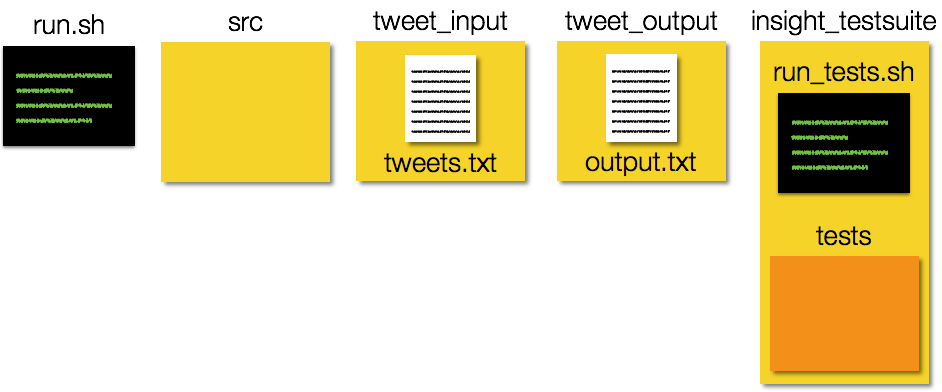
You may write your solution in any mainstream programming language such as C, C++, C#, Clojure, Erlang, Go, Haskell, Java, Python, Ruby, or Scala - then submit a link to a Github repo with your source code. In addition to the source code, the top-most directory of your repo must include the tweet_input and tweet_output directories, and a shell script named run.sh that compiles and runs the program(s) that implement these features. If your solution requires additional libraries, environments, or dependencies, you must specify these in your README documentation. See the figure below for the required structure of the top-most directory in your repo, or simply clone this repo.
Alternatively, here is example output of the tree command:
├── README.md
├── run.sh
├── src
│   └── average_degree.java
├── tweet_input
│   └── tweets.txt
├── tweet_output
│   └── output.txt
└── insight_testsuite
    ├── run_tests.sh
    └── tests
        └── test-2-tweets-all-distinct
        │   ├── tweet_input
        │   │   └── tweets.txt
        │   └── tweet_output
        │       └── output.txt
        └── your-own-test
            ├── tweet_input
            │   └── tweets.txt
            └── tweet_output
                └── output.txt
The contents of src do not have to contain a single file called "average_degree.java", you are free to include one or more files and name them as you wish.
To make sure that your code has the correct directory structure and the format of the output data in output.txt is correct, we included a test script, called run_tests.sh in the insight_testsuite folder.
The tests are stored simply as text files under the insight_testsuite/tests folder. Each test should have a separate folder and within should have a tweet_input folder for tweets.txt and a tweet_output folder for output.txt corresponding to the current test.
You can run the test with the following from the insight_testsuite folder:
insight_testsuite$ ./run_tests.sh The output of run_tests.sh should look like:
[FAIL]: test-2-tweets-all-distinct
[Tue Mar 29 2016 11:59:59] 0 of 1 tests passed
on failed tests and
[PASS]: test-2-tweets-all-distinct
[Tue Mar 29 2016 11:59:59] 1 of 1 tests passed
on success
One test has been provided as a way to check your formatting and simulate how we will be running tests when you submit your solution. We urge you to write your own additional tests here as well as for your own programming language. run_tests.sh should alert you if the directory structure is incorrect.
Your submission must pass at least the provided test in order to pass the coding challenge.
Here are some common questions we've received. If you have additional questions, please email cc@insightdataengineering.com and we'll answer your questions as quickly as we can.
-
Which Github link should I submit?
You should submit the URL for the top-level root of your repository. For example, this repo would be submitted by copying the URLhttps://github.com/InsightDataScience/my-cc-exampleinto the appropriate field on the application. Please do NOT try to submit your coding challenge using a pull request, which will make your source code publicly available. -
Do I need a private Github repo?
No, you may use a public repo, there is no need to purchase a private repo. You may also submit a link to a Bitbucket repo if you prefer. -
Do you have any larger sample inputs?
Yes, there is an example input with roughly 10,000 tweets in thedata-gendirectory of this repo. This example includes the rate limiting messages (e.g.{"limit": {"track":5,"timestamp_ms":"1446218985743"} }), which need to be properly removed. It also contains a simplified producer that can connect to the live Twitter API and save the tweets to an input file that conforms to the requirements of this data challenge. This is not required for the challenge, but may be helpful for testing your solution. -
May I use R or other analytics programming languages to solve the challenge?
While you may use any programming language to complete the challenge, it's important that your implementation scales to handle large amounts of data. Many applicants have found that R is unable to process data in a scalable fashion, so it may be more practical to use another language. -
May I use distributed technologies like Hadoop or Spark?
While you're welcome to use any language or technology, it will be tested on a single machine so there may not be a significant benefit to using these technologies prior to the program. With that said, learning distributed systems is a valuable skill for all data engineers. -
What sort of system should I use to run my program on (Windows, Linux, Mac)?
You may write your solution on any system, but your code should be portable and work on all systems. In particular, your code must be able to run on either Unix or Linux, as that's the system that will be used for testing. This means that you must submit a workingrun.shscript. Linux machines are the industry standard for most data engineering companies, so it is helpful to be familiar with this. If you're currently using Windows, we recommend using tools like Cygwin or Docker, or a free online IDE such as Cloud9 (c9.io). -
When are two hashtags considered the same?
Hashtags must be identical to be the same. Specifically, you should treat hashtags as case-sensitive. Thus#Spark,#spark, and#SPARKshould all be counted as different hashtags with separate nodes in the hashtag graph. -
What should I do with tweets that don't have at least two hashtags?
These tweets still need to be processed, which may evict older tweets from the 60-second window that affects the graph, but they will not lead to new nodes or edges in the graph. Tweets with only one hashtag should NOT create nodes. -
Can I use pre-built packages, modules, or libraries?
This coding challenge can be completed without any "exotic" packages. While you may use publicly available packages, modules, or libraries, you must document any dependencies in your accompanyingREADMEfile. When we review your submission, we will download these libraries and attempt to run your program. If you do use a package, you should always ensure that the module you're using works efficiently for the specific use-case in the challenge, since many libraries are not designed for large amounts of data. -
Will you email me if my code doesn't run?
Unfortunately, we receive hundreds of submissions in a very short time and are unable to email individuals if code doesn't compile or run. This is why it's so important to document any dependencies you have, as described in the previous question. We will do everything we can to properly test your code, but this requires good documentation. More so, we have provided a test suite so you can confirm that your directory structure is correct. -
Do I need to use multi-threading?
No, your solution doesn't necessarily need to include multi-threading - there are many solutions that don't require multiple threads/cores or any distributed systems, but instead use efficient data structures. -
Do I need to account for an updating
tweets.txtfile?
No, your solution doesn't have to re-processtweets.txt. Instead, it should be designed to handle a very large input size. If you were doing this project as a data engineer in industry, you would probably use a scheduler to run your program daily in batches, but this is beyond the scope of this challenge. -
What should the format of the output be?
In order to be tested correctly, you must use the format described above. You can ensure that you have the correct format by using the testing suite we've included. If you are still unable to get the correct format from the messages in the suite, please email us at cc@insightdataengineering.com. -
What should the precision of the average be?
The precision of the average should be truncated to two digits after the decimal place (e.g. 5/3 should be outputted as 1.66). -
Do I need to account for complicated Unicode characters by replacing them?
No, simply use the Unicode as it is given in the hashtags field of the JSON. If you alter the Unicode in your solution, it will not pass our testing suite. -
Will the JSON input contain the hashtag entity, or do I have to extract it from the text?
You should use the hashtags directly from the entity field of the JSON. Please don't extract it from the text field, as it's extra work for you. -
Do I need to account for empty tweets?
No, for simplicity you may assume that all the tweets contain at least one word. However, many tweets won't necessarily contain two hashtags, and may not form new edges in the graph. This means you will have to test properly when implementing your solution for real data. -
Do I need to update the average when the next tweet in the file falls outside the 60-second window?
Yes, you're average should be updated each time a new tweet is processed, regardless of if it falls outside the window. Thus, if there are 500 tweets in thetweets.txt, then there should be 500 averages inoutput.txt. The only input that should be ignored are the rate-limit messages discussed above. -
Do I need to account for JSON messages that looks like
{"limit": {"track":5,"timestamp_ms":"1446218985743"} }, which appear in the example from the data generator?
These are messages from the Twitter API that result from the rate-limit. Your solution needs to properly remove these messages from the input. -
Should my graph contain disconnected nodes?
No, the graph should only contain connected nodes, and this also means that you may need to remove nodes if they are no longer connected once tweets are evicted from the 60-second window. -
Should I check if the files in the input directory are text files or non-text files(binary)?
No, for simplicity you may assume that all of the files in the input directory are standard text files, with the same format as the example file in thedata-gendirectory. -
What should the average be if the graph has no connections (e.g. if the first tweet doesn't have at least two hashtags)?
If there are no connections for the entire graph, then you can count the average as0.00. -
Should I count self connections if a hashtag appears multiple times in a tweet?
No, you should not count connection from a node to itself. -
If multiple tweets within a 60-second window have the same pair of hashtags, should they be connected twice?
No, please don't count multiple connection. In other words, nodes can either be connected by one edge, or not connected at all. However, you should ensure that the timestamp of the corresponding edge is properly updated. -
Can I use an IDE like Eclipse to write my program?
Yes, you can use what ever tools you want - as long as yourrun.shscript correctly runs the relevant target files and creates theoutput.txtfile in thetweet_outputdirectory. -
What should be in the
tweet_inputdirectory?
You can put any text file you want in the directory. In fact, this could be quite helpful for testing your solutions. -
How will the coding challenge be evaluated?
Generally, we will evaluate your coding challenge with a testing suite that provides a variety of input tweets and checks the corresponding output. This suite will attempt to use yourrun.shand is fairly tolerant to different runtime environments. Of course, there are many aspects (e.g. clean code, documentation) that cannot be tested by our suite, so each submission will also be reviewed manually by a person. -
How long will it take for me to hear back from you about my submission?
We receive hundreds of submissions and try to evaluate them all in a timely manner. We try to get back to all applicants within two or three weeks of submission, but if you have a specific deadline that requires expedited review, you may email us at cc@insightdataengineering.com.

