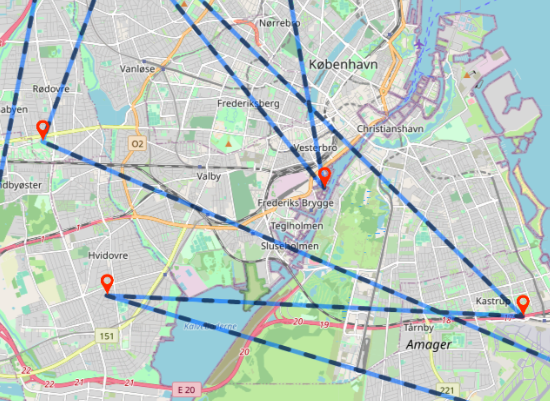
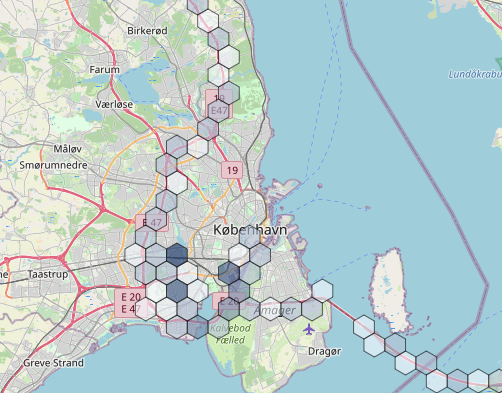
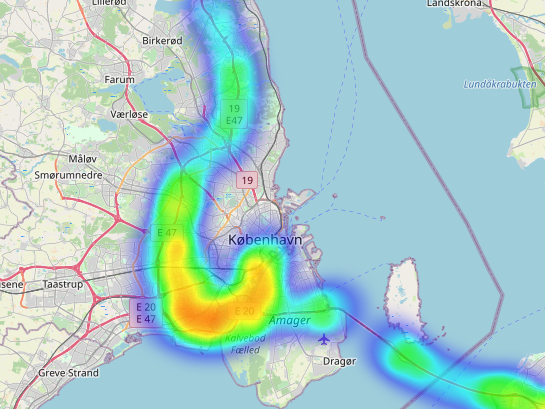
A map plugin to visualise coordinates as markers, hexbin, ant path, or heatmap.
This is a new version of the Track Map plugin - now built with React, which works with Grafana 7+.
Note that this plugin is not backwards compatible with the old Grafana 6 versions.
For Grafana 6 and older, please use our 1.x branch instead.
The query in Grafana can be formatted as Table or Time series and contain the fields latitude and longitude or just lat and lon. To add intensity to the heatmap (instead of using only coordinates), the intensity field should be added.
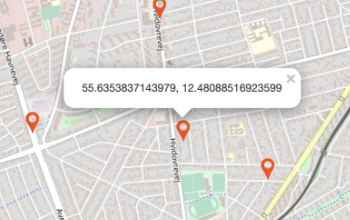
To add a text popup to the markers, a popup, text or desc field should be added. If no popup field exists, latitude and longitude are displayed in the popup.
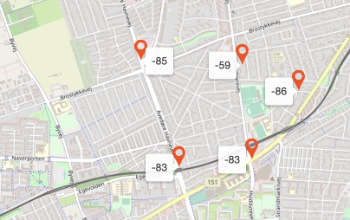
To add a mouseover tooltip to the markers, add a tooltip field. The tooltips can be shown permanently by toggling the Always show tooltips option (may require map reload).
Data query example (TimescaleDB with PostGIS):
SELECT
avg("lat") as "latitude",
avg("long") as "longitude",
max(abs("rssi")) as "intensity",
max("rssi") as "tooltip",
clusters
FROM (SELECT lat,
long,
geo,
rssi,
ST_ClusterKMeans(geo, 100) over() as clusters
FROM table_name) table_name_clustered
GROUP BY clusters
ORDER BY clusters;The panel has general configuration options as well as options specific to each visualisation type.
Map center and zoom can be changed with the Map center latitude, Map center longitude and Zoom properties.
Centering the map on the first/last position or zooming to fit all data within the map bounds on load can be achieved by using the Map center to first position, Map center to last position and Zoom map to fit data bounds switches.
To update query variables when the map bounds are updated turn on Use map bounds in query. See section "Updating query based on map bounds" below.
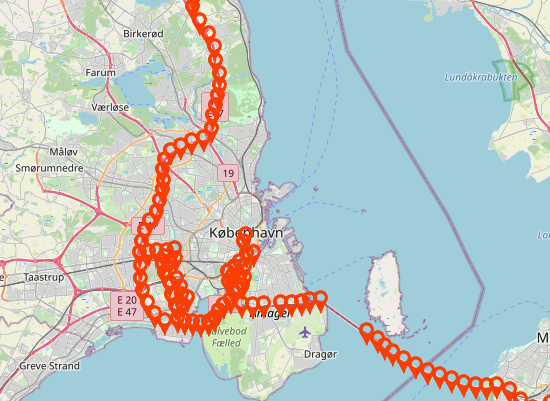
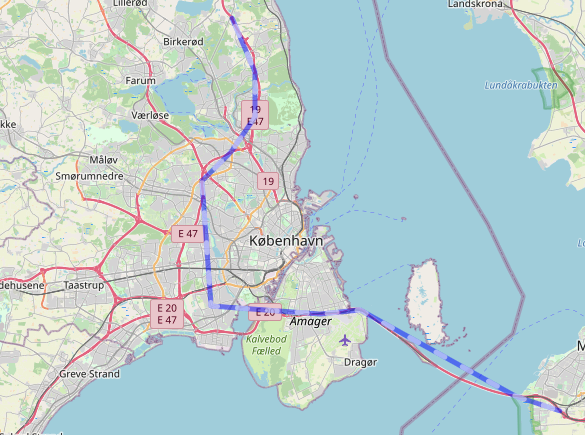
Switch between views (Markers, Ant Path, Ant Path With Markers, Hexbin, Heatmap) by selecting a Visualisation type .
Note that some options are disabled when others are enabled - e.g. you cannot set a specific zoom level and also zoom the map to fit all data at the same time.
Size: The size of the markersSize of last marker: The size of the last markerShow only last marker: Shows only last markerUse secondary icon for last marker: Uses secondary icon image for last markerUse secondary icon for all markers: Uses secondary icon image for all markersAlways show tooltips: Always show the mouseover tooltips
Delay: The delay of the animationWeight: The width of the pathColor: The color of the pathPulse color: The color of the pulse running along the pathPaused: Pause/start the animationReverse: Reverse the animation direction
Delay: The delay of the animationWeight: The width of the pathColor: The color of the pathPulse color: The color of the pulse running along the pathPaused: Pause/start the animationReverse: Reverse the animation directionShow only last marker: Shows only last markerUse secondary icon for last marker: Uses secondary icon image for last markerUse secondary icon for all markers: Uses secondary icon image for all markersAlways show tooltips: Always show the mouseover tooltips
Opacity: The opacity of the hexagonsColor range from (hex): Color ranges from this valueColor range to (hex): Color ranges to this valueRadius range from: Min radiusRadius range to: Max radius
Fit bounds on load: Fit the heatmap inside the map bounds on loadFit bounds on update: Fit the heatmap inside the map bounds on update
To change the icons used for the markers, replace the marker.png and marker_secondary.png files in the /src/img folder.
To update the query dynamically based on the map bounds turn on Use map bounds in query. To use this you must manually add four variables to the dashboard (via settings in the top right corner). Add four variables of type constant with names minLat, minLon, maxLat, and maxLon. The values can be anything, e.g. 1, 2, 3, 4 - they will be overwritten by the plugin. Remember to save the dashboard. The variables can then be used in a query. Here is an example that limits the query to the bounds of the map:
SELECT
  avg("lat") as "latitude",
  avg("long") as "longitude",
  max(abs("rssi")) as "intensity",
  max("rssi") as "tooltip",
FROM (
  SELECT sys_time, lat, long, geo, rssi, ST_ClusterKMeans(geo, 15) over() as clusters from table_name
  Where lat >= $minLat
    AND lat <= $maxLat
    AND long >= $minLon
    AND long <= $maxLon
) table_name_clustered
GROUP BY clustersIf you are running Grafana locally, you can clone or download the repository directly into the plugin directory, reset the Grafana server, and the plugin should get detected automatically.
If you are using Docker, a guide can be found here.
For more information on Grafana plugins look here.
To compile the plugin you need either npm (default) or yarn.
npm installnpm run-script devor run in watch mode
npm run-script watchnpm run-script build