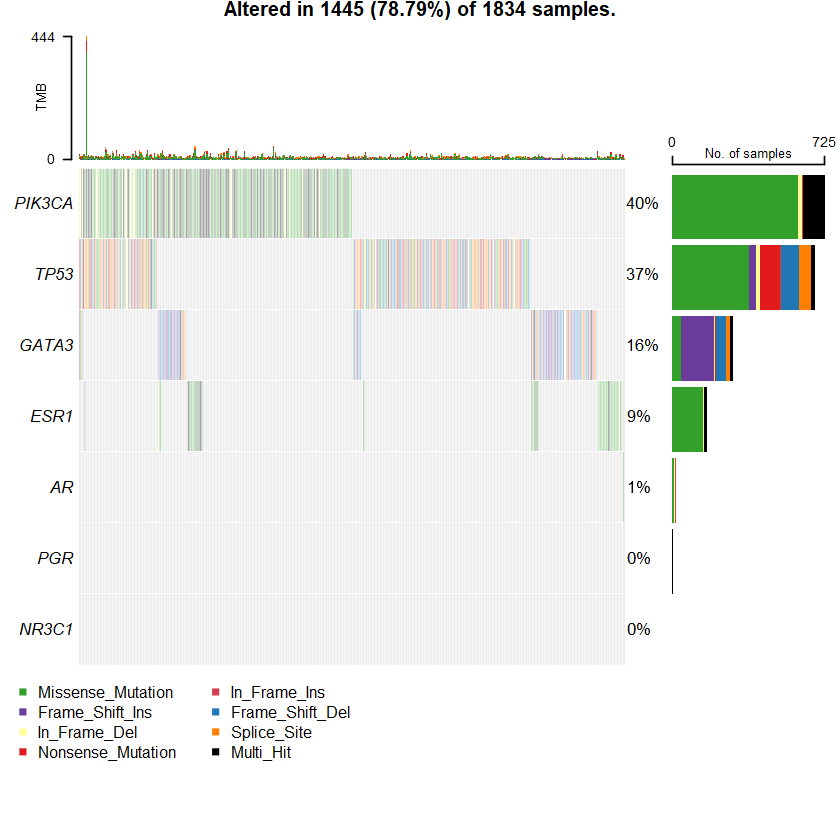
setwd(R " (D:\O neDrive - St John's National Academy of Health Sciences\S hared Folder\S nijesh\d ata\c bioportal\b rca)" library(maftools )
library(dplyr ) nrs <- c(" AR" " ESR1" " PGR" " NR3C1" " VDR" # genes %>% dplyr::filter(Hugo_Symbol %in% rows_to_filter)Samples: 2433
df = read.maf(maf = " brca_metabric_data_mutations.txt" samp = getSampleSummary(df )
head(samp , 10 )-Reading
-Validating
-Silent variants: 4212
-Summarizing
--Possible FLAGS among top ten genes:
MUC16
AHNAK2
SYNE1
DNAH11
-Processing clinical data
--Missing clinical data
-Finished in 0.750s elapsed (0.500s cpu)
A data.table: 10 × 11
Tumor_Sample_Barcode Frame_Shift_Del Frame_Shift_Ins In_Frame_Del In_Frame_Ins Missense_Mutation Nonsense_Mutation Nonstop_Mutation Splice_Site Translation_Start_Site total <fct> <int> <int> <int> <int> <int> <int> <int> <int> <int> <dbl>
MB-5275 0 0 0 0 66 15 0 0 0 81 MB-4791 0 0 0 0 40 6 0 0 0 46 MB-4667 0 0 1 0 31 8 0 1 0 41 MTS-T1284 0 0 0 0 30 4 0 1 0 35 MTS-T0340 1 1 0 0 25 4 0 1 0 32 MB-4938 1 1 0 0 25 1 0 2 0 30 MB-0897 0 0 0 0 22 6 0 0 0 28 MB-3525 0 0 0 0 24 1 0 1 0 26 MB-4079 2 0 1 0 20 1 0 0 0 24 MB-3363 3 0 0 0 16 1 0 3 0 23
genes = getGeneSummary(df )
head(genes ,10 )
A data.table: 10 × 13
Hugo_Symbol Frame_Shift_Del Frame_Shift_Ins In_Frame_Del In_Frame_Ins Missense_Mutation Nonsense_Mutation Nonstop_Mutation Splice_Site Translation_Start_Site total MutatedSamples AlteredSamples <chr> <int> <int> <int> <int> <int> <int> <int> <int> <int> <dbl> <int> <int>
PIK3CA 5 5 34 2 1065 0 1 0 0 1112 975 975 TP53 121 40 29 7 510 126 0 52 0 885 861 861 MUC16 6 4 8 2 465 14 0 0 0 499 409 409 AHNAK2 4 1 0 2 524 5 1 0 0 537 395 395 SYNE1 2 1 3 0 314 11 0 6 0 337 293 293 KMT2C 67 19 4 0 148 67 0 9 0 314 277 277 GATA3 50 80 5 1 53 7 0 81 0 277 267 267 MAP3K1 100 75 14 2 78 51 0 16 0 336 236 236 CDH1 72 51 7 0 28 63 0 18 1 240 233 233 DNAH11 1 2 2 0 224 12 0 0 0 241 226 226
plotmafSummary(maf = df , rmOutlier = TRUE , addStat = ' median' dashboard = TRUE , titvRaw = FALSE )
genes %> % dplyr :: filter(Hugo_Symbol %in% nrs )
A data.table: 1 × 13
Hugo_Symbol Frame_Shift_Del Frame_Shift_Ins In_Frame_Del In_Frame_Ins Missense_Mutation Nonsense_Mutation Nonstop_Mutation Splice_Site Translation_Start_Site total MutatedSamples AlteredSamples <chr> <int> <int> <int> <int> <int> <int> <int> <int> <int> <dbl> <int> <int>
NR3C1 0 0 0 0 12 0 0 0 0 12 12 12
sets = c(" MUC16" " TP53" " PIK3CA" sts <- c(sets , nrs )
oncoplot(maf = df , genes = sts )
Samples: 1066
df = read.maf(maf = " brca_tcga_data_mutations.txt" samp = getSampleSummary(df )
head(samp , 10 )-Reading
-Validating
--Removed 4243 duplicated variants
-Silent variants: 43355
-Summarizing
--Possible FLAGS among top ten genes:
TTN
MUC16
FLG
-Processing clinical data
--Missing clinical data
-Finished in 17.2s elapsed (13.2s cpu)
A data.table: 10 × 11
Tumor_Sample_Barcode Frame_Shift_Del Frame_Shift_Ins In_Frame_Del In_Frame_Ins Missense_Mutation Nonsense_Mutation Nonstop_Mutation Splice_Site Translation_Start_Site total <fct> <int> <int> <int> <int> <int> <int> <int> <int> <int> <dbl>
TCGA-AN-A046-01 3 12 0 0 4472 757 6 90 0 5340 TCGA-AC-A23H-01 16 3 1 0 3622 403 7 73 10 4135 TCGA-EW-A2FV-01 3825 0 0 0 19 0 0 34 0 3878 TCGA-D8-A27V-01 2868 0 1 0 140 16 0 44 1 3070 TCGA-BH-A18G-01 129 40 12 0 969 46 1 33 2 1232 TCGA-AN-A0AK-01 132 47 33 2 808 47 0 33 1 1103 TCGA-A8-A09Z-01 109 45 22 1 818 39 3 34 2 1073 TCGA-D8-A1XK-01 68 15 2 0 780 17 2 61 0 945 TCGA-BH-A0HF-01 1 1 0 0 745 49 0 27 0 823 TCGA-AO-A128-01 30 3 2 0 728 26 2 23 1 815
genes = getGeneSummary(df )
head(genes ,10 )
A data.table: 10 × 13
Hugo_Symbol Frame_Shift_Del Frame_Shift_Ins In_Frame_Del In_Frame_Ins Missense_Mutation Nonsense_Mutation Nonstop_Mutation Splice_Site Translation_Start_Site total MutatedSamples AlteredSamples <chr> <int> <int> <int> <int> <int> <int> <int> <int> <int> <dbl> <int> <int>
PIK3CA 0 0 15 1 370 0 0 0 0 386 346 346 TP53 47 14 5 0 216 46 0 24 0 352 346 346 TTN 21 0 1 1 259 20 0 6 0 308 186 186 GATA3 24 65 1 0 13 4 0 23 0 130 127 127 CDH1 34 32 4 0 15 31 0 13 0 129 127 127 MUC16 15 1 0 0 128 8 0 0 0 152 109 109 KMT2C 22 10 1 0 45 34 0 3 0 115 97 97 MAP3K1 39 32 4 0 29 22 0 4 0 130 89 89 FLG 1 0 2 0 69 4 0 0 0 76 66 66 RYR2 2 0 0 0 74 3 0 4 0 83 65 65
plotmafSummary(maf = df , rmOutlier = TRUE , addStat = ' median' dashboard = TRUE , titvRaw = FALSE )
genes %> % dplyr :: filter(Hugo_Symbol %in% nrs )
A data.table: 5 × 13
Hugo_Symbol Frame_Shift_Del Frame_Shift_Ins In_Frame_Del In_Frame_Ins Missense_Mutation Nonsense_Mutation Nonstop_Mutation Splice_Site Translation_Start_Site total MutatedSamples AlteredSamples <chr> <int> <int> <int> <int> <int> <int> <int> <int> <int> <dbl> <int> <int>
ESR1 1 0 1 0 6 1 0 0 0 9 9 9 AR 1 0 0 0 5 1 1 0 0 8 8 8 PGR 0 1 0 0 7 0 0 0 0 8 7 7 NR3C1 0 0 0 0 3 1 0 0 0 4 4 4 VDR 0 0 0 0 2 0 0 0 0 2 2 2
sets = c(" TTN" " TP53" " PIK3CA" sts <- c(sets , nrs )
oncoplot(maf = df , genes = sts )
Alterations in PTEN and ESR1 promote clinical resistance to alpelisib plus aromatase inhibitors Breast Cancer (MSK, Nature Cancer 2020)
REF: 32864625
Samples: 141
df = read.maf(maf = " breast_alpelisib_2020_data_mutations.txt" samp = getSampleSummary(df )
head(samp , 10 )-Reading
-Validating
-Silent variants: 55
-Summarizing
--Mutiple centers found
NA;MSKCC-Processing clinical data
--Missing clinical data
-Finished in 0.140s elapsed (0.040s cpu)
A data.table: 10 × 10
Tumor_Sample_Barcode Frame_Shift_Del Frame_Shift_Ins In_Frame_Del In_Frame_Ins Missense_Mutation Nonsense_Mutation Splice_Site Translation_Start_Site total <fct> <int> <int> <int> <int> <int> <int> <int> <int> <dbl>
P040-04-Post-cfDNA 2 0 1 0 54 11 1 0 69 P009-04-Post-cfDNA 0 1 0 0 52 8 0 0 61 P040-02-Pre-cfDNA 2 0 0 1 47 9 1 0 60 P009-02-Pre-cfDNA 0 0 0 0 27 3 0 0 30 P002-02-Pre-cfDNA 2 2 0 0 16 6 0 0 26 P-0000247-T02-IM5 0 1 0 0 17 2 0 0 20 P046-04-Post-cfDNA 0 0 0 0 17 1 0 0 18 P054-04-Post-cfDNA 0 0 0 0 16 0 0 0 16 P-0000138-T02-IM3 0 0 0 0 13 1 0 0 14 P-0000216-T02-IM3 0 0 0 0 8 1 0 0 9
genes = getGeneSummary(df )
head(genes ,10 )
A data.table: 10 × 12
Hugo_Symbol Frame_Shift_Del Frame_Shift_Ins In_Frame_Del In_Frame_Ins Missense_Mutation Nonsense_Mutation Splice_Site Translation_Start_Site total MutatedSamples AlteredSamples <chr> <int> <int> <int> <int> <int> <int> <int> <int> <dbl> <int> <int>
PIK3CA 0 0 1 0 139 0 0 0 140 110 110 ESR1 0 0 0 0 60 0 0 0 60 38 38 TP53 7 1 1 0 45 17 3 0 74 36 36 ARID1A 2 4 0 0 12 6 0 0 24 23 23 CDH1 4 7 0 0 5 1 1 1 19 19 19 NF1 2 0 0 0 15 9 2 0 28 17 17 APC 0 0 0 0 22 2 0 0 24 12 12 BRCA2 0 0 2 0 17 2 0 0 21 12 12 MTOR 0 0 1 0 13 3 0 0 17 12 12 PTEN 1 1 0 0 11 3 0 0 16 12 12
plotmafSummary(maf = df , rmOutlier = TRUE , addStat = ' median' dashboard = TRUE , titvRaw = FALSE )
genes %> % dplyr :: filter(Hugo_Symbol %in% nrs )
A data.table: 2 × 12
Hugo_Symbol Frame_Shift_Del Frame_Shift_Ins In_Frame_Del In_Frame_Ins Missense_Mutation Nonsense_Mutation Splice_Site Translation_Start_Site total MutatedSamples AlteredSamples <chr> <int> <int> <int> <int> <int> <int> <int> <int> <dbl> <int> <int>
ESR1 0 0 0 0 60 0 0 0 60 38 38 AR 0 0 0 0 12 0 0 0 12 7 7
sets = c(" ARID1A" " TP53" " PIK3CA" sts <- c(sets , nrs )
oncoplot(maf = df , genes = sts )
Proteogenomic Landscape of Breast Cancer Tumorigenesis and Targeted Therapy 33212010
Proteogenomic landscape of breast cancer (CPTAC, Cell 2020)
Samples : 122
df = read.maf(maf = " brca_cptac_2020_data_mutations.txt" samp = getSampleSummary(df )
head(samp , 10 )-Reading
-Validating
-Silent variants: 9470
-Summarizing
--Possible FLAGS among top ten genes:
TTN
MUC16
HMCN1
AHNAK
OBSCN
FLG
-Processing clinical data
--Missing clinical data
-Finished in 2.710s elapsed (1.720s cpu)
A data.table: 10 × 11
Tumor_Sample_Barcode Frame_Shift_Del Frame_Shift_Ins In_Frame_Del In_Frame_Ins Missense_Mutation Nonsense_Mutation Nonstop_Mutation Splice_Site Translation_Start_Site total <fct> <int> <int> <int> <int> <int> <int> <int> <int> <int> <dbl>
X01BR043 8 1 2 1 7328 394 1 108 16 7859 X18BR003 2 0 0 1 891 84 3 15 1 997 X11BR003 100 18 5 0 623 27 1 23 0 797 X15BR003 3 1 0 0 579 58 4 12 1 658 X05BR038 0 0 1 0 332 42 0 6 1 382 X05BR029 46 11 4 2 256 18 0 10 1 348 X11BR031 3 0 0 0 304 33 0 6 0 346 X01BR018 18 0 12 3 256 10 1 8 0 308 X21BR001 5 0 1 0 229 18 0 9 1 263 X01BR027 4 0 0 0 149 12 0 6 1 172
genes = getGeneSummary(df )
head(genes ,10 )
A data.table: 10 × 13
Hugo_Symbol Frame_Shift_Del Frame_Shift_Ins In_Frame_Del In_Frame_Ins Missense_Mutation Nonsense_Mutation Nonstop_Mutation Splice_Site Translation_Start_Site total MutatedSamples AlteredSamples <chr> <int> <int> <int> <int> <int> <int> <int> <int> <int> <dbl> <int> <int>
TP53 8 0 2 0 27 14 0 2 0 53 50 50 PIK3CA 0 1 5 0 39 0 0 0 0 45 40 40 TTN 0 0 0 0 86 3 0 0 0 89 33 33 MUC16 2 0 0 0 34 1 0 0 0 37 15 15 HMCN1 0 0 0 0 20 2 0 2 0 24 13 13 AHNAK 0 0 0 0 20 1 0 0 0 21 13 13 OBSCN 0 0 0 0 19 1 0 0 0 20 13 13 ABCA13 0 0 0 0 15 4 0 0 0 19 13 13 FLG 0 0 0 0 24 0 0 0 0 24 12 12 MAP3K1 4 1 1 0 6 2 0 2 0 16 11 11
plotmafSummary(maf = df , rmOutlier = TRUE , addStat = ' median' dashboard = TRUE , titvRaw = FALSE )
genes %> % dplyr :: filter(Hugo_Symbol %in% nrs )
A data.table: 4 × 13
Hugo_Symbol Frame_Shift_Del Frame_Shift_Ins In_Frame_Del In_Frame_Ins Missense_Mutation Nonsense_Mutation Nonstop_Mutation Splice_Site Translation_Start_Site total MutatedSamples AlteredSamples <chr> <int> <int> <int> <int> <int> <int> <int> <int> <int> <dbl> <int> <int>
AR 0 0 0 0 3 0 0 0 0 3 3 3 PGR 0 0 0 0 2 0 0 0 0 2 2 2 ESR1 0 0 0 0 1 0 0 0 0 1 1 1 NR3C1 0 0 0 0 1 0 0 0 0 1 1 1
sets = c(" TTN" " TP53" " PIK3CA" sts <- c(sets , nrs )
oncoplot(maf = df , genes = sts )
Dynamics of genomic clones in breast cancer patient xenografts at single-cell resolution REF : 25470049
Breast Cancer Xenografts (British Columbia, Nature 2015)
Samples: 117
df = read.maf(maf = " brca_bccrc_data_mutations.txt" samp = getSampleSummary(df )
head(samp , 10 )-Reading
-Validating
-Silent variants: 29
-Summarizing
--Mutiple centers found
BC;--Possible FLAGS among top ten genes:
USH2A
-Processing clinical data
--Missing clinical data
-Finished in 0.500s elapsed (0.260s cpu)
A data.table: 10 × 10
Tumor_Sample_Barcode Frame_Shift_Del Frame_Shift_Ins In_Frame_Del In_Frame_Ins Missense_Mutation Nonsense_Mutation Nonstop_Mutation Splice_Site total <fct> <int> <int> <int> <int> <int> <int> <int> <int> <dbl>
SA214 0 0 0 0 174 18 0 1 193 SA106 4 2 2 0 116 3 0 5 132 SA218 7 1 1 0 111 6 0 0 126 SA065 15 0 6 0 85 9 0 1 116 SA071 1 0 0 0 86 1 0 4 92 SA054 2 0 0 0 65 3 0 4 74 SA077 0 0 1 0 64 5 0 0 70 SA031 1 0 0 0 61 2 0 1 65 SA084 0 1 0 0 52 10 0 0 63 SA225 2 0 2 0 52 7 0 0 63
genes = getGeneSummary(df )
head(genes ,10 )
A data.table: 10 × 12
Hugo_Symbol Frame_Shift_Del Frame_Shift_Ins In_Frame_Del In_Frame_Ins Missense_Mutation Nonsense_Mutation Nonstop_Mutation Splice_Site total MutatedSamples AlteredSamples <chr> <int> <int> <int> <int> <int> <int> <int> <int> <dbl> <int> <int>
TP53 1 0 0 0 23 8 0 3 35 35 35 PIK3CA 0 0 1 0 6 0 0 0 7 7 7 USH2A 0 0 0 0 7 0 0 0 7 6 6 MYO3A 0 0 0 0 5 1 0 0 6 6 6 PTEN 2 0 0 0 4 0 0 0 6 5 5 ATR 1 0 0 0 4 0 0 0 5 4 4 COL6A3 0 0 0 0 3 1 0 0 4 4 4 GPR112 0 0 0 0 4 0 0 0 4 4 4 LRP2 0 0 0 0 4 0 0 0 4 4 4 MDN1 0 0 0 0 3 1 0 0 4 4 4
plotmafSummary(maf = df , rmOutlier = TRUE , addStat = ' median' dashboard = TRUE , titvRaw = FALSE )
genes %> % dplyr :: filter(Hugo_Symbol %in% nrs )
A data.table: 1 × 12
Hugo_Symbol Frame_Shift_Del Frame_Shift_Ins In_Frame_Del In_Frame_Ins Missense_Mutation Nonsense_Mutation Nonstop_Mutation Splice_Site total MutatedSamples AlteredSamples <chr> <int> <int> <int> <int> <int> <int> <int> <int> <dbl> <int> <int>
NR3C1 1 0 0 0 2 0 0 0 3 3 3
sets = c(" USH2A" " TP53" " PIK3CA" sts <- c(sets , nrs )
oncoplot(maf = df , genes = sts )
Sequence analysis of mutations and translocations across breast cancer subtypes REF: 22722202
Breast Invasive Carcinoma (Broad, Nature 2012)
Samples: 103
df = read.maf(maf = " brca_broad_data_mutations.txt" samp = getSampleSummary(df )
head(samp , 10 )-Reading
-Validating
-Silent variants: 1282
-Summarizing
--Possible FLAGS among top ten genes:
TTN
FLG
MUC16
-Processing clinical data
--Missing clinical data
-Finished in 0.880s elapsed (0.560s cpu)
A data.table: 10 × 11
Tumor_Sample_Barcode Frame_Shift_Del Frame_Shift_Ins In_Frame_Del In_Frame_Ins Missense_Mutation Nonsense_Mutation Nonstop_Mutation Splice_Site Translation_Start_Site total <fct> <int> <int> <int> <int> <int> <int> <int> <int> <int> <dbl>
BR-M-191 1 1 1 0 203 21 1 3 0 231 BR-M-037 1 0 0 0 126 20 0 3 0 150 BR-V-043 3 0 0 0 113 5 0 6 1 128 BR-V-027 0 0 0 0 102 8 1 3 0 114 BR-V-067 2 0 0 0 93 8 0 2 0 105 BR-M-045 2 0 0 0 89 5 0 4 1 101 BR-M-116 5 9 5 0 74 4 0 3 1 101 BR-V-002 0 0 0 0 64 9 0 3 0 76 BR-V-037 2 0 0 0 66 2 0 3 1 74 BR-M-055 1 1 0 0 59 4 0 0 0 65
genes = getGeneSummary(df )
head(genes ,10 )
A data.table: 10 × 13
Hugo_Symbol Frame_Shift_Del Frame_Shift_Ins In_Frame_Del In_Frame_Ins Missense_Mutation Nonsense_Mutation Nonstop_Mutation Splice_Site Translation_Start_Site total MutatedSamples AlteredSamples <chr> <int> <int> <int> <int> <int> <int> <int> <int> <int> <dbl> <int> <int>
TP53 2 0 0 0 21 4 0 4 0 31 30 30 PIK3CA 0 0 0 0 30 0 0 0 0 30 28 28 TTN 0 0 0 0 11 2 0 0 0 13 12 12 KMT2C 1 0 0 0 3 2 0 1 0 7 7 7 AKT1 0 0 0 0 6 0 0 0 0 6 6 6 FLG 0 0 0 0 6 0 0 0 0 6 6 6 MUC16 0 0 0 0 6 0 0 0 0 6 6 6 MUC2 0 0 1 0 5 0 0 0 0 6 6 6 DMD 0 3 0 0 2 0 0 0 0 5 5 5 RYR3 0 0 0 0 5 0 0 0 0 5 4 4
plotmafSummary(maf = df , rmOutlier = TRUE , addStat = ' median' dashboard = TRUE , titvRaw = FALSE )
genes %> % dplyr :: filter(Hugo_Symbol %in% nrs )
A data.table: 3 × 13
Hugo_Symbol Frame_Shift_Del Frame_Shift_Ins In_Frame_Del In_Frame_Ins Missense_Mutation Nonsense_Mutation Nonstop_Mutation Splice_Site Translation_Start_Site total MutatedSamples AlteredSamples <chr> <int> <int> <int> <int> <int> <int> <int> <int> <int> <dbl> <int> <int>
ESR1 0 0 0 0 1 0 0 0 0 1 1 1 PGR 0 1 0 0 0 0 0 0 0 1 1 1 VDR 0 0 0 0 1 0 0 0 0 1 1 1
sets = c(" TTN" " TP53" " PIK3CA" sts <- c(sets , nrs )
oncoplot(maf = df , genes = sts )
The landscape of cancer genes and mutational processes in breast cancer REF: 22722201
Breast Invasive Carcinoma (Sanger, Nature 2012)
Samples: 100
df = read.maf(maf = " brca_sanger_data_mutations.txt" samp = getSampleSummary(df )
head(samp , 10 )-Reading
-Validating
-Silent variants: 1889
-Summarizing
--Possible FLAGS among top ten genes:
TTN
MUC16
SYNE1
-Processing clinical data
--Missing clinical data
-Finished in 0.690s elapsed (0.500s cpu)
A data.table: 10 × 11
Tumor_Sample_Barcode Frame_Shift_Del Frame_Shift_Ins In_Frame_Del In_Frame_Ins Missense_Mutation Nonsense_Mutation Nonstop_Mutation Splice_Site Translation_Start_Site total <fct> <int> <int> <int> <int> <int> <int> <int> <int> <int> <dbl>
PD4203a 2 1 0 0 405 38 0 15 1 462 PD4120a 1 0 0 0 413 39 1 5 0 459 PD4937a 0 1 0 0 319 21 0 6 0 347 PD4127a 3 0 0 0 200 31 0 2 0 236 PD4100a 22 2 3 0 151 9 1 8 1 197 PD4601a 1 1 0 1 133 17 0 2 0 155 PD4119a 0 0 0 0 133 14 0 5 0 152 PD4596a 1 0 1 0 111 15 0 3 0 131 PD4123a 2 0 1 0 100 6 0 4 0 113 PD4844a 6 0 3 0 95 7 0 2 0 113
genes = getGeneSummary(df )
head(genes ,10 )
A data.table: 10 × 13
Hugo_Symbol Frame_Shift_Del Frame_Shift_Ins In_Frame_Del In_Frame_Ins Missense_Mutation Nonsense_Mutation Nonstop_Mutation Splice_Site Translation_Start_Site total MutatedSamples AlteredSamples <chr> <int> <int> <int> <int> <int> <int> <int> <int> <int> <dbl> <int> <int>
TP53 6 0 2 1 20 6 0 3 0 38 37 37 PIK3CA 0 0 1 0 33 0 0 0 0 34 30 30 TTN 0 1 1 0 27 2 0 1 0 32 26 26 GATA3 1 13 0 0 1 0 0 1 0 16 15 15 MLL3 1 2 0 0 7 2 0 1 0 13 11 11 MUC16 0 0 0 0 9 1 0 0 0 10 10 10 CDH1 4 0 0 0 3 3 0 0 0 10 8 8 FSIP2 0 0 0 0 6 2 0 0 0 8 7 7 SYNE1 0 0 0 0 7 1 0 0 0 8 7 7 BIRC6 0 0 0 0 7 0 0 0 0 7 7 7
plotmafSummary(maf = df , rmOutlier = TRUE , addStat = ' median' dashboard = TRUE , titvRaw = FALSE )
genes %> % dplyr :: filter(Hugo_Symbol %in% nrs )
A data.table: 2 × 13
Hugo_Symbol Frame_Shift_Del Frame_Shift_Ins In_Frame_Del In_Frame_Ins Missense_Mutation Nonsense_Mutation Nonstop_Mutation Splice_Site Translation_Start_Site total MutatedSamples AlteredSamples <chr> <int> <int> <int> <int> <int> <int> <int> <int> <int> <dbl> <int> <int>
AR 0 0 0 0 1 0 0 0 0 1 1 1 PGR 0 0 0 0 1 0 0 0 0 1 1 1
sets = c(" TTN" " TP53" " PIK3CA" sts <- c(sets , nrs )
oncoplot(maf = df , genes = sts )
PIK3CA and MAP3K1 alterations imply luminal A status and are associated with clinical benefit from pan-PI3K inhibitor buparlisib and letrozole in ER+ metastatic breast cancer REF: 31552290
Breast Cancer (MSK, NPJ Breast Cancer 2019)
Samples : 70
df = read.maf(maf = " brca_mskcc_2019_data_mutations.txt" samp = getSampleSummary(df )
head(samp , 10 )-Reading
-Validating
--Removed 1 duplicated variants
-Silent variants: 2
-Summarizing
--Mutiple centers found
MSK-IMPACT341;MSK-IMPACT-Processing clinical data
--Missing clinical data
-Finished in 0.160s elapsed (0.070s cpu)
A data.table: 10 × 10
Tumor_Sample_Barcode Frame_Shift_Del Frame_Shift_Ins In_Frame_Del In_Frame_Ins Missense_Mutation Nonsense_Mutation Splice_Site Translation_Start_Site total <fct> <int> <int> <int> <int> <int> <int> <int> <int> <dbl>
s_DS_bkm_057_T 0 1 0 0 21 2 0 0 24 s_DS_bkm_081_T 0 0 0 0 23 1 0 0 24 s_DS_bkm_067_T 0 2 1 0 16 2 0 0 21 s_DS_bkm_078_T1 0 0 0 1 15 3 0 0 19 s_DS_bkm_078_T2 0 0 0 1 15 3 0 0 19 s_DS_bkm_065_T 2 1 0 1 13 0 0 0 17 s_DS_bkm_020_T 1 0 0 0 11 4 0 0 16 s_DS_bkm_061_T 0 0 0 0 14 0 1 1 16 s_DS_bkm_073_T 2 0 0 0 14 0 0 0 16 s_DS_bkm_076_T 0 0 0 0 15 0 0 0 15
genes = getGeneSummary(df )
head(genes ,10 )
A data.table: 10 × 12
Hugo_Symbol Frame_Shift_Del Frame_Shift_Ins In_Frame_Del In_Frame_Ins Missense_Mutation Nonsense_Mutation Splice_Site Translation_Start_Site total MutatedSamples AlteredSamples <chr> <int> <int> <int> <int> <int> <int> <int> <int> <dbl> <int> <int>
PIK3CA 0 1 1 0 40 0 0 0 42 35 35 TP53 0 1 0 0 20 2 1 0 24 22 22 ATM 0 0 0 0 18 0 1 0 19 16 16 CDH1 4 3 0 0 3 5 1 0 16 15 15 MAP3K1 6 1 0 0 8 3 0 0 18 13 13 GATA3 3 6 1 0 3 0 0 0 13 12 12 KMT2C 4 0 0 0 6 3 0 0 13 12 12 NOTCH2 6 0 0 0 14 0 0 0 20 10 10 ERBB2 0 0 0 0 10 0 0 0 10 10 10 MDC1 0 0 1 0 7 1 0 0 9 9 9
plotmafSummary(maf = df , rmOutlier = TRUE , addStat = ' median' dashboard = TRUE , titvRaw = FALSE )
genes %> % dplyr :: filter(Hugo_Symbol %in% nrs )
A data.table: 2 × 12
Hugo_Symbol Frame_Shift_Del Frame_Shift_Ins In_Frame_Del In_Frame_Ins Missense_Mutation Nonsense_Mutation Splice_Site Translation_Start_Site total MutatedSamples AlteredSamples <chr> <int> <int> <int> <int> <int> <int> <int> <int> <dbl> <int> <int>
ESR1 0 0 0 0 6 0 0 0 6 5 5 AR 0 0 1 0 0 0 0 0 1 1 1
sets = c(" ATM" " TP53" " PIK3CA" sts <- c(sets , nrs )
oncoplot(maf = df , genes = sts )
The clonal and mutational evolution spectrum of primary triple-negative breast cancers REF: 22495314
Breast Invasive Carcinoma (British Columbia, Nature 2012)
Samples : 65
df = read.maf(maf = " brca_bccrc_data_mutations.txt" samp = getSampleSummary(df )
head(samp , 10 )-Reading
-Validating
-Silent variants: 29
-Summarizing
--Mutiple centers found
BC;--Possible FLAGS among top ten genes:
USH2A
-Processing clinical data
--Missing clinical data
-Finished in 0.370s elapsed (0.260s cpu)
A data.table: 10 × 10
Tumor_Sample_Barcode Frame_Shift_Del Frame_Shift_Ins In_Frame_Del In_Frame_Ins Missense_Mutation Nonsense_Mutation Nonstop_Mutation Splice_Site total <fct> <int> <int> <int> <int> <int> <int> <int> <int> <dbl>
SA214 0 0 0 0 174 18 0 1 193 SA106 4 2 2 0 116 3 0 5 132 SA218 7 1 1 0 111 6 0 0 126 SA065 15 0 6 0 85 9 0 1 116 SA071 1 0 0 0 86 1 0 4 92 SA054 2 0 0 0 65 3 0 4 74 SA077 0 0 1 0 64 5 0 0 70 SA031 1 0 0 0 61 2 0 1 65 SA084 0 1 0 0 52 10 0 0 63 SA225 2 0 2 0 52 7 0 0 63
genes = getGeneSummary(df )
head(genes ,10 )
A data.table: 10 × 12
Hugo_Symbol Frame_Shift_Del Frame_Shift_Ins In_Frame_Del In_Frame_Ins Missense_Mutation Nonsense_Mutation Nonstop_Mutation Splice_Site total MutatedSamples AlteredSamples <chr> <int> <int> <int> <int> <int> <int> <int> <int> <dbl> <int> <int>
TP53 1 0 0 0 23 8 0 3 35 35 35 PIK3CA 0 0 1 0 6 0 0 0 7 7 7 USH2A 0 0 0 0 7 0 0 0 7 6 6 MYO3A 0 0 0 0 5 1 0 0 6 6 6 PTEN 2 0 0 0 4 0 0 0 6 5 5 ATR 1 0 0 0 4 0 0 0 5 4 4 COL6A3 0 0 0 0 3 1 0 0 4 4 4 GPR112 0 0 0 0 4 0 0 0 4 4 4 LRP2 0 0 0 0 4 0 0 0 4 4 4 MDN1 0 0 0 0 3 1 0 0 4 4 4
plotmafSummary(maf = df , rmOutlier = TRUE , addStat = ' median' dashboard = TRUE , titvRaw = FALSE )
genes %> % dplyr :: filter(Hugo_Symbol %in% nrs )
A data.table: 1 × 12
Hugo_Symbol Frame_Shift_Del Frame_Shift_Ins In_Frame_Del In_Frame_Ins Missense_Mutation Nonsense_Mutation Nonstop_Mutation Splice_Site total MutatedSamples AlteredSamples <chr> <int> <int> <int> <int> <int> <int> <int> <int> <dbl> <int> <int>
NR3C1 1 0 0 0 2 0 0 0 3 3 3
sets = c(" USH2A" " TP53" " PIK3CA" sts <- c(sets , nrs )
oncoplot(maf = df , genes = sts )
Whole-Exome Sequencing Analysis of the Progression from Non-Low-Grade Ductal Carcinoma In Situ to Invasive Ductal Carcinoma REF: 32220886
Breast Cancer (MSK, Clinical Cancer Res 2020)
Samples: 60
df = read.maf(maf = " brca_pareja_msk_2020_data_mutations.txt" samp = getSampleSummary(df )
head(samp , 10 )-Reading
-Validating
-Silent variants: 45
-Summarizing
--Possible FLAGS among top ten genes:
MUC16
TTN
-Processing clinical data
--Missing clinical data
-Finished in 0.400s elapsed (0.220s cpu)
A data.table: 10 × 10
Tumor_Sample_Barcode Frame_Shift_Del Frame_Shift_Ins In_Frame_Del In_Frame_Ins Missense_Mutation Nonsense_Mutation Nonstop_Mutation Splice_Site total <fct> <int> <int> <int> <int> <int> <int> <int> <int> <dbl>
30DCIS 1 0 0 0 265 34 2 3 305 30IDC 2 0 1 0 214 26 1 3 247 25DCIS 11 0 3 0 156 16 1 2 189 25IDC 11 0 2 0 150 14 1 2 180 19IDC 11 0 4 0 112 2 0 3 132 21IDC 3 0 1 0 110 6 0 3 123 23DCIS 5 1 4 0 100 8 0 4 122 21DCIS 4 0 1 0 100 5 0 3 113 2IDCA 6 1 1 0 95 2 0 3 108 23IDC 4 1 2 0 89 7 0 4 107
genes = getGeneSummary(df )
head(genes ,10 )
A data.table: 10 × 12
Hugo_Symbol Frame_Shift_Del Frame_Shift_Ins In_Frame_Del In_Frame_Ins Missense_Mutation Nonsense_Mutation Nonstop_Mutation Splice_Site total MutatedSamples AlteredSamples <chr> <int> <int> <int> <int> <int> <int> <int> <int> <dbl> <int> <int>
TP53 4 4 2 1 13 4 0 1 29 29 29 PIK3CA 0 2 0 0 22 0 0 0 24 22 22 GATA3 3 8 0 0 1 1 0 2 15 15 15 MUC16 0 0 0 0 9 0 0 0 9 9 9 AGGF1 0 0 0 0 8 0 0 0 8 8 8 TTN 0 0 0 0 9 0 0 0 9 7 7 CDC27 0 0 0 0 6 2 0 0 8 7 7 CCAR1 3 0 0 0 0 4 0 0 7 7 7 KIF5A 0 0 0 0 7 0 0 0 7 7 7 ARHGAP22 0 0 2 0 2 2 0 0 6 6 6
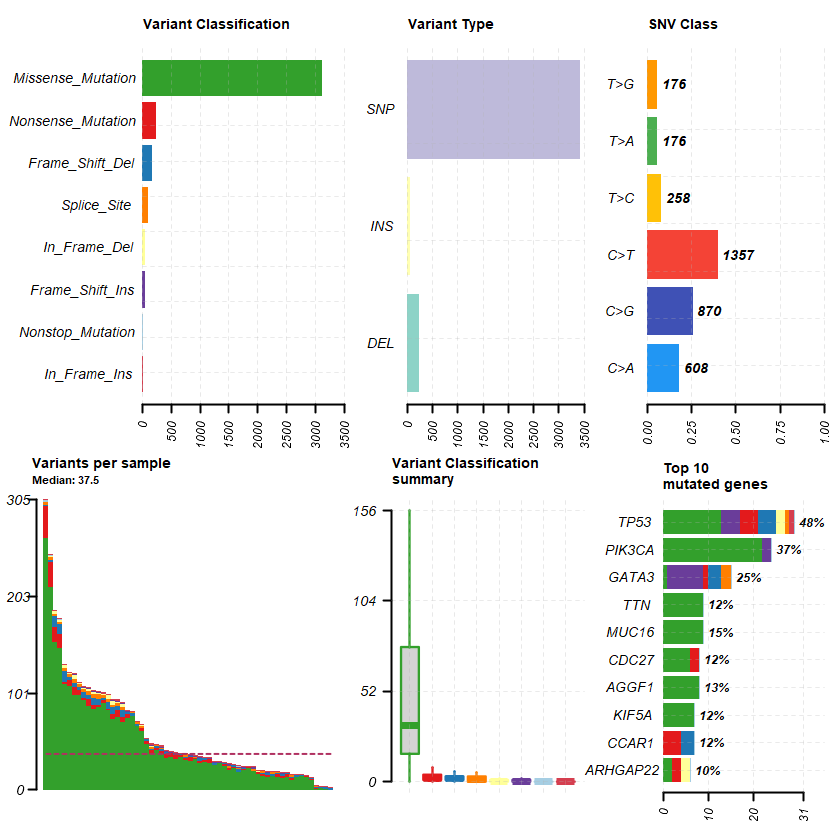
plotmafSummary(maf = df , rmOutlier = TRUE , addStat = ' median' dashboard = TRUE , titvRaw = FALSE )
genes %> % dplyr :: filter(Hugo_Symbol %in% nrs )
A data.table: 0 × 12
Hugo_Symbol Frame_Shift_Del Frame_Shift_Ins In_Frame_Del In_Frame_Ins Missense_Mutation Nonsense_Mutation Nonstop_Mutation Splice_Site total MutatedSamples AlteredSamples <chr> <int> <int> <int> <int> <int> <int> <int> <int> <dbl> <int> <int>
sets = c(" GATA3" " TP53" " PIK3CA" sts <- c(sets , nrs )
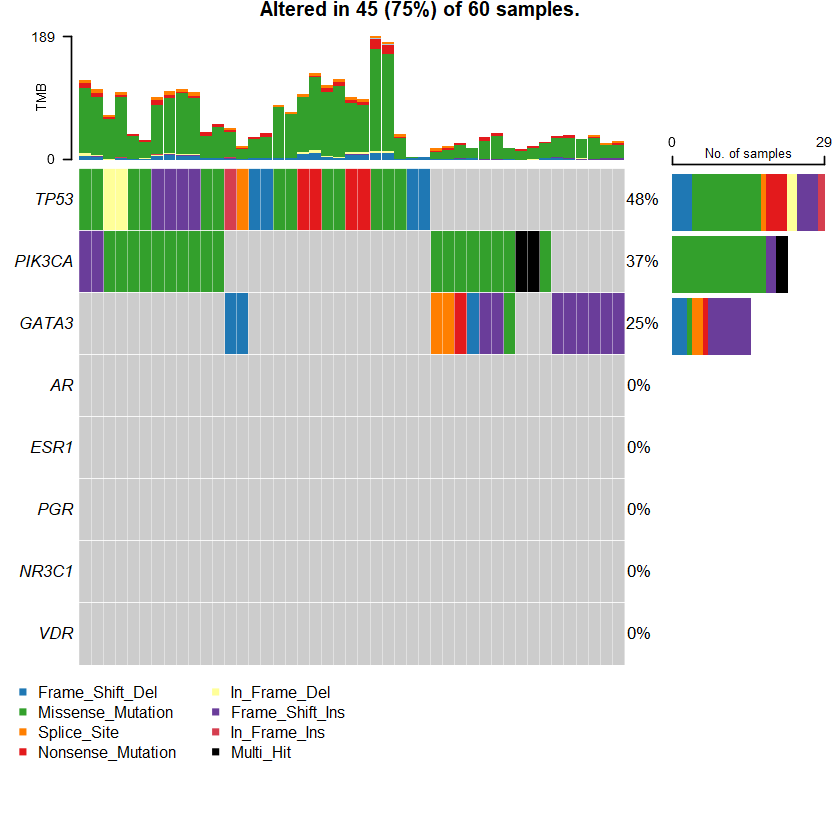
oncoplot(maf = df , genes = sts )
The Metastatic Breast Cancer Project (Provisional, December 2021) Sample: 379
df = read.maf(maf = " brca_mbcproject_2022_data_mutations.txt" samp = getSampleSummary(df )
head(samp , 10 )-Reading
-Validating
-Silent variants: 24952
-Summarizing
--Possible FLAGS among top ten genes:
TTN
MUC16
HMCN1
-Processing clinical data
--Missing clinical data
-Finished in 3.280s elapsed (2.510s cpu)
A data.table: 10 × 11
Tumor_Sample_Barcode Frame_Shift_Del Frame_Shift_Ins In_Frame_Del In_Frame_Ins Missense_Mutation Nonsense_Mutation Nonstop_Mutation Splice_Site Translation_Start_Site total <fct> <int> <int> <int> <int> <int> <int> <int> <int> <int> <dbl>
MBC-MBCProject_7wCjtKIW-Tumor-SM-GQCN4 8 4 1 0 1076 123 0 10 2 1224 MBC-MBCProject_57iLiJIl-Tumor-SM-CGLIV 2 0 0 0 650 65 2 8 4 731 RP-1156_MBCProject_JXUNUQI8_BLOOD_P_v1_Exome 1 0 1 0 488 60 0 15 0 565 RP-1156_MBCProject_rLt0uZhz_BLOOD_P_v1_Exome 1 1 1 0 330 31 2 5 0 371 RP-1156_MBCProject_bBIxhQUD_BLOOD_P_v2_Exome 2 0 0 1 314 35 0 5 1 358 MBC-MBCProject_K7f6fdUz-Tumor-SM-AZ5MA 1 0 0 0 311 28 1 6 0 347 RP-1156_MBCProject_0jUXcgsJ_BLOOD_P_v2_Exome 2 1 1 0 288 26 1 5 0 324 RP-1156_MBCProject_W4FBsLSx_T3_v2_Exome 3 5 1 0 269 28 0 3 0 309 MBC-MBCProject_99CdCOHm-Tumor-SM-CGLF4 1 2 0 0 270 2 1 1 0 277 RP-1156_MBCProject_W4FBsLSx_T1_v2_Exome 2 0 1 0 242 27 2 1 1 276
genes = getGeneSummary(df )
head(genes ,10 )
A data.table: 10 × 13
Hugo_Symbol Frame_Shift_Del Frame_Shift_Ins In_Frame_Del In_Frame_Ins Missense_Mutation Nonsense_Mutation Nonstop_Mutation Splice_Site Translation_Start_Site total MutatedSamples AlteredSamples <chr> <int> <int> <int> <int> <int> <int> <int> <int> <int> <dbl> <int> <int>
TP53 10 7 4 0 78 11 0 4 0 114 112 112 TTN 1 2 0 0 90 9 0 0 0 102 81 81 PIK3CA 0 1 1 0 76 0 0 0 0 78 76 76 CDH1 11 5 0 0 10 19 0 7 2 54 54 54 IGDCC4 0 0 0 0 120 0 0 0 0 120 50 50 ESR1 0 0 0 0 49 1 0 0 0 50 43 43 MUC16 0 2 1 1 39 2 0 1 0 46 40 40 HMCN1 0 3 0 0 32 1 0 3 0 39 38 38 ZKSCAN1 0 34 0 0 2 2 0 0 0 38 37 37 GIMAP6 0 0 0 0 41 3 0 0 0 44 36 36
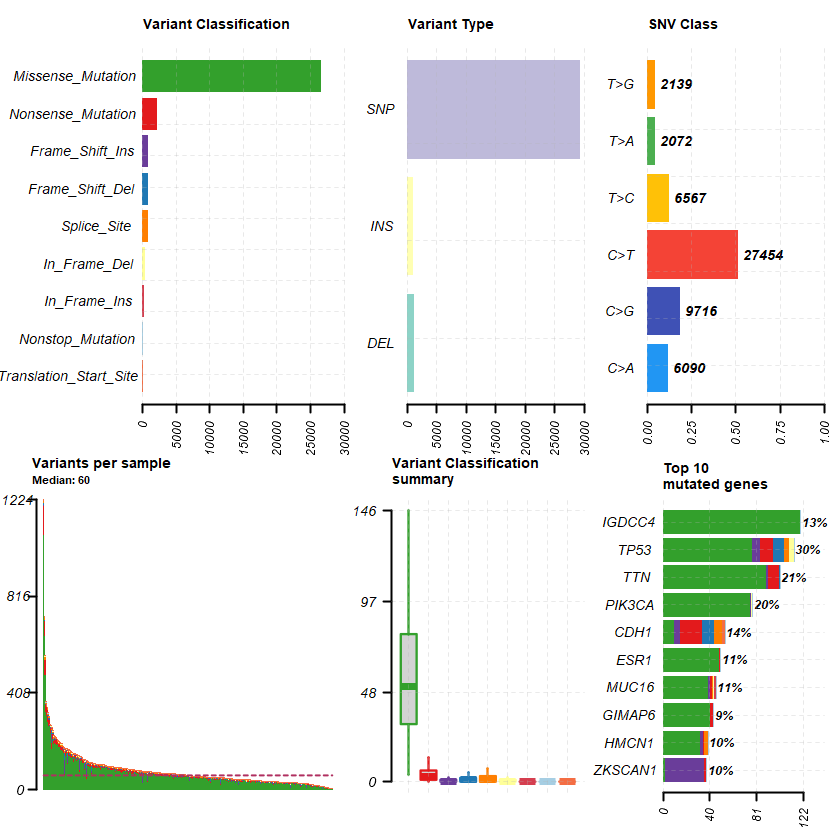
plotmafSummary(maf = df , rmOutlier = TRUE , addStat = ' median' dashboard = TRUE , titvRaw = FALSE )
genes %> % dplyr :: filter(Hugo_Symbol %in% nrs )
A data.table: 4 × 13
Hugo_Symbol Frame_Shift_Del Frame_Shift_Ins In_Frame_Del In_Frame_Ins Missense_Mutation Nonsense_Mutation Nonstop_Mutation Splice_Site Translation_Start_Site total MutatedSamples AlteredSamples <chr> <int> <int> <int> <int> <int> <int> <int> <int> <int> <dbl> <int> <int>
ESR1 0 0 0 0 49 1 0 0 0 50 43 43 PGR 0 0 0 0 4 0 0 0 0 4 4 4 NR3C1 0 0 0 0 1 0 0 1 0 2 2 2 VDR 0 0 0 0 0 1 0 0 0 1 1 1
sets = c(" TTN" " TP53" " PIK3CA" sts <- c(sets , nrs )
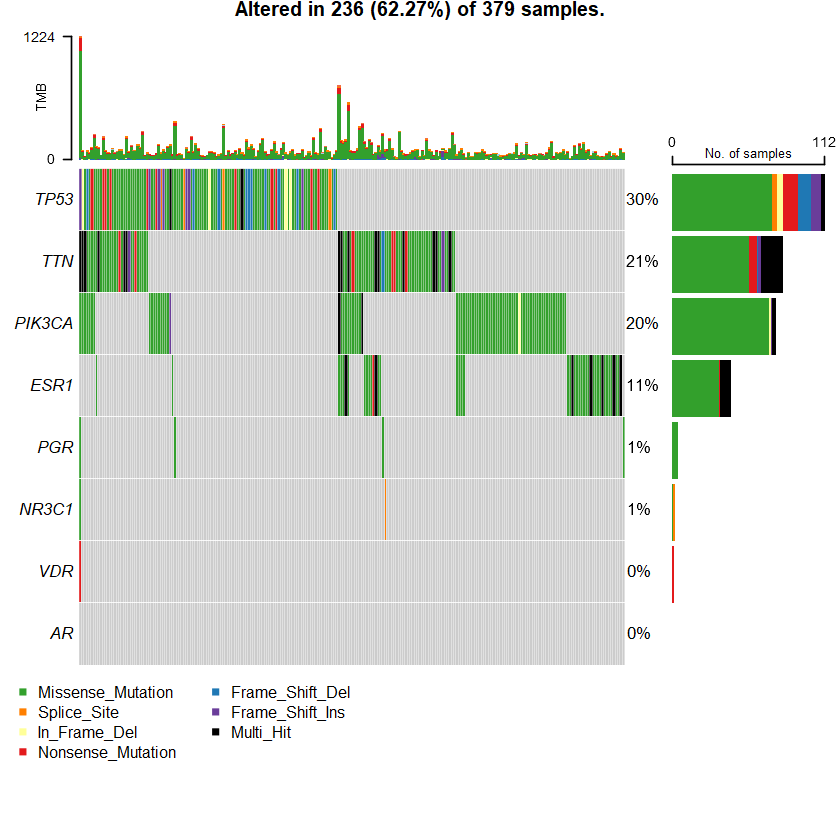
oncoplot(maf = df , genes = sts )
Mutational Profile of Metastatic Breast Cancers: A Retrospective Analysis REF: 28027327
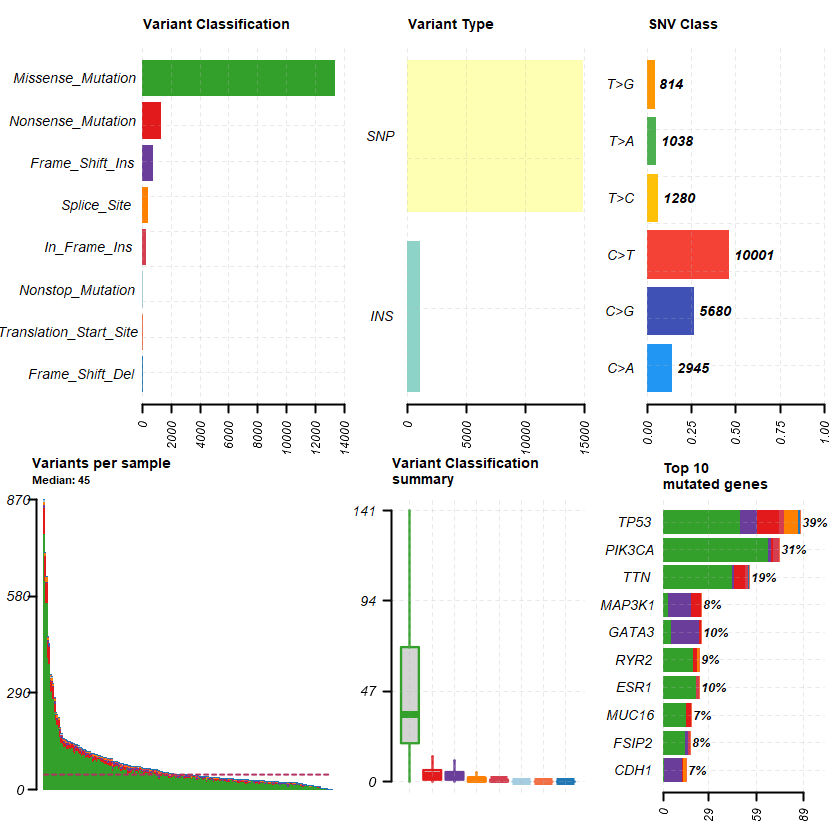
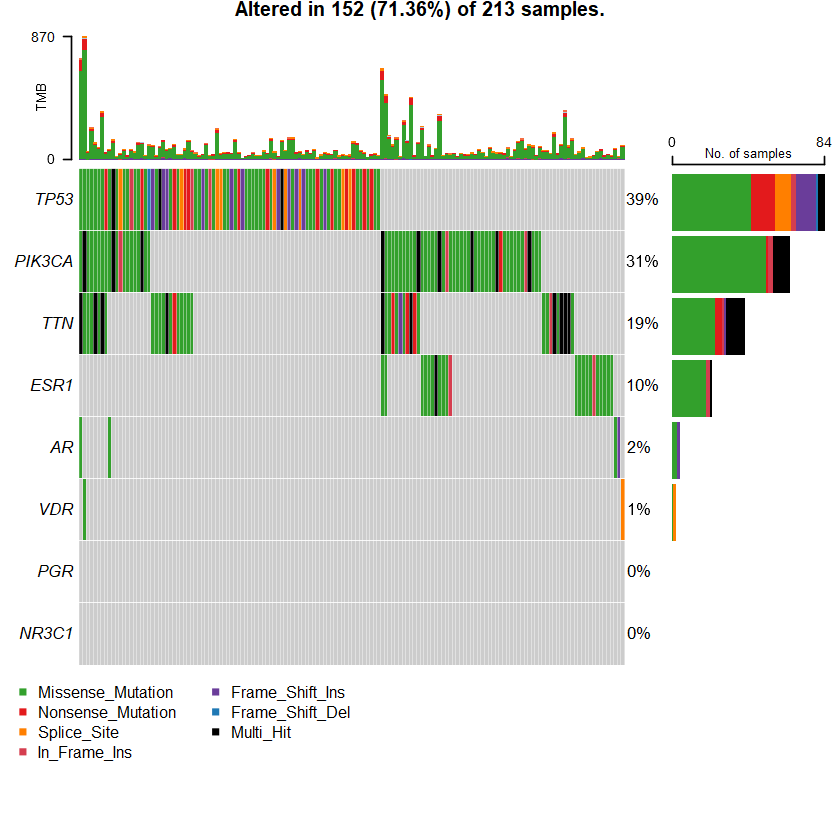
Metastatic Breast Cancer (INSERM, PLoS Med 2016)
Samples: 216
df = read.maf(maf = " brca_igr_2015_data_mutations.txt" samp = getSampleSummary(df )
head(samp , 10 )-Reading
-Validating
-Silent variants: 7046
-Summarizing
--Possible FLAGS among top ten genes:
TTN
MUC16
-Processing clinical data
--Missing clinical data
-Finished in 1.670s elapsed (1.170s cpu)
A data.table: 10 × 10
Tumor_Sample_Barcode Frame_Shift_Del Frame_Shift_Ins In_Frame_Ins Missense_Mutation Nonsense_Mutation Nonstop_Mutation Splice_Site Translation_Start_Site total <fct> <int> <int> <int> <int> <int> <int> <int> <int> <dbl>
MBC_189 0 8 0 769 79 4 10 0 870 MBC_8 0 2 0 628 74 1 4 2 711 MBC_45 0 5 0 563 58 2 13 0 641 MBC_71 0 8 1 396 48 1 6 0 460 MBC_82 1 7 0 379 50 0 1 0 438 MBC_207 0 3 3 295 33 2 4 5 345 MBC_92 0 3 1 296 29 3 8 0 340 MBC_29 0 2 1 272 38 1 6 0 320 MBC_31 0 10 1 234 23 0 7 1 276 MBC_145 0 1 0 210 16 2 3 0 232
genes = getGeneSummary(df )
head(genes ,10 )
A data.table: 10 × 12
Hugo_Symbol Frame_Shift_Del Frame_Shift_Ins In_Frame_Ins Missense_Mutation Nonsense_Mutation Nonstop_Mutation Splice_Site Translation_Start_Site total MutatedSamples AlteredSamples <chr> <int> <int> <int> <int> <int> <int> <int> <int> <dbl> <int> <int>
TP53 1 11 3 49 14 0 9 0 87 84 84 PIK3CA 0 2 4 67 1 0 0 0 74 65 65 TTN 1 1 2 44 7 0 0 0 55 40 40 GATA3 0 18 0 5 1 0 0 0 24 22 22 ESR1 0 0 2 21 0 0 0 0 23 22 22 RYR2 0 0 0 19 3 0 1 0 23 19 19 MAP3K1 0 15 0 3 6 0 0 0 24 18 18 FSIP2 0 2 1 14 0 0 0 0 17 16 16 CDH1 0 11 0 1 1 0 2 0 15 15 15 MUC16 0 0 0 15 3 0 0 0 18 14 14
plotmafSummary(maf = df , rmOutlier = TRUE , addStat = ' median' dashboard = TRUE , titvRaw = FALSE ) Warning message in titv(maf = maf, useSyn = TRUE, plot = FALSE):
"Non standard Ti/Tv class: 4TRUE"
genes %> % dplyr :: filter(Hugo_Symbol %in% nrs )
A data.table: 3 × 12
Hugo_Symbol Frame_Shift_Del Frame_Shift_Ins In_Frame_Ins Missense_Mutation Nonsense_Mutation Nonstop_Mutation Splice_Site Translation_Start_Site total MutatedSamples AlteredSamples <chr> <int> <int> <int> <int> <int> <int> <int> <int> <dbl> <int> <int>
ESR1 0 0 2 21 0 0 0 0 23 22 22 AR 0 1 0 3 0 0 0 0 4 4 4 VDR 0 0 0 1 0 0 1 0 2 2 2
sets = c(" TTN" " TP53" " PIK3CA" sts <- c(sets , nrs )
oncoplot(maf = df , genes = sts )
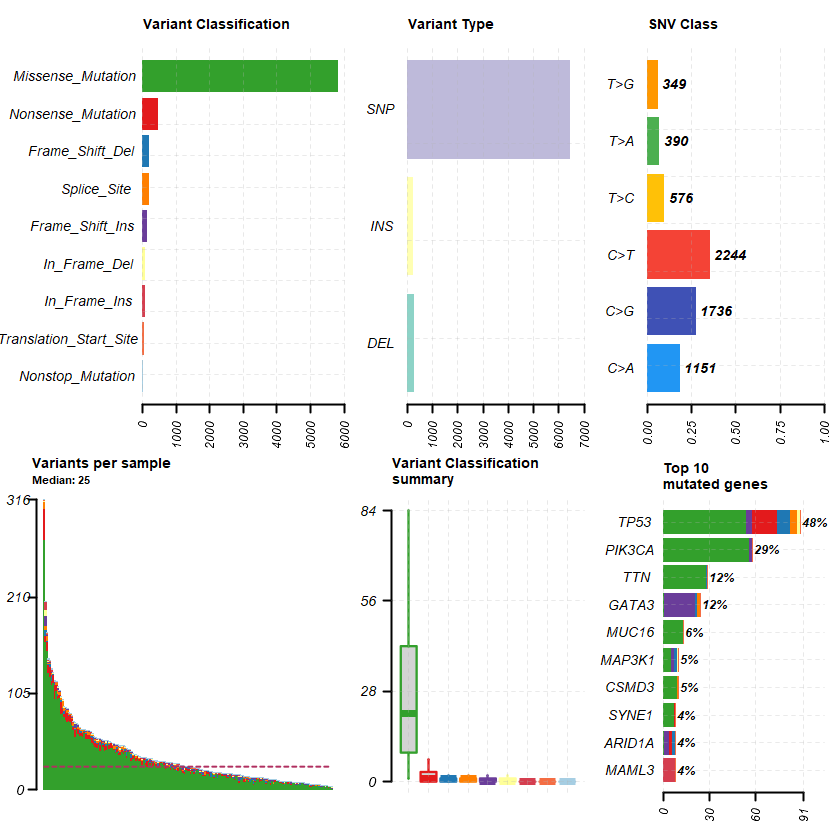
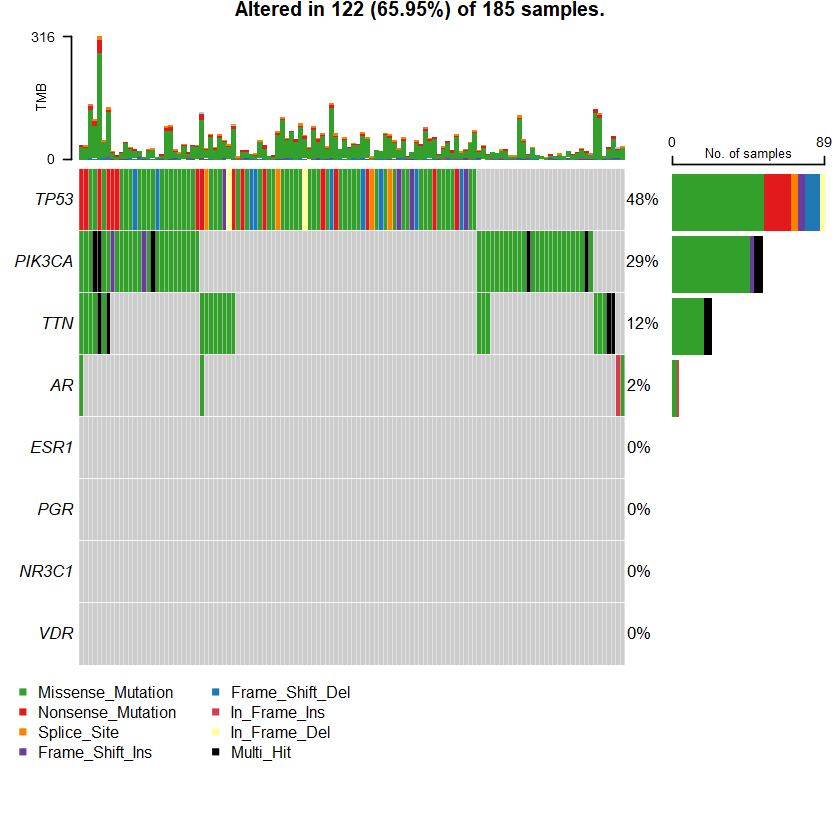
Multi-omics profiling of younger Asian breast cancers reveals distinctive molecular signatures REF: 29713003
Breast Cancer (SMC 2018)
Samples : 186
df = read.maf(maf = " brca_smc_2018_data_mutations.txt" samp = getSampleSummary(df )
head(samp , 10 )-Reading
-Validating
-Silent variants: 22
-Summarizing
--Possible FLAGS among top ten genes:
TTN
MUC16
SYNE1
-Processing clinical data
--Missing clinical data
-Finished in 0.780s elapsed (0.540s cpu)
A data.table: 10 × 11
Tumor_Sample_Barcode Frame_Shift_Del Frame_Shift_Ins In_Frame_Del In_Frame_Ins Missense_Mutation Nonsense_Mutation Nonstop_Mutation Splice_Site Translation_Start_Site total <fct> <int> <int> <int> <int> <int> <int> <int> <int> <int> <dbl>
brca_smc_2018_BB01_111 1 0 1 0 273 33 0 7 1 316 brca_smc_2018_BR255 7 11 6 9 161 7 0 4 0 205 brca_smc_2018_BB01_103 2 1 0 1 152 9 0 5 1 171 brca_smc_2018_BB01_112 2 1 1 1 128 8 1 1 0 143 brca_smc_2018_BB01_047 3 1 0 0 123 11 0 2 1 141 brca_smc_2018_BR097 6 1 0 2 115 4 1 3 0 132 brca_smc_2018_BB01_061 1 0 1 0 117 9 0 0 0 128 brca_smc_2018_BB01_088 1 2 0 0 99 16 1 0 0 119 brca_smc_2018_BB01_099 0 0 0 0 108 7 0 2 1 118 brca_smc_2018_BR069 2 2 1 0 99 4 0 4 0 112
genes = getGeneSummary(df )
head(genes ,10 )
A data.table: 10 × 13
Hugo_Symbol Frame_Shift_Del Frame_Shift_Ins In_Frame_Del In_Frame_Ins Missense_Mutation Nonsense_Mutation Nonstop_Mutation Splice_Site Translation_Start_Site total MutatedSamples AlteredSamples <chr> <int> <int> <int> <int> <int> <int> <int> <int> <int> <dbl> <int> <int>
TP53 9 4 2 0 54 16 0 4 0 89 89 89 PIK3CA 0 2 0 0 56 0 0 0 0 58 53 53 TTN 1 0 0 0 28 0 0 0 0 29 23 23 GATA3 1 20 0 0 1 0 0 2 0 24 23 23 MUC16 0 0 0 0 13 0 0 0 0 13 12 12 CSMD3 0 0 0 0 9 0 0 1 0 10 9 9 MAP3K1 2 2 1 0 5 0 0 0 0 10 9 9 MAML3 0 0 0 8 0 0 0 0 0 8 8 8 ARID1A 2 3 0 0 1 2 0 0 0 8 7 7 SYNE1 0 0 0 0 7 1 0 0 0 8 7 7
plotmafSummary(maf = df , rmOutlier = TRUE , addStat = ' median' dashboard = TRUE , titvRaw = FALSE )
genes %> % dplyr :: filter(Hugo_Symbol %in% nrs )
A data.table: 1 × 13
Hugo_Symbol Frame_Shift_Del Frame_Shift_Ins In_Frame_Del In_Frame_Ins Missense_Mutation Nonsense_Mutation Nonstop_Mutation Splice_Site Translation_Start_Site total MutatedSamples AlteredSamples <chr> <int> <int> <int> <int> <int> <int> <int> <int> <int> <dbl> <int> <int>
AR 0 0 0 1 3 0 0 0 0 4 4 4
sets = c(" TTN" " TP53" " PIK3CA" sts <- c(sets , nrs )
oncoplot(maf = df , genes = sts )
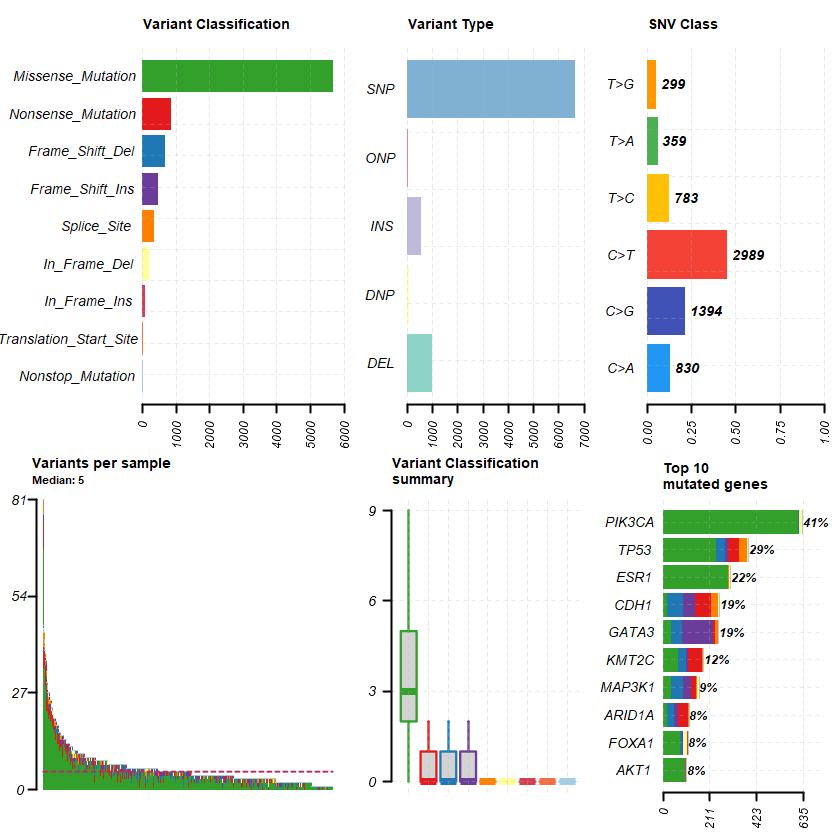
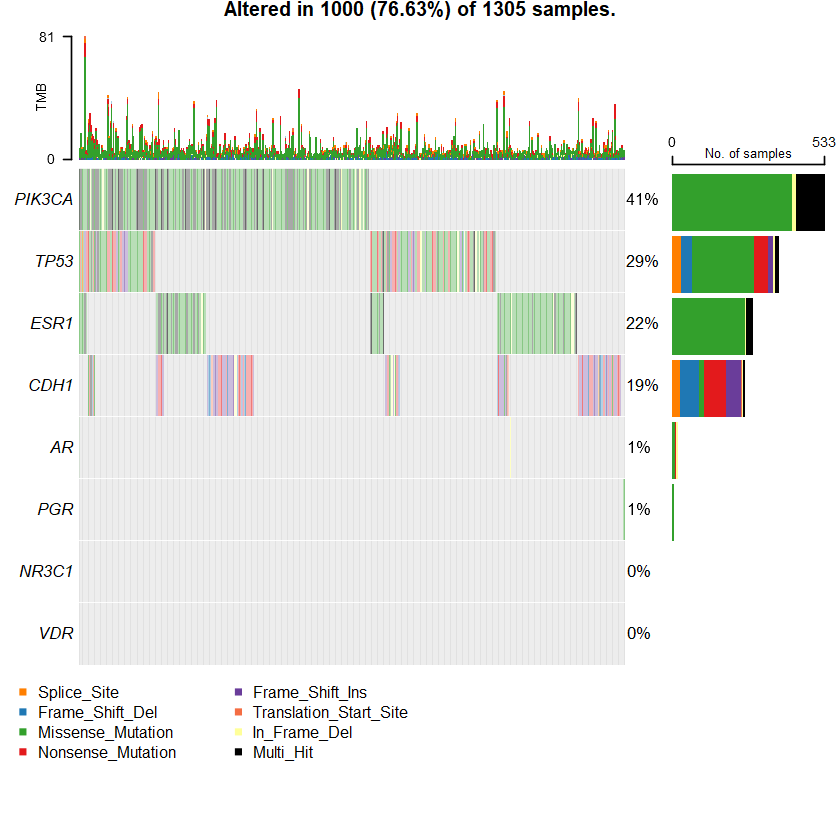
INK4 Tumor Suppressor Proteins Mediate Resistance to CDK4/6 Kinase Inhibitors Metastatic Breast Cancer (MSK, Cancer Discovery 2022)
REF: 34544752
Samples: 1365
df = read.maf(maf = " breast_ink4_msk_2021_data_mutations.txt" -Reading
-Validating
--Removed 24 duplicated variants
-Silent variants: 21
-Summarizing
--Mutiple centers found
MSKCC;-Processing clinical data
--Missing clinical data
-Finished in 0.610s elapsed (0.400s cpu)
samp = getSampleSummary(df )
head(samp , 10 )
A data.table: 10 × 11
Tumor_Sample_Barcode Frame_Shift_Del Frame_Shift_Ins In_Frame_Del In_Frame_Ins Missense_Mutation Nonsense_Mutation Nonstop_Mutation Splice_Site Translation_Start_Site total <fct> <int> <int> <int> <int> <int> <int> <int> <int> <int> <dbl>
P-0039857-T01-IM6 0 1 0 0 67 9 0 3 1 81 P-0009602-T01-IM5 1 0 0 0 40 5 0 0 0 46 P-0011567-T02-IM6 0 0 1 0 34 7 1 2 0 45 P-0004987-T01-IM5 1 1 0 0 34 4 0 4 0 44 P-0002713-T01-IM3 0 0 0 0 37 3 1 1 0 42 P-0009364-T02-IM6 1 2 0 0 34 3 0 1 0 41 P-0027986-T01-IM6 0 1 0 0 31 6 0 2 0 40 P-0002124-T01-IM3 0 0 0 0 35 4 0 0 0 39 P-0030930-T01-IM6 5 0 1 0 28 4 0 1 0 39 P-0003233-T04-IM6 0 0 0 0 34 3 1 0 0 38
genes = getGeneSummary(df )
head(genes ,10 )
A data.table: 10 × 13
Hugo_Symbol Frame_Shift_Del Frame_Shift_Ins In_Frame_Del In_Frame_Ins Missense_Mutation Nonsense_Mutation Nonstop_Mutation Splice_Site Translation_Start_Site total MutatedSamples AlteredSamples <chr> <int> <int> <int> <int> <int> <int> <int> <int> <int> <dbl> <int> <int>
PIK3CA 2 0 17 0 614 0 0 0 0 633 533 533 TP53 40 17 6 0 240 49 0 35 0 387 373 373 ESR1 1 1 6 0 296 0 0 1 0 305 283 283 CDH1 69 54 4 0 21 76 0 29 3 256 253 253 GATA3 52 142 2 1 35 6 0 14 0 252 245 245 KMT2C 37 7 2 0 68 66 0 3 0 183 152 152 MAP3K1 54 36 5 0 37 25 0 5 0 162 123 123 ARID1A 32 19 0 0 20 43 0 3 0 117 104 104 AKT1 0 0 1 4 100 1 0 0 0 106 104 104 FOXA1 10 3 19 2 77 1 0 0 0 112 103 103
plotmafSummary(maf = df , rmOutlier = TRUE , addStat = ' median' dashboard = TRUE , titvRaw = FALSE )
genes %> % dplyr :: filter(Hugo_Symbol %in% nrs )
A data.table: 3 × 13
Hugo_Symbol Frame_Shift_Del Frame_Shift_Ins In_Frame_Del In_Frame_Ins Missense_Mutation Nonsense_Mutation Nonstop_Mutation Splice_Site Translation_Start_Site total MutatedSamples AlteredSamples <chr> <int> <int> <int> <int> <int> <int> <int> <int> <int> <dbl> <int> <int>
ESR1 1 1 6 0 296 0 0 1 0 305 283 283 AR 0 0 2 0 14 3 0 0 0 19 19 19 PGR 0 0 0 0 7 0 0 0 0 7 7 7
sets = c(" CDH1" " TP53" " PIK3CA" sts <- c(sets , nrs )
oncoplot(maf = df , genes = sts )
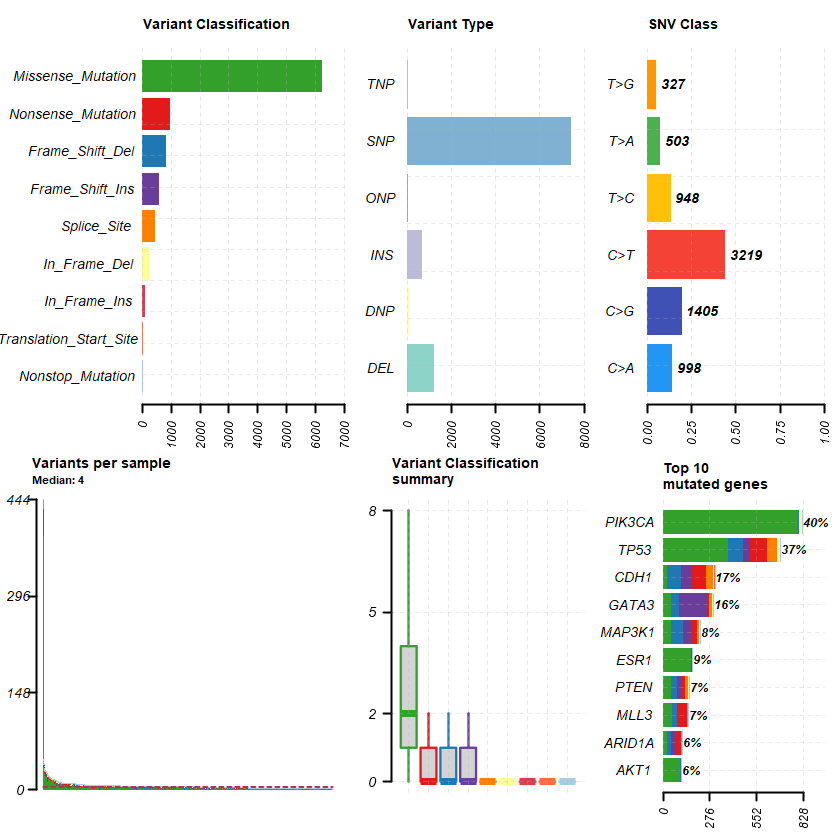
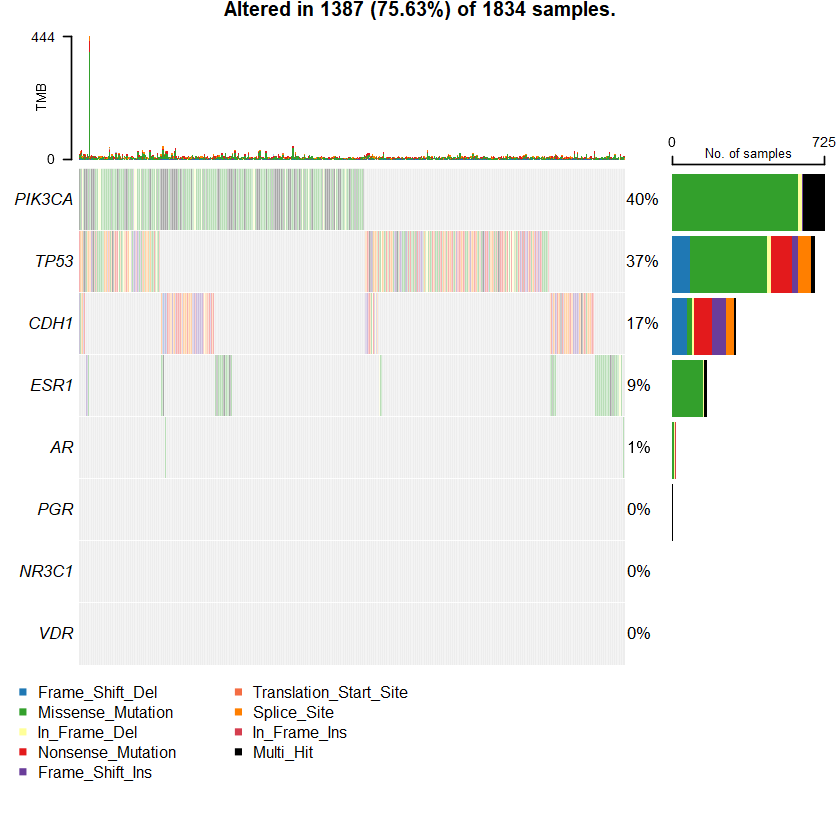
The Genomic Landscape of Endocrine-Resistant Advanced Breast Cancers Breast Cancer (MSK, Cancer Cell 2018)
REF: 30205045
Samples: 1918
df = read.maf(" breast_msk_2018_data_mutations.txt" samp = getSampleSummary(df )
head(samp , 10 )-Reading
-Validating
--Removed 50 duplicated variants
-Silent variants: 46
-Summarizing
--Mutiple centers found
MSKCC;-Processing clinical data
--Missing clinical data
-Finished in 1.020s elapsed (0.660s cpu)
A data.table: 10 × 11
Tumor_Sample_Barcode Frame_Shift_Del Frame_Shift_Ins In_Frame_Del In_Frame_Ins Missense_Mutation Nonsense_Mutation Nonstop_Mutation Splice_Site Translation_Start_Site total <fct> <int> <int> <int> <int> <int> <int> <int> <int> <int> <dbl>
P-0016773-T01-IM6 0 0 0 0 389 41 0 14 0 444 P-0009602-T01-IM5 1 0 0 0 40 5 0 0 0 46 P-0004987-T01-IM5 1 1 0 0 34 4 0 4 0 44 P-0002713-T01-IM3 0 0 0 0 37 3 1 1 0 42 P-0002124-T01-IM3 0 0 0 0 35 4 0 0 0 39 P-0002713-T02-IM6 0 0 0 0 29 6 0 0 1 36 P-0000138-T01-IM3 1 0 0 0 24 7 0 1 0 33 P-0002858-T01-IM3 1 0 0 0 29 1 0 1 0 32 P-0004555-T01-IM5 1 0 0 0 23 7 0 0 0 31 P-0014136-T01-IM5 0 0 0 0 29 2 0 0 0 31
genes = getGeneSummary(df )
head(genes ,10 )
A data.table: 10 × 13
Hugo_Symbol Frame_Shift_Del Frame_Shift_Ins In_Frame_Del In_Frame_Ins Missense_Mutation Nonsense_Mutation Nonstop_Mutation Splice_Site Translation_Start_Site total MutatedSamples AlteredSamples <chr> <int> <int> <int> <int> <int> <int> <int> <int> <int> <dbl> <int> <int>
PIK3CA 3 1 20 1 801 0 0 0 0 826 725 725 TP53 90 34 19 2 385 106 0 59 0 695 680 680 CDH1 80 66 7 0 25 86 0 38 4 306 303 303 GATA3 51 168 5 1 47 7 0 19 0 298 288 288 ESR1 0 1 4 0 168 1 0 1 0 175 164 164 MAP3K1 69 50 5 0 48 35 0 13 0 220 155 155 PTEN 34 22 7 0 51 27 0 14 0 155 137 137 MLL3 27 9 2 0 55 50 0 5 0 148 130 130 AKT1 1 0 0 3 104 1 0 0 0 109 107 107 ARID1A 27 20 1 1 24 36 0 4 0 113 106 106
plotmafSummary(maf = df , rmOutlier = TRUE , addStat = ' median' dashboard = TRUE , titvRaw = FALSE )
genes %> % dplyr :: filter(Hugo_Symbol %in% nrs )
A data.table: 3 × 13
Hugo_Symbol Frame_Shift_Del Frame_Shift_Ins In_Frame_Del In_Frame_Ins Missense_Mutation Nonsense_Mutation Nonstop_Mutation Splice_Site Translation_Start_Site total MutatedSamples AlteredSamples <chr> <int> <int> <int> <int> <int> <int> <int> <int> <int> <dbl> <int> <int>
ESR1 0 1 4 0 168 1 0 1 0 175 164 164 AR 0 0 2 1 14 2 0 0 0 19 19 19 PGR 0 0 0 0 3 1 0 1 0 5 4 4
sets = c(" CDH1" " TP53" " PIK3CA" sts <- c(sets , nrs )
oncoplot(maf = df , genes = sts )
The Analysis is Completed. Below are test data. Don't Consider dplyr :: filter(as.data.frame(genes ),
Hugo_Symbol == " ESR1" | Hugo_Symbol == " PGR" | Hugo_Symbol == " NR3C1" | Hugo_Symbol == " AR"
A data.frame: 3 × 13
Hugo_Symbol Frame_Shift_Del Frame_Shift_Ins In_Frame_Del In_Frame_Ins Missense_Mutation Nonsense_Mutation Nonstop_Mutation Splice_Site Translation_Start_Site total MutatedSamples AlteredSamples <chr> <int> <int> <int> <int> <int> <int> <int> <int> <int> <dbl> <int> <int>
ESR1 0 1 4 0 168 1 0 1 0 175 164 164 AR 0 0 2 1 14 2 0 0 0 19 19 19 PGR 0 0 0 0 3 1 0 1 0 5 4 4
rows_to_filter <- c(" AR" " ESR1" " PGR" " NR3C1" " VDR" genes %> % dplyr :: filter(Hugo_Symbol %in% rows_to_filter )
A data.table: 3 × 13
Hugo_Symbol Frame_Shift_Del Frame_Shift_Ins In_Frame_Del In_Frame_Ins Missense_Mutation Nonsense_Mutation Nonstop_Mutation Splice_Site Translation_Start_Site total MutatedSamples AlteredSamples <chr> <int> <int> <int> <int> <int> <int> <int> <int> <int> <dbl> <int> <int>
ESR1 0 1 4 0 168 1 0 1 0 175 164 164 AR 0 0 2 1 14 2 0 0 0 19 19 19 PGR 0 0 0 0 3 1 0 1 0 5 4 4
genes = c(" TP53" " PIK3CA" " GATA3" " NR3C1" " PGR" " AR" " ESR1" oncoplot(maf = df , genes = genes )
# First, let's create your dataframedata <- data.frame (
ID = c(" a1" " a2" " a3" " a4" " a5" " a6" " a7" " a8" " a9" " a10" " a11" " a12" SA1 = c(9 , 2 , 10 , 4 , 0 , 10 , 1 , 8 , 5 , 1 , 1 , 5 ),
SA2 = c(10 , 8 , 1 , 7 , 0 , 4 , 0 , 1 , 9 , 9 , 2 , 5 ),
SA3 = c(9 , 2 , 10 , 2 , 3 , 3 , 5 , 1 , 5 , 9 , 5 , 0 ),
SA4 = c(5 , 9 , 0 , 9 , 2 , 1 , 9 , 3 , 9 , 1 , 1 , 6 ),
SA5 = c(8 , 10 , 9 , 2 , 8 , 9 , 8 , 7 , 10 , 6 , 10 , 7 ),
SA6 = c(0 , 10 , 2 , 4 , 0 , 2 , 7 , 7 , 4 , 6 , 4 , 7 ),
SA7 = c(2 , 5 , 2 , 4 , 1 , 4 , 6 , 5 , 7 , 3 , 6 , 6 ))
data
# # Define the list of rows you want to filter# rows_to_filter <- c("a2", "a5", "a6", "a9", "a11")# # Filter the dataframe based on the specified rows# filtered_data <- data %>% filter(ID %in% rows_to_filter)# # Print the filtered dataframe# filtered_data
A data.frame: 12 × 8
ID SA1 SA2 SA3 SA4 SA5 SA6 SA7 <chr> <dbl> <dbl> <dbl> <dbl> <dbl> <dbl> <dbl>
a1 9 10 9 5 8 0 2 a2 2 8 2 9 10 10 5 a3 10 1 10 0 9 2 2 a4 4 7 2 9 2 4 4 a5 0 0 3 2 8 0 1 a6 10 4 3 1 9 2 4 a7 1 0 5 9 8 7 6 a8 8 1 1 3 7 7 5 a9 5 9 5 9 10 4 7 a10 1 9 9 1 6 6 3 a11 1 2 5 1 10 4 6 a12 5 5 0 6 7 7 6
# Define the list of columns you want to filtercolumns_to_filter <- c(" SA1" " SA3" " SA4" " SA7" " AGFH" # Find the intersection of specified columns and existing columns in the dataframevalid_columns <- intersect(columns_to_filter , colnames(data ))
valid_columns 'SA1' 'SA3' 'SA4' 'SA7' # Filter the dataframe based on the valid columnsfiltered_data <- data [, c(" ID" valid_columns )]
filtered_data
A data.frame: 12 × 5
ID SA1 SA3 SA4 SA7 <chr> <dbl> <dbl> <dbl> <dbl>
a1 9 9 5 2 a2 2 2 9 5 a3 10 10 0 2 a4 4 2 9 4 a5 0 3 2 1 a6 10 3 1 4 a7 1 5 9 6 a8 8 1 3 5 a9 5 5 9 7 a10 1 9 1 3 a11 1 5 1 6 a12 5 0 6 6
# Define the list of columns you want to filtercolumns_to_filter <- c(" SA1" " SA3" " SA4" " SA7" " AGFH" # Find the intersection of specified columns and existing columns in the dataframevalid_columns <- intersect(columns_to_filter , colnames(data ))
# Filter the dataframe based on the valid columnsfiltered_data <- data [, c(" ID" valid_columns )]
# Print the filtered dataframefiltered_data )


