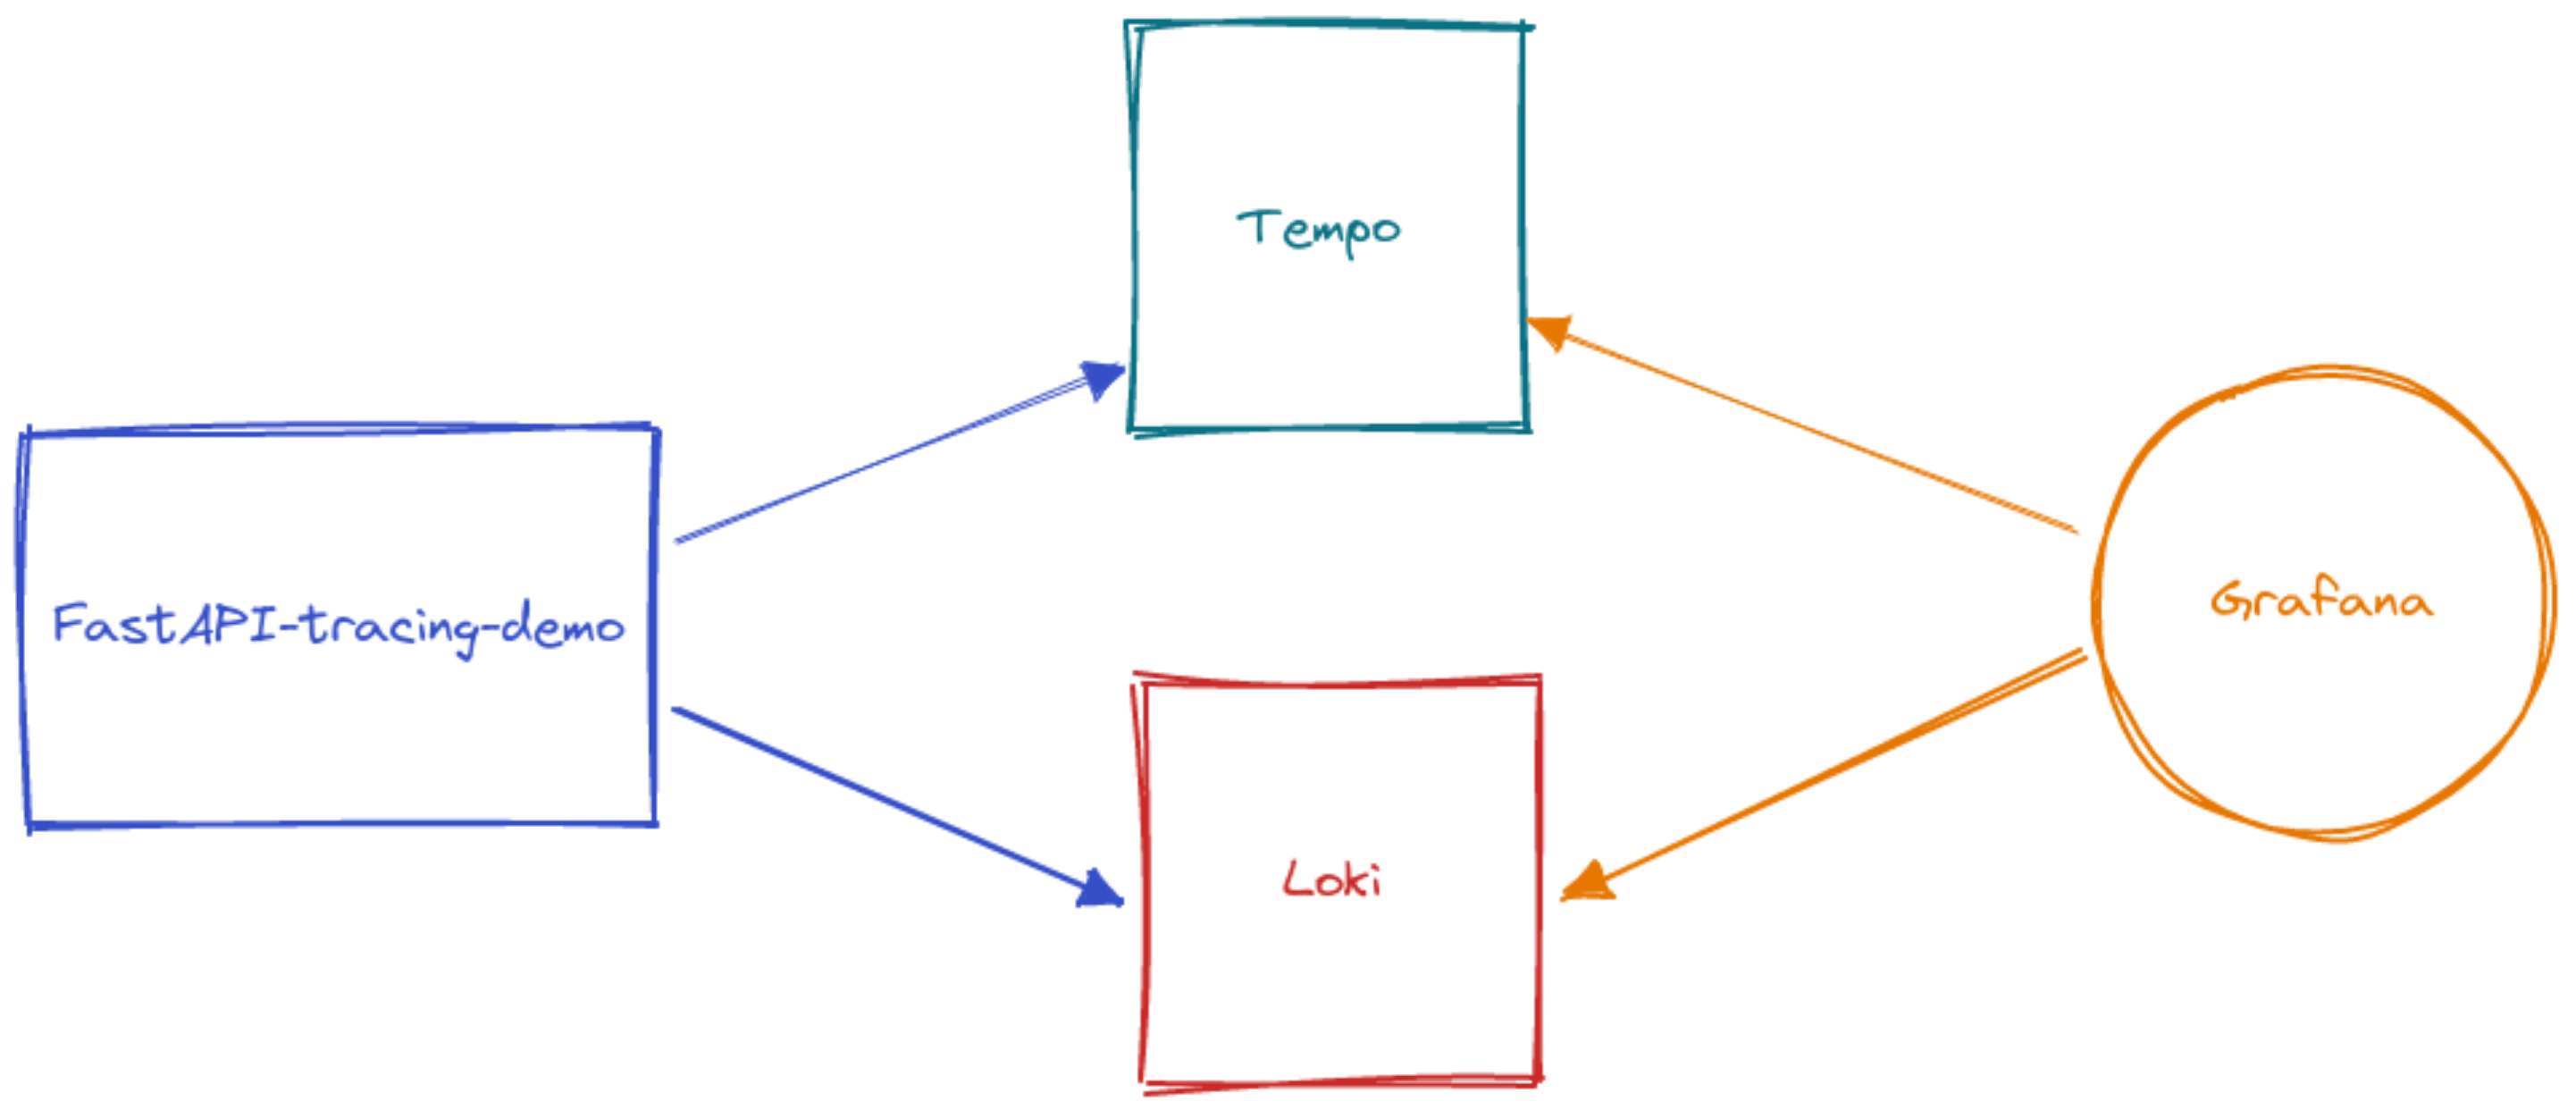
Demo to show how to instrument a FastAPI python project adding tracing with OpnTelemetry and send/show traces in Grafana Tempo
- docker
- docker-compose
- loki docker plugin
You can install the Loki Docker plugin using:
docker plugin install grafana/loki-docker-driver:latest --alias loki --grant-all-permissions
The main branch contains the basic app, before instrumenting with OpenTelemetry but with Grafana, Tempo and Loki available.
The instrumented branch is the instrumented app, the outcome of going through the demo steps below.
To bring up the services and test the app, run make up
The Grafana dashboard will be available at http://localhost:5000
You can access the application swagger at http://localhost:8080/docs
You can make a call from there to the pokemon api or using an http client:
http http://localhost:8080/pokemon/ditto

HTTP/1.1 200 OK
content-length: 62
content-type: application/json
date: Tue, 01 Feb 2022 10:41:14 GMT
server: uvicorn

{
    "generation": {
        "name": "generation-i"
    },
    "id": 132,
    "name": "ditto"
}
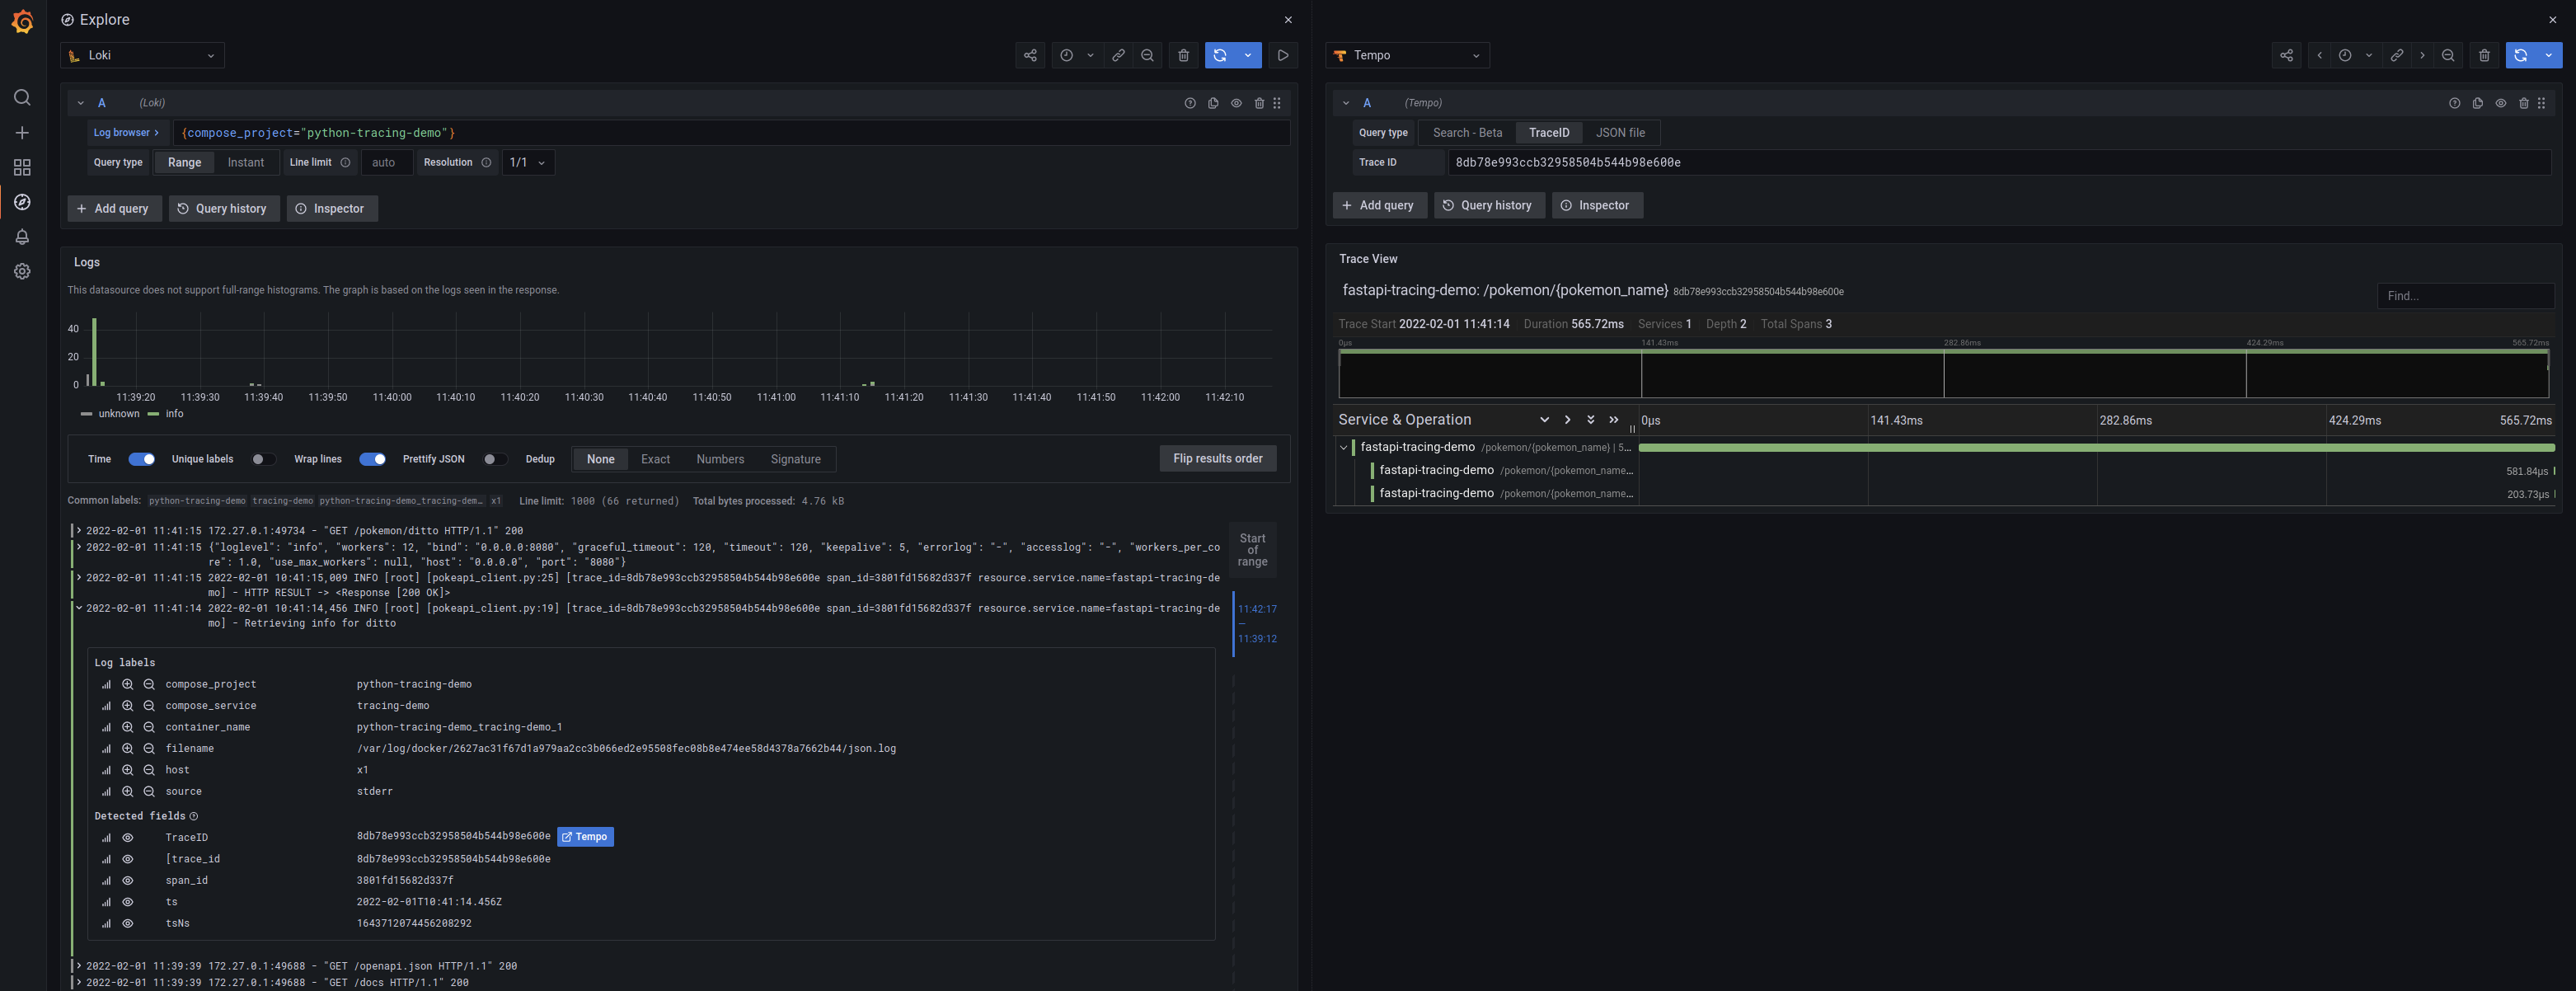
Now, open the grafana dashboard in the explore panel, select Loki as source and query {compose_project="python-tracing-demo"} in the Log Browser input field.
There you'll find the application logs and, if you click on the log of the call we just made, you can see the TraceID with the Tempo button that opens the panel with tracing info
⚠️ This project uses poetry as dependency manager. Change the commands to match yours
poetry add opentelemetry-api
poetry add opentelemetry-sdkFor this demo we are gonna use FastAPI and Logging instrumentation
poetry add opentelemetry-instrumentation-fastapi
poetry add opentelemetry-instrumentation-loggingInstall the OTLP exporter
that allows us to export tracing data to an OTLP collector or, in our case, directly to Tempo
This library currently install both the HTTP and gRPC collector exporters. In our example we are going to use the gRPC one.
poetry add opentelemetry-exporter-otlpIn our main.py let's import the needed packages
from opentelemetry import trace
from opentelemetry.exporter.otlp.proto.grpc.trace_exporter import OTLPSpanExporter
from opentelemetry.sdk.trace import TracerProvider
from opentelemetry.sdk.trace.export import BatchSpanProcessor
from opentelemetry.sdk.resources import Resource

from opentelemetry.instrumentation.fastapi import FastAPIInstrumentor
from opentelemetry.instrumentation.logging import LoggingInstrumentor
And now let's set it up to export traces to Grafana Tempo:
resource = Resource(attributes={"service.name": "fastapi-tracing-demo"}) # set the service name to show in traces

# set the tracer provider
tracer = TracerProvider(resource=resource)
trace.set_tracer_provider(tracer)

# Use the OTLPSpanExporter to send traces to Tempo
tracer.add_span_processor(BatchSpanProcessor(OTLPSpanExporter(endpoint="http://tempo:4317")))

LoggingInstrumentor().instrument()
FastAPIInstrumentor.instrument_app(app, tracer_provider=tracer)
To enable trace contect injection into logs, we should set the OTEL_PYTHON_LOG_CORRELATION to true.
So let's add it to our docker-compose file in the tracing-demo demo service:
tracing-demo:
    build: .
    ports:
      - "8080:8080"
    environment:
      - OTEL_PYTHON_LOG_CORRELATION=true
    logging:
      driver: loki
      options:
        loki-url: http://localhost:3100/loki/api/v1/push
To enable Loki to recognize trace_id in logs, we have to add this config to the grafana-datasources.yml in the loki datasource section:
jsonData:
      derivedFields:
        - datasourceUid: tempo
          matcherRegex: trace_id=(\w+)
          name: TraceID
          url: "$${__value.raw}"
