BY USING THIS SOFTWARE, YOU EXPRESSLY ACCEPT AND AGREE TO THE TERMS OF THE AGREEMENT CONTAINED IN THIS GITHUB REPOSITORY. See the file EULA.md for details.
This project provides a processing engine for ingesting real time streams of trades, bids and asks into MapR Streams at a high rate. The application consists of the following components:
- A Producer microservice that streams trades, bids and asks using the NYSE TAQ format. The data source is the Daily Trades dataset described here. The schema for our data is detailed in Table 6, "Daily Trades File Data Fields", on page 26 of Daily TAQ Client Specification (from December 1st, 2013).
- A multi-threaded Consumer microservice that indexes the trades by receiver and sender.
- Example Spark code for querying the indexed streams at interactive speeds, enabling Spark SQL queries.
- Example code for persisting the streaming data to MapR-DB
- Performance tests for benchmarking different configurations
- A supplementary python script to enhance the above TAQ dataset with "level 2" bid and ask data at a user-defined rate.
The intent of the application is to serve as a "blueprint" for building high-speed streaming applications on the MapR Converged Data Platform. You can use the code as a base for developing your own workflow, including producers, consumers and analytical engines, and run queries against the indexed topics.
There are several beneficial aspects of the application that are worth highlighting:
- The Consumer microservice, performing the indexing, can be arbitrarily scaled simply by running more instances. See below in this README for how to start the application.
- Jackson annotations are provided for easy translation of the data structures to JSON and persistence to MapR-DB.
- The application can handle 300,000 entries/second on a 3-node cluster, which is suitable for testing. It does not require a large cluster, and takes advantage of the scaling properties of MapR Streams.
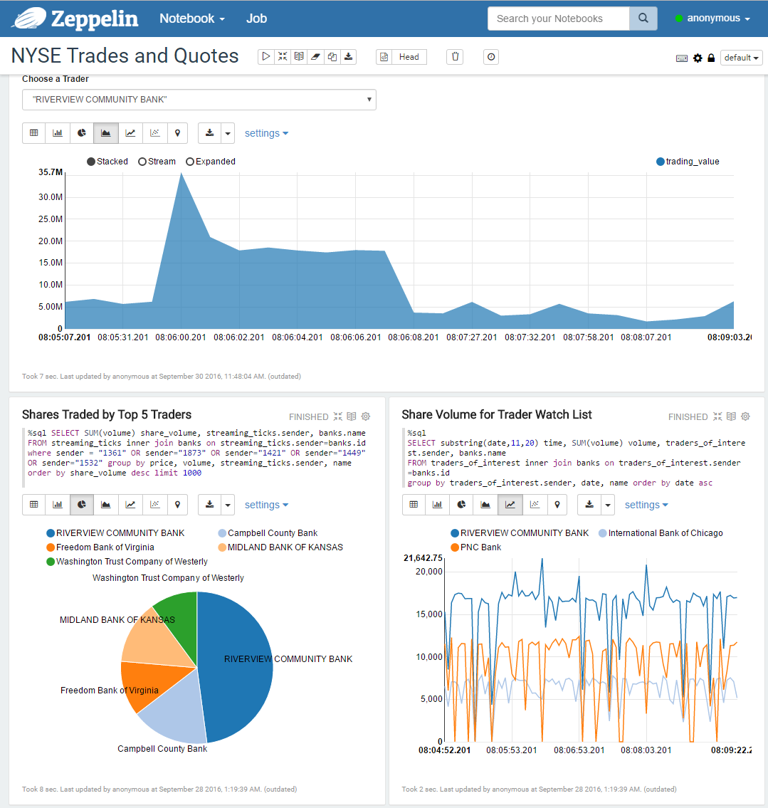
- The resulting index topics are small, and can be queried fast enough such that they can be used for interactive dashboards, such as in a Zeppelin notebook.
The following diagram shows how data moves through the architecture of this application. The rounded rectangles represent processes that produce and/or consume data from MapR Streams topics. Java based microservices are used to ingest and manipulate streaming data using the Kafka API. Spark and Apache Zeppelin are used to provide streaming analytics and batch oriented visualization.
To get the application running you will need a cluster or single node with MapR 5.1 or greater. You can use the free Converged Community Edition or the Converged Enterprise Edition. The example will also run on the MapR Sandbox. Optionally, you will need python 2.7 to run the data generation script. Some performance tests that use R are also provided (see the section below about Testing Speeds for Different Configurations).
You will also need git and Apache Maven in order to download and compile the provided source code.
Clone this repo and build the application with Maven. A pom.xml file is included in the base directory. The remainder of this guide will assume that you clone the package to /home/mapr/.
cd /home/mapr/
git clone http://github.com/mapr-demos/finserv-application-blueprint.git
cd finserv-application-blueprint
mvn clean install
At this point you should see the resulting jar file in the target/ directory: nyse-taq-streaming-1.0.jar
Copy that jar package to the /home/mapr/ directory on each of your cluster nodes:
scp ./target/nyse-taq-streaming-1.0-jar mapr@<YOUR_MAPR_CLUSTER>:/home/mapr
Follow the steps in this section to run the application. You can run these commands on any node in the cluster, but you may want separate the consumer and producer processes onto separate nodes for higher performance.
Optionally you can also run the application from a client node. To setup one, install the MapR Client and run the application locally.
A stream is a logical grouping of topics. They give us a way to group together topics and protect those topics with a single set of security permissions and other properties. MapR supports the Kafka API for interacting with streams. For more information on Streams, see https://www.mapr.com/products/mapr-streams.
Run the following command from any node in your MapR cluster:
$ maprcli stream create -path /user/mapr/taq -produceperm p -consumeperm p -topicperm p -ttl 900
In that command we created the topic with public permission since we want to be able to run producers and consumers from remote computers. Verify the stream was created with this command:
maprcli stream info -path /user/mapr/taq
We only need to create one topic to get started, the rest are created by the application. Topics are created with the maprcli tool. Run this command on a single node in the cluster:
$ maprcli stream topic create -path /user/mapr/taq -topic trades -partitions 3
Verify the topic was created successfully with this command:
$ maprcli stream topic list -path /taq
topic            partitions  logicalsize  consumers  maxlag  physicalsize
trades           1           0            0          0       0
This enables 3 partitions in the topic for scaling across threads, more information on how partitions work can be found here.
We use a multi-threaded microservice that indexes the incoming information into separate topics by receiver and sender. We call this a "fan out" consumer, because it consumes tick data from incoming stock exchange stream and copies each tick record into topics belonging to all the participants of a trade. So for example, if this consumer sees an offer by Sender X to sell shares to recipients A, B, and C, then this consumer will copy that tick to four new topics, identified as sender_X, receiver_A, receiver_B, and receiver_C. This relationship is illustrated below:
A "tick" of this data consists of:
{time, sender, id, symbol, prices, ..., [recipient*]}
For each message in the stream there is a single sender and multiple possible receipients. The consumer will index these into separate topics so they can be queried.
Run the following command to start the consumer:
java -cp `mapr classpath`:/home/mapr/nyse-taq-streaming-1.0.jar:/home/mapr/finserv-application-blueprint/src/test/resources com.mapr.demo.finserv.Run consumer /user/mapr/taq:trades 3
In this example we are starting 3 threads to handle the 3 partitions in topic, /user/mapr/taq:trades.
Run the producer with the following command. This will send all the trades contained in files under finserv-application-blueprint/data/ to /user/mapr/taq:trades, where '/user/mapr/taq' is the stream and 'trades' is the topic.
java -cp `mapr classpath`:/home/mapr/nyse-taq-streaming-1.0.jar com.mapr.demo.finserv.Run producer /home/mapr/finserv-application-blueprint/data/ /user/mapr/taq:trades
A small data file representing one second of trades, bids and asks (data/080449) is provided for convenience. To generate more data, see the section 'Generating Data' below.
You should see the producer running and printing throughput numbers:
Throughput = 0.00 Kmsgs/sec published. Threads = 1. Total published = 2.
Throughput = 202.78 Kmsgs/sec published. Threads = 1. Total published = 411107.
Throughput = 377.08 Kmsgs/sec published. Threads = 1. Total published = 1139858.
Throughput = 463.34 Kmsgs/sec published. Threads = 1. Total published = 1865937.
Throughput = 478.99 Kmsgs/sec published. Threads = 1. Total published = 2406537.
This simulates "live" bids, asks and trades streaming from an exchange.
The class Persister.java is provided as a code example to help you get familiar with the MapR-DB and OJAI APIs, and persists data to MapR-DB that it consumes a topic. You can run this class with the following command line:
java -cp `mapr classpath`:/home/mapr/nyse-taq-streaming-1.0.jar com.mapr.demo.finserv.Persister /user/mapr/taq:sender_0110
This causes trades, bids and asks sent by sender ID 0110 to be persisted to MapR-DB in a table located at /mapr/ian.cluster.com/user/mapr/ticktable. Here are some examples of how you can query this table:
Here’s how to query the MapR-DB table with dbshell:
mapr dbshell
    find /user/mapr/ticktable
If you've installed Apache Drill, here’s how to query the MapR-DB table with Drill. First start Drill like this:
/opt/mapr/drill/drill-1.6.0/bin/sqlline -u jdbc:drill:
Then enter either of the following two SELECT statements:
SELECT * FROM dfs.`/mapr/ian.cluster.com/user/mapr/ticktable`;
SELECT * FROM dfs.`/user/mapr/ticktable`;
The SparkStreamingToHive class builds tables that can be queried with Spark SQL. Run this class as follows:
/opt/mapr/spark/spark-1.6.1/bin/spark-submit --class com.mapr.demo.finserv.SparkStreamingToHive /home/mapr/nyse-taq-streaming-1.0.jar /user/mapr/taq:sender_0410 ticks_from_0410
This causes a queryable table (which can be queried from i.e. a Zeppelin notebook) to be created for the stock trader with ID 0410.
A class that simply prints the streaming messages to the console is also provided, and can be run as follows:
/opt/mapr/spark/spark-1.6.1/bin/spark-submit --class com.mapr.demo.finserv.SparkStreamingConsole /home/mapr/nyse-taq-streaming-1.0.jar /user/mapr/taq:sender_0410
There are many frameworks we could use to build an operational dashboard. Apache Zeppelin is a good choice because we can build the dashboard with a variety of ways of attaching to the data.
Follow the steps in this section to build a dashboard with SQL queries into the tables we built in previous sections.
This example requires the following software:
- MapR 5.1 or greater (including Spark)
- Zeppelin 0.7-SNAPSHOT or greater
For testing purposes, we suggest running Zeppelin on either one of the MapR cluster nodes, or in a client node with the mapr-client package installed.
In order for Spark (and hence Zeppelin) to see the tables created for Hive, Spark needs to be directed to use the Hive Metastore. Copy the hive-site.xml from the Hive conf directory to the Spark config directory.
cp /opt/mapr/hive/hive-1.2/conf/hive-site.xml /opt/mapr/spark/spark-1.6.1/conf/
To build our dashboard, we'll use the %sql directive to query Spark SQL. Ensure that the Zeppelin Spark interpreter is configured with the following options:
master	yarn-client
spark.app.name	Zeppelin
spark.executor.memory	2g
zeppelin.dep.additionalRemoteRepository	spark-packages,http://dl.bintray.com/spark-packages/maven,false;
zeppelin.dep.localrepo	local-repo
zeppelin.interpreter.localRepo	/home/mapr/zeppelin-0.7.0-SNAPSHOT/local-repo/2BX9VZF48
zeppelin.pyspark.python	python
zeppelin.spark.concurrentSQL	false
zeppelin.spark.importImplicit	true
zeppelin.spark.maxResult	1000
zeppelin.spark.printREPLOutput	true
zeppelin.spark.sql.stacktrace	true
zeppelin.spark.useHiveContext	true
After installing Zeppelin and connecting to the web interface, let's first look at the available tables in Spark SQL.
Create a new notebook. Zeppelin divides the Notebook into subsections called paragraphs. In a new Zeppelin paragraph, enter the following and press the 'Play' icon:
%sql show tables
You should see a table called streaming_ticks in the list. If not, consult the previous section Starting Other Consumers to build the table.
Next replace this %sql entry with the following query, which will build a summary table:
%sql SELECT sum(price*volume) TradingValue, streaming_ticks.sender senderID FROM streaming_ticks group by sender
You should now see a table summarizing trading volume by sender ID. You can also try these other queries:
%sql SELECT sender, symbol, count(1) num_trades FROM streaming_ticks where symbol ="AA" group by sender, symbol order by sender
%sql SELECT price, volume, count(1) value FROM streaming_ticks where sender = "1361" group by price, volume, sender order by price %sql select count(*) from streaming_ticks
Consult the file SparkStreamingToHive.java for a code example on how to persist data into this table.
When you are done, you can delete the stream, and all associated topic using the following command:
$ maprcli stream delete -path /user/mapr/taq
Don't forget to recreate the stream before running the producer again.
Remove the Hive table:
$ rm -rf /mapr/ian.cluster.com/user/hive/warehouse/streaming_ticks/
The source data files are kept in a separate repo to keep this one to a manageable size. To get more data, perform the following steps. You can either use the larger starting set of data files provided here, or run the provided script prepticks.py to generate more from scratch. This will take the NYSE TAQ file as input and generate simulated bids and asks leading up to each trade, at a pre-defined rate per second.
First, download the data repo:
git clone https://github.com/mapr-demos/finserv-data-files
Expand the starter data files as follows:
cd finserv-data-files
mkdir data
tar xvfz starter_datafiles.tar.gz -C data
You can then pass this data directory to the consumer application above.
If you want to generate even more data (for example, to simulate an entire trading day) then run prepticks.py to generate it using the NYSE TAQ files. First combine them:
cat taq/* >> data.zip
unzip data.zip
Now, go back to this repo and edit the file prepticks.py to point to the file you just unzipped and the output directory. This will generate data for all events in the TAQ file. A machine with 128G RAM is recommended for generating data.
In this section we discuss methods for benchmarking performance and observing how performance scales with to cluster size.
We suggest you use multiple partitions for the first stage of sending raw data to the taq:trades stream:topic, and use three consumer processes with two threads each for the middle stage of consuming that raw data and multiplexing it to receiver and sender topics. To recap the above configuration, create your topic like this:
$ maprcli stream create -path /user/mapr/taq -ttl 300
$ maprcli stream topic create -path /user/mapr/taq -topic trades -partitions 3
Then run the consumers on three different cluster nodes, with 2 threads each, like this:
time java -cp `mapr classpath`:/mapr/tmclust1/user/mapr/resources:/mapr/tmclust1/user/mapr/nyse-taq-streaming-1.0-jar-with-dependencies.jar com.mapr.demo.finserv.Run consumer2 /user/mapr/taq:trades 2
Then run the producer like this:
java -cp `mapr classpath`:/mapr/tmclust1/user/mapr/nyse-taq-streaming-1.0-jar-with-dependencies.jar com.mapr.demo.finserv.Run producer nyse/1minute /user/mapr/taq:trades;
Included with this repo there are several unit tests that don't so much test anything as produce speed data so that different configurations of producer threads can be adjusted to get optimal performance under different conditions.
To run these tests do this in the top-level directory:
mvn -e -Dtest=TopicCountGridSearchTest,ThreadCountSpeedTest test
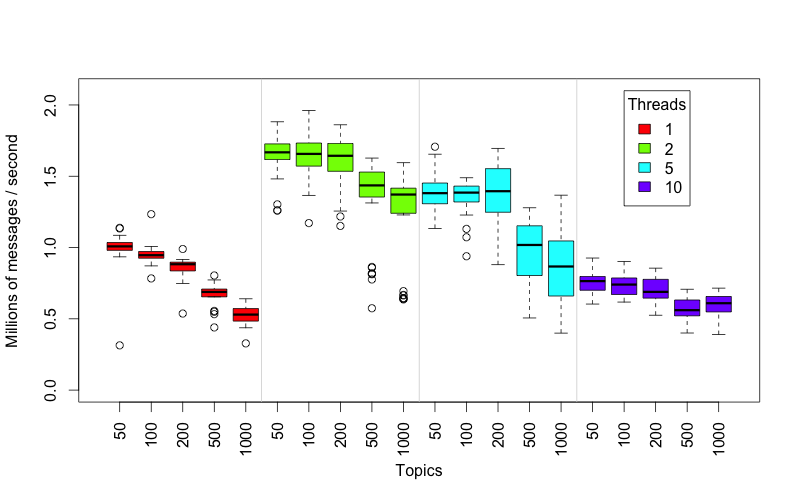
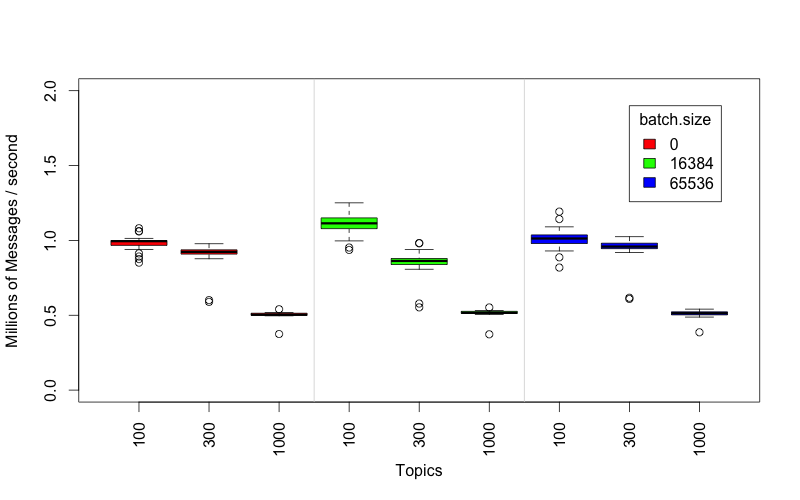
This will create two data files, thread-count.csv and topic-count.csv. These files can be visualized
by running an analysis script:
Rscript src/test/R/draw-speed-graphs.r
This will create PNG images with figures something like these that we produced on our test cluster:
Visit the MapR Community pages where you can post questions and discuss your use case.


