This is a Python implementation of DBSherlock: A Performance Diagnostic Tool for Transactional Databases (SIGMOD 2016)
Start docker container using docker compose, and login to the container
docker compose up -dInstall python packages
pip install -r requirements.txtYou will need to download DBSherlock dataset and convert it to json format.
Download TPCC 16w dataset
wget -P data/original_dataset/ https://github.com/dongyoungy/dbsherlock-reproducibility/raw/master/datasets/dbsherlock_dataset_tpcc_16w.matDownload TPCC 500w dataset
wget -P data/original_dataset/ https://github.com/dongyoungy/dbsherlock-reproducibility/raw/master/datasets/dbsherlock_dataset_tpcc_500w.matDownload TPCE 3000 dataset
wget -P data/original_dataset/ https://github.com/dongyoungy/dbsherlock-reproducibility/raw/master/datasets/dbsherlock_dataset_tpce_3000.matConvert TPCC 16w dataset to json format
python scripts/data/convert_dataset.py \
--input data/original_dataset/dbsherlock_dataset_tpcc_16w.mat \
--out_dir data/converted_dataset \
--prefix tpcc_16w
Convert TPCC 500w dataset to json format
python scripts/data/convert_dataset.py \
--input data/original_dataset/dbsherlock_dataset_tpcc_500w.mat \
--out_dir data/converted_dataset \
--prefix tpcc_500w
Convert TPCE 3000 dataset to json format
python scripts/data/convert_dataset.py \
--input data/original_dataset/dbsherlock_dataset_tpce_3000.mat \
--out_dir data/converted_dataset \
--prefix tpce_3000Please refer to src/data/README.md
python scripts/visualize/data.py \
--data data/converted_dataset/tpcc_500w_test.json \
--output results/visualize_data/
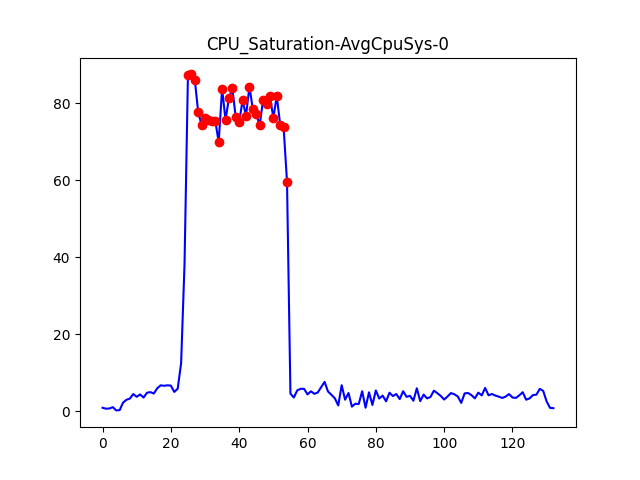
The saved time series plots will look like this:
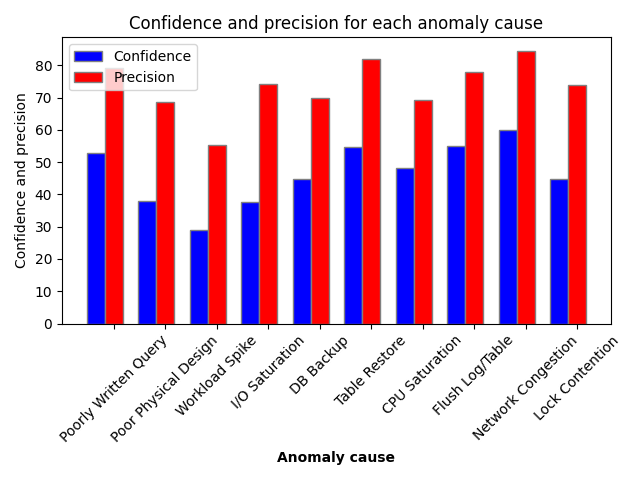
Accuracy of Single Causal Models (Figure 7 in the paper)
python scripts/experiments/experiment.py \
--data data/converted_dataset/tpcc_500w_test.json \
--output_dir result/exp1/ \
--exp_id 1
The result plot should look like this:
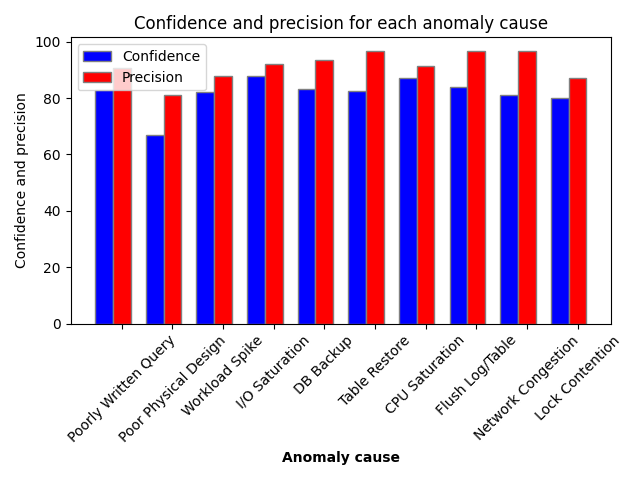
DBSherlock Predicates versus PerfXplain (Figure 9 in the paper)
python scripts/experiments/experiment.py \
--data data/converted_dataset/tpcc_16w_test.json \
--output_dir result/exp2/ \
--exp_id 2
The result plot should look like this:
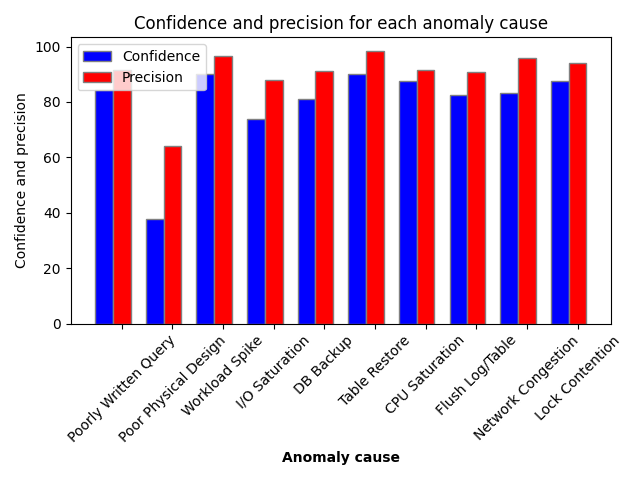
Effectiveness of Merged Causal Models (Figure 8 in the paper)
python scripts/experiments/experiment.py \
--data data/converted_dataset/tpcc_500w_test.json \
--output_dir result/exp3/ \
--exp_id 3
The result plot should look like this:


