Overview
This repo contains two functions. One support dynamic reload rules of prometheus, the other is used to support multi TiDB version.
Function1 - Prometheus Rule Reloader
It is a simple binary to trigger a reload when Rules are updated. It watches dirs and call reload API that the rules has been changed.
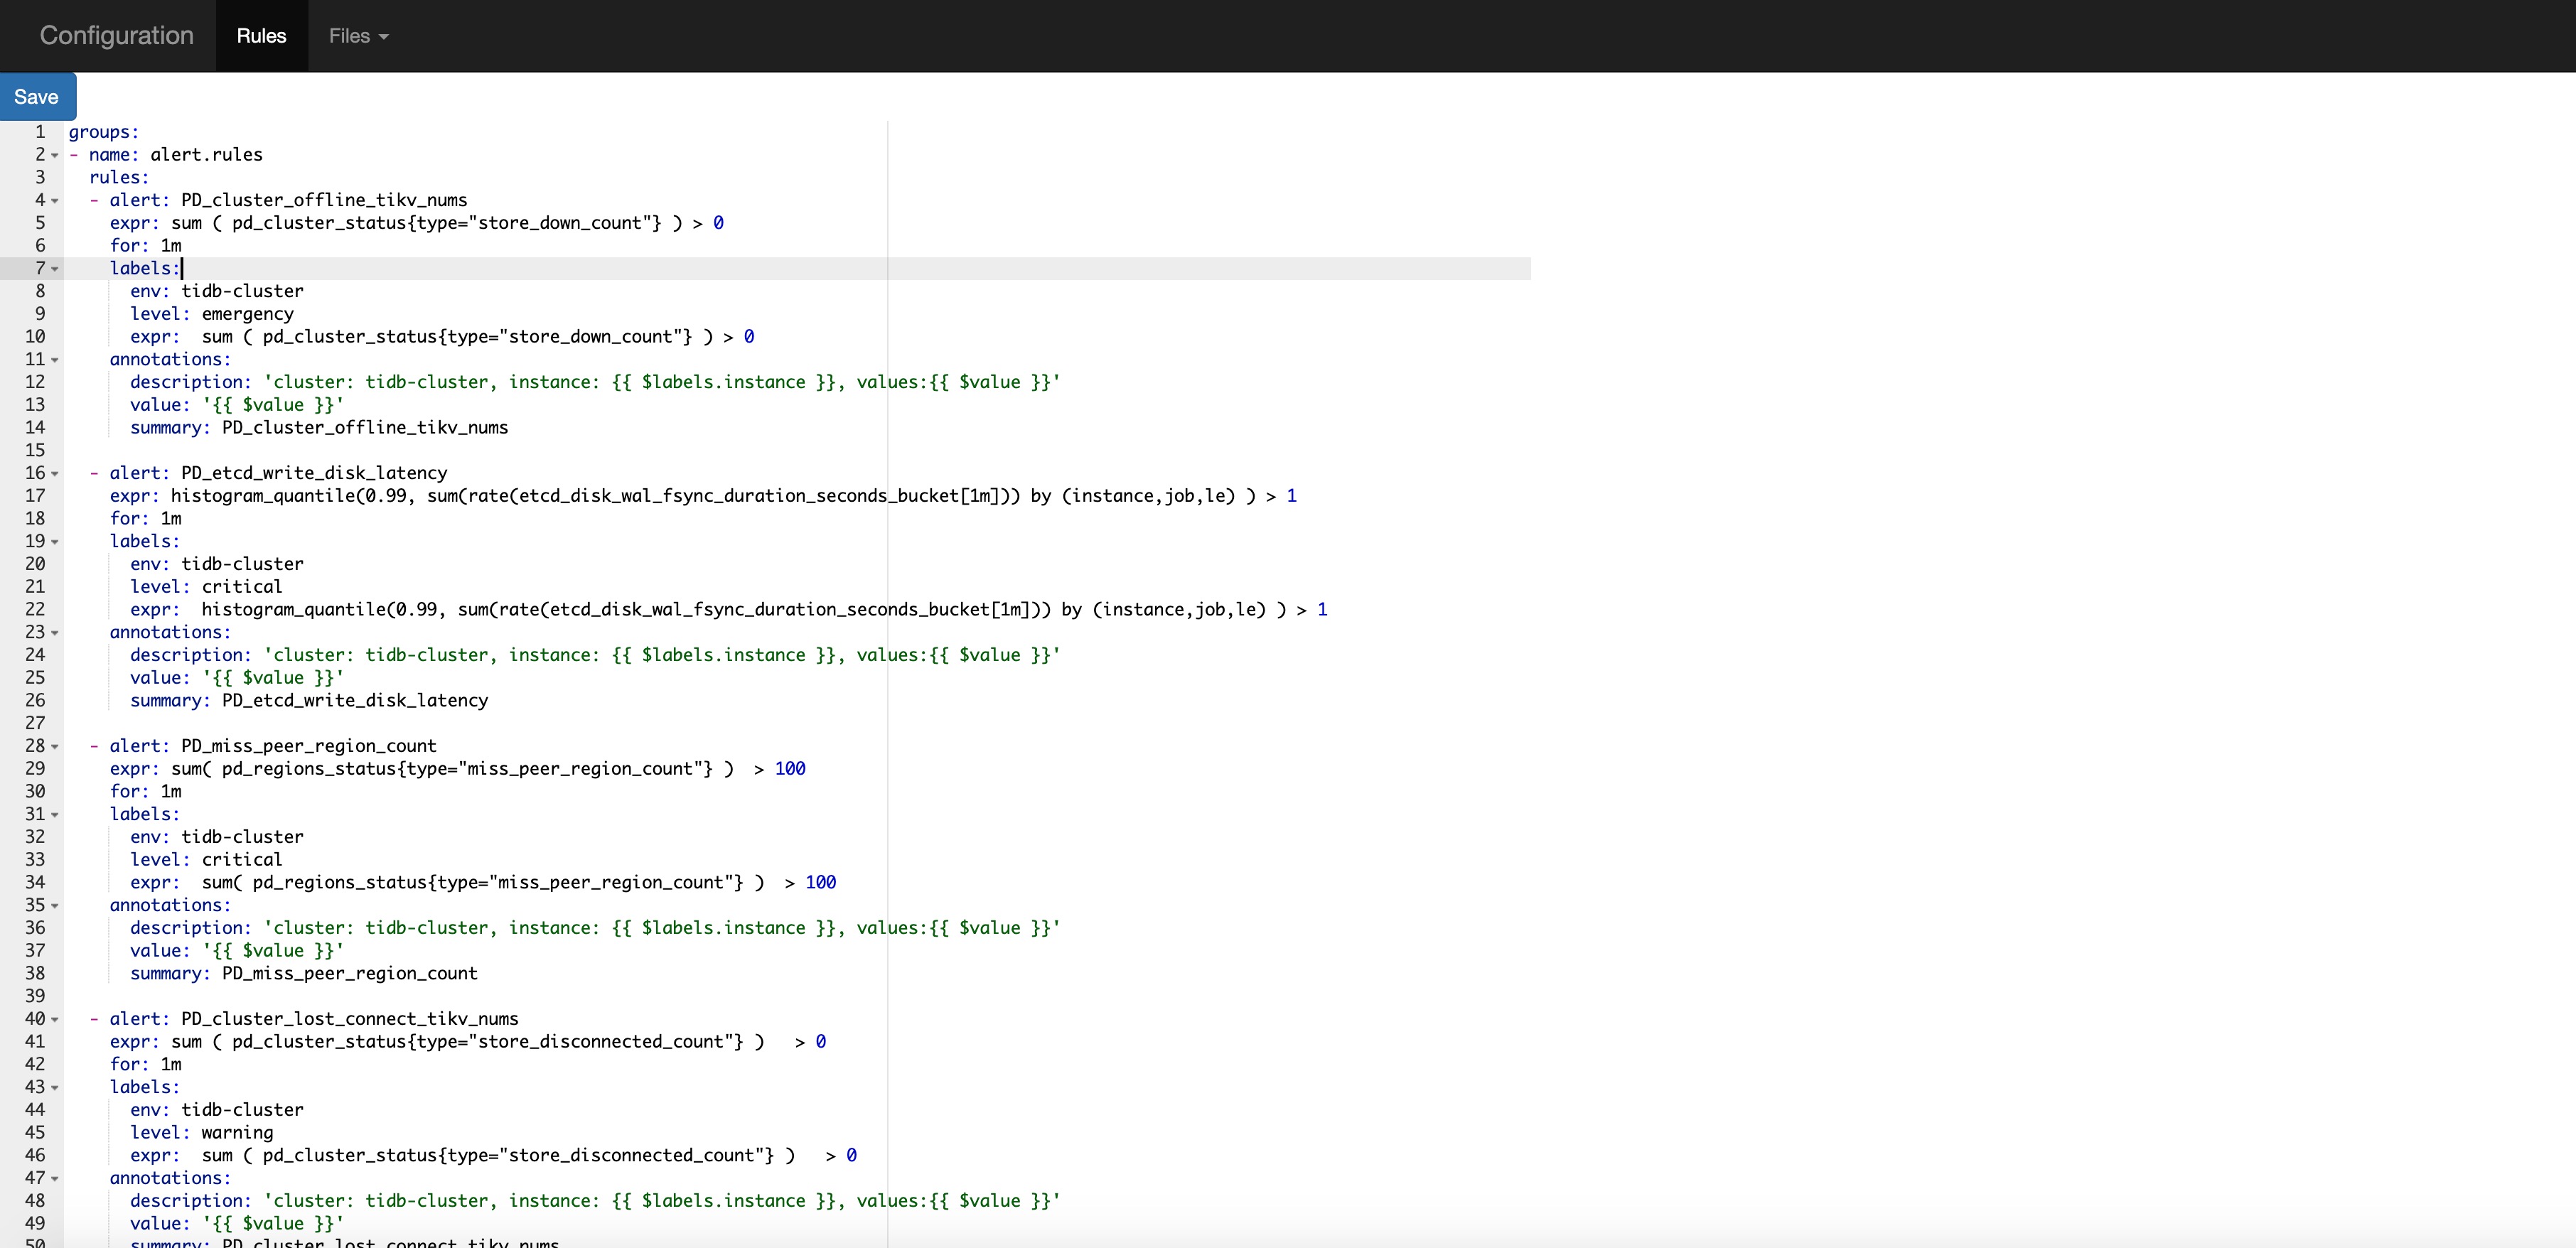
It provide a UI to update rules(For ease of use, the UI is similar with UI of Prometheus).

The text editor is friendly to Yaml format. To quickly verify that the modification is successful, there is Rules UI which get rules from Prometheus (You can also verify it by Prometheus.).
How to use it
make
There is binary in reload/build/{plateform}/reload, you can run it like this
./reload --watch-path=/tmp/prometheus-2.8.0.darwin-amd64/rules --prometheus-url=http://127.0.0.1:9090
Function2 - Cloud TiDB Monitoring
Overview
Generate versioned monitoring data that is used by tidb-operator. This project pulls TiDB monitoring data from tidb-ansible and uses the git tag to understand the TiDB version.
All TiDB version monitoring information is automatically generated (by default it generates for TiDB version >= 2.1.8). The structure of monitor directory is like this
 monitor/
    |── v2.1.8
    |   ├── dashboards
    |   │   ├─ overview.json
    |   │   ├─ binlog.json
    |   │   |_ pd.json
    |   |   |_ tikv_pull.json
    |   |   |_ tidb.json
    |   |
    |   |── rules
    |   |   ├── tidb.rule.yml
    |   |   ├── tikv.rule.yml
    |   |   └── pd.rule.yml
    |   |—— Dockerfile
    |   |__ init.sh
    |
    |── v3.0.0
    |   ├── dashboards
    |   │   |- overview.json
    |   │   |- binlog.json
    |   │   |- pd.json
    |   |   |- tidb.json
    |   |   |- tikv_details.json
    |   |   |- tikv_sumary.json
    |   |   |_ tikv_trouble_shooting.json
    |   |
    |   |── rules
    |   |   ├── tidb.rule.yml
    |   |   ├── tikv.rule.yml
    |   |   └── pd.rule.yml
    |   |—— Dockerfile
    |   |__ init.sh
    |___ ...
How to use it
make
There will be monitoring binary, you can run it like this
./monitoring --path=.
The program will replace some variables and the docker will receive 4 variables:
GF_PROVISIONING_PATH // grafana provisioning path
TIDB_CLUSTER_NAME // TiDB cluster name
TIDB_ENABLE_BINLOG // whether enable binlog
PROM_CONFIG_PATH // proemtheus rules config path