- Trainee Progam Final Project
- Overview
- Description
- Apps deployed
- Environments
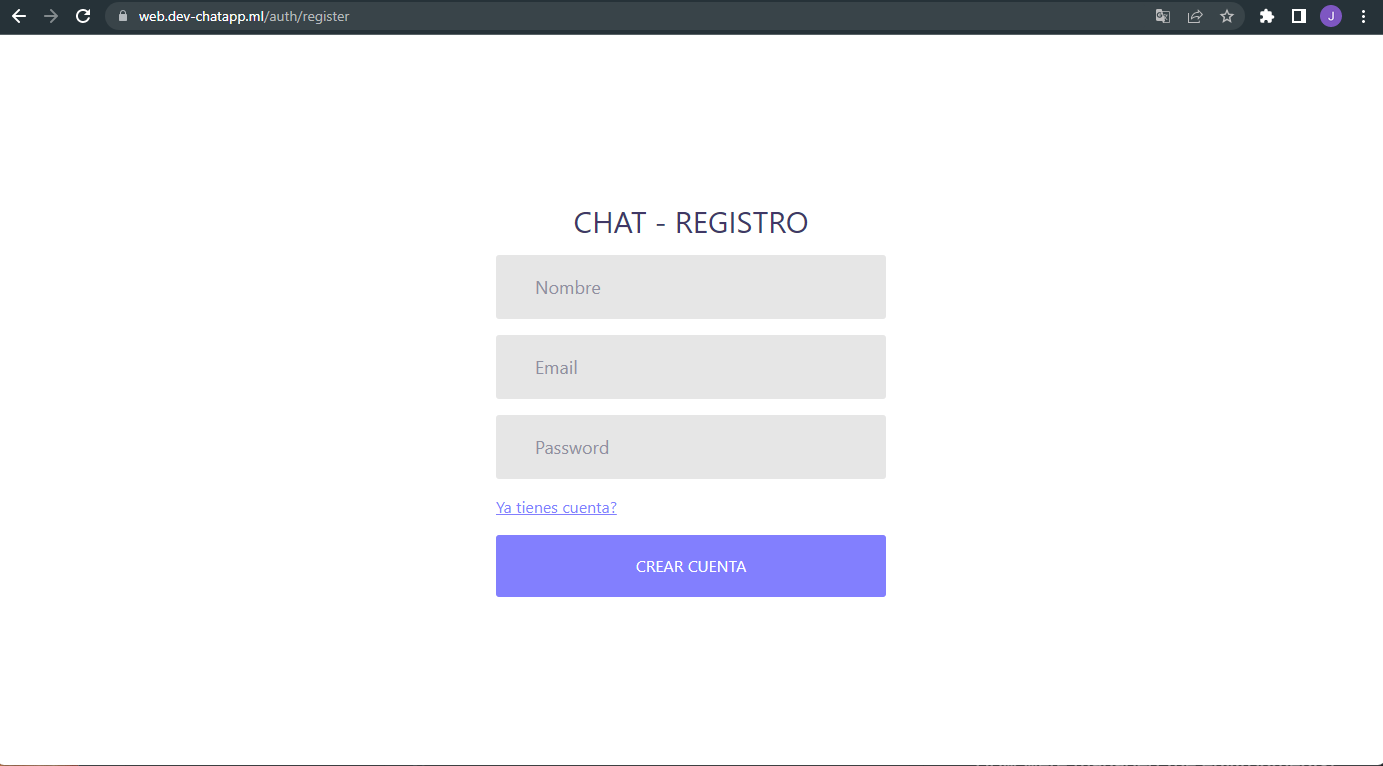
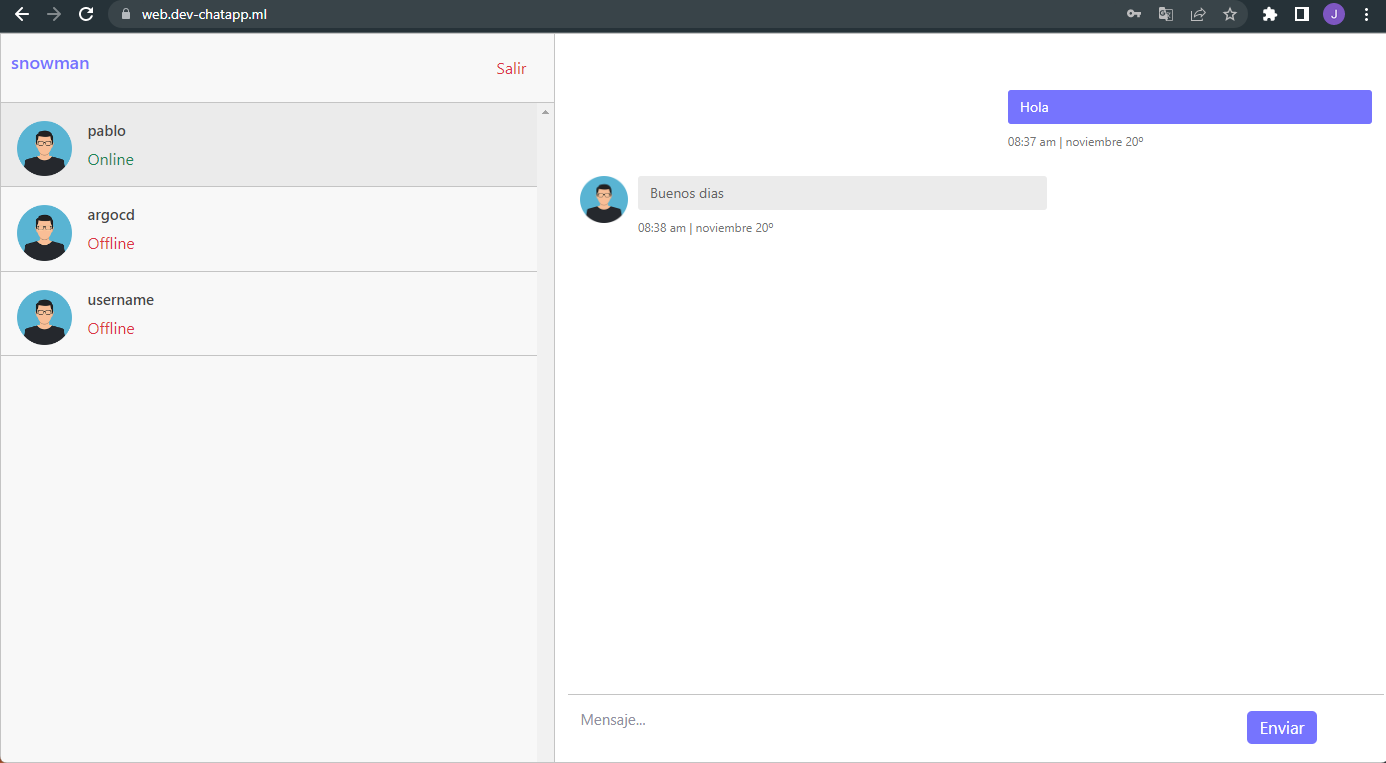
A simple messaging app where you can talk with your family and friend on a fast way without providing sensible data when the user is registered.
You can find the commands used for the application and infrastructure configuration here
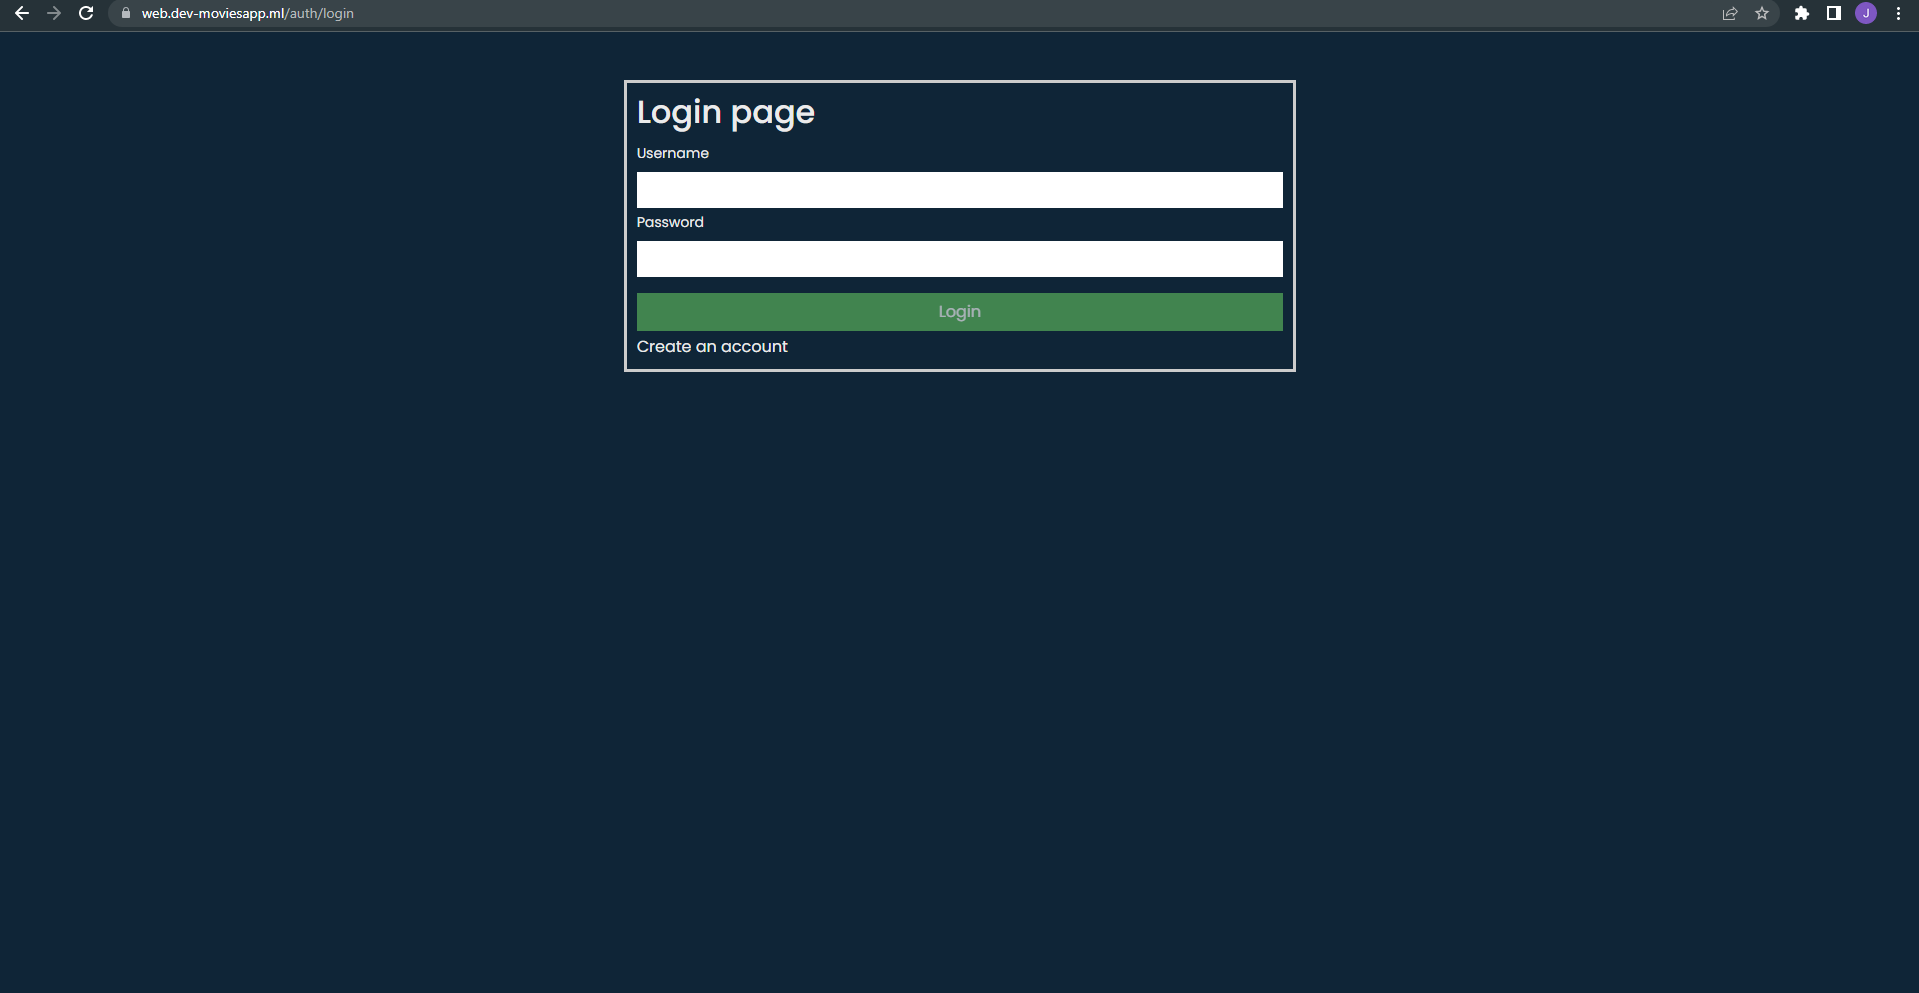
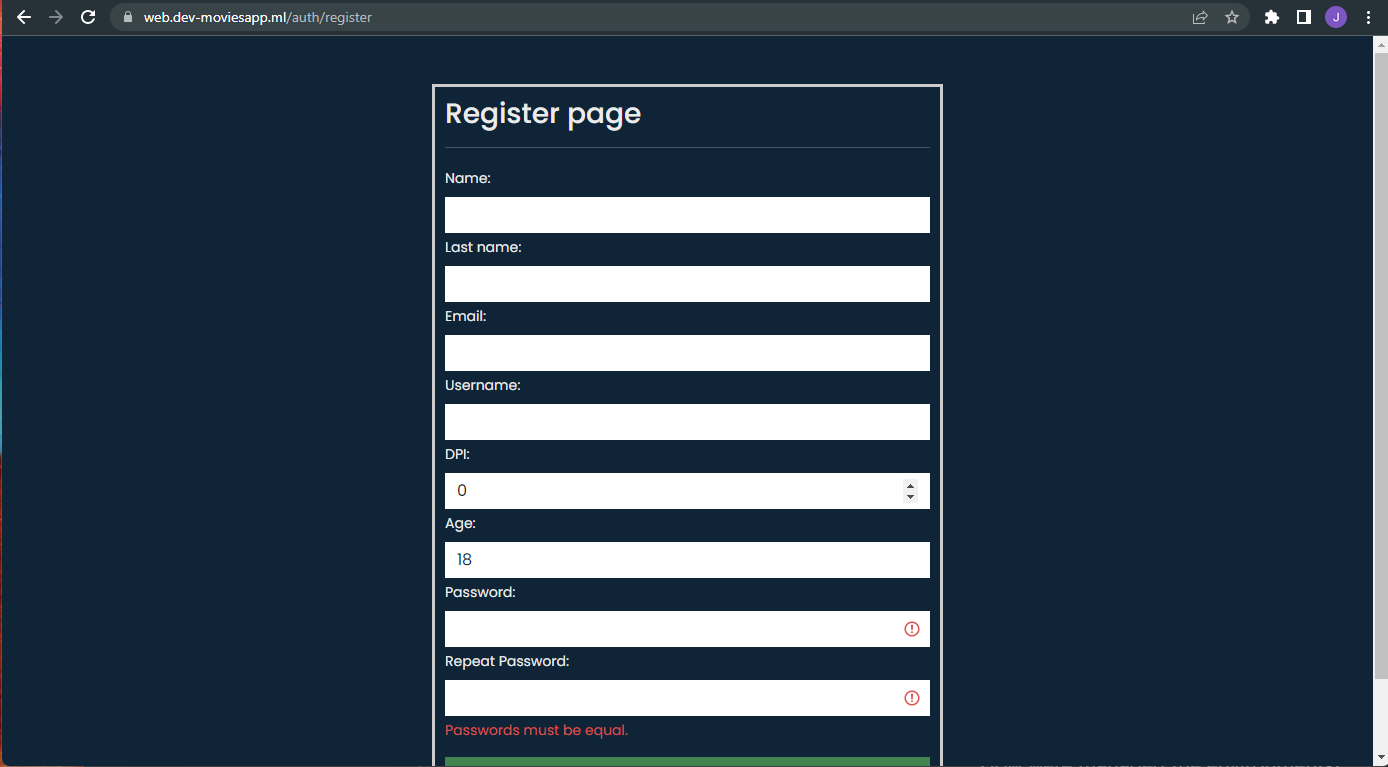
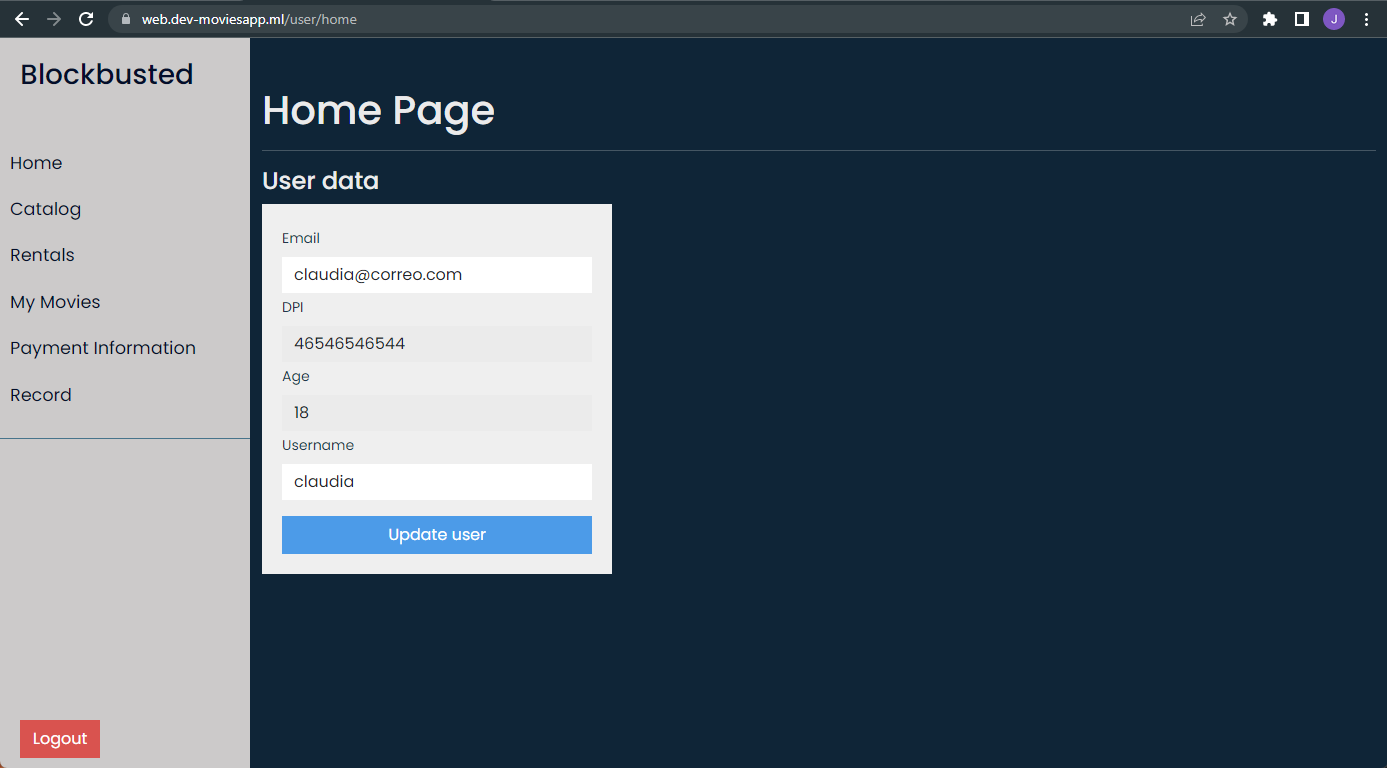
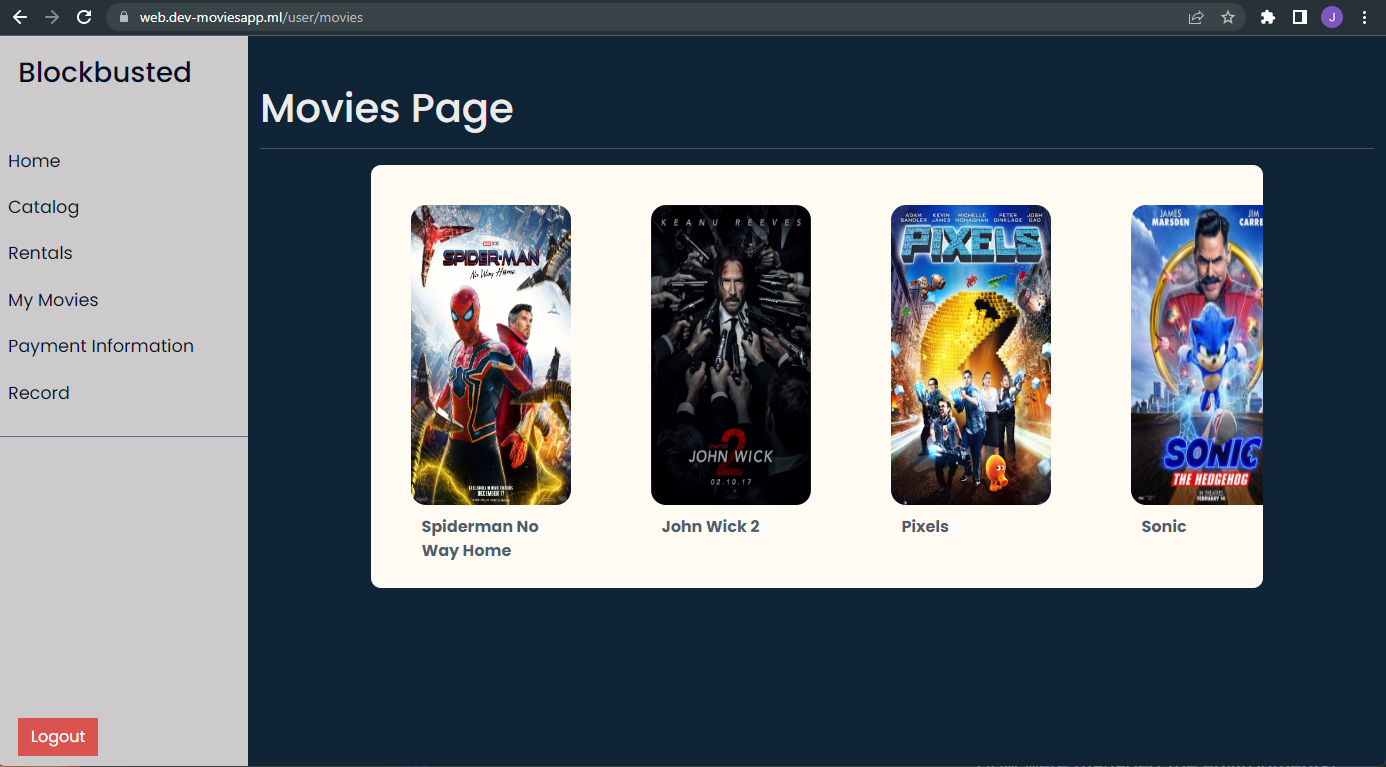
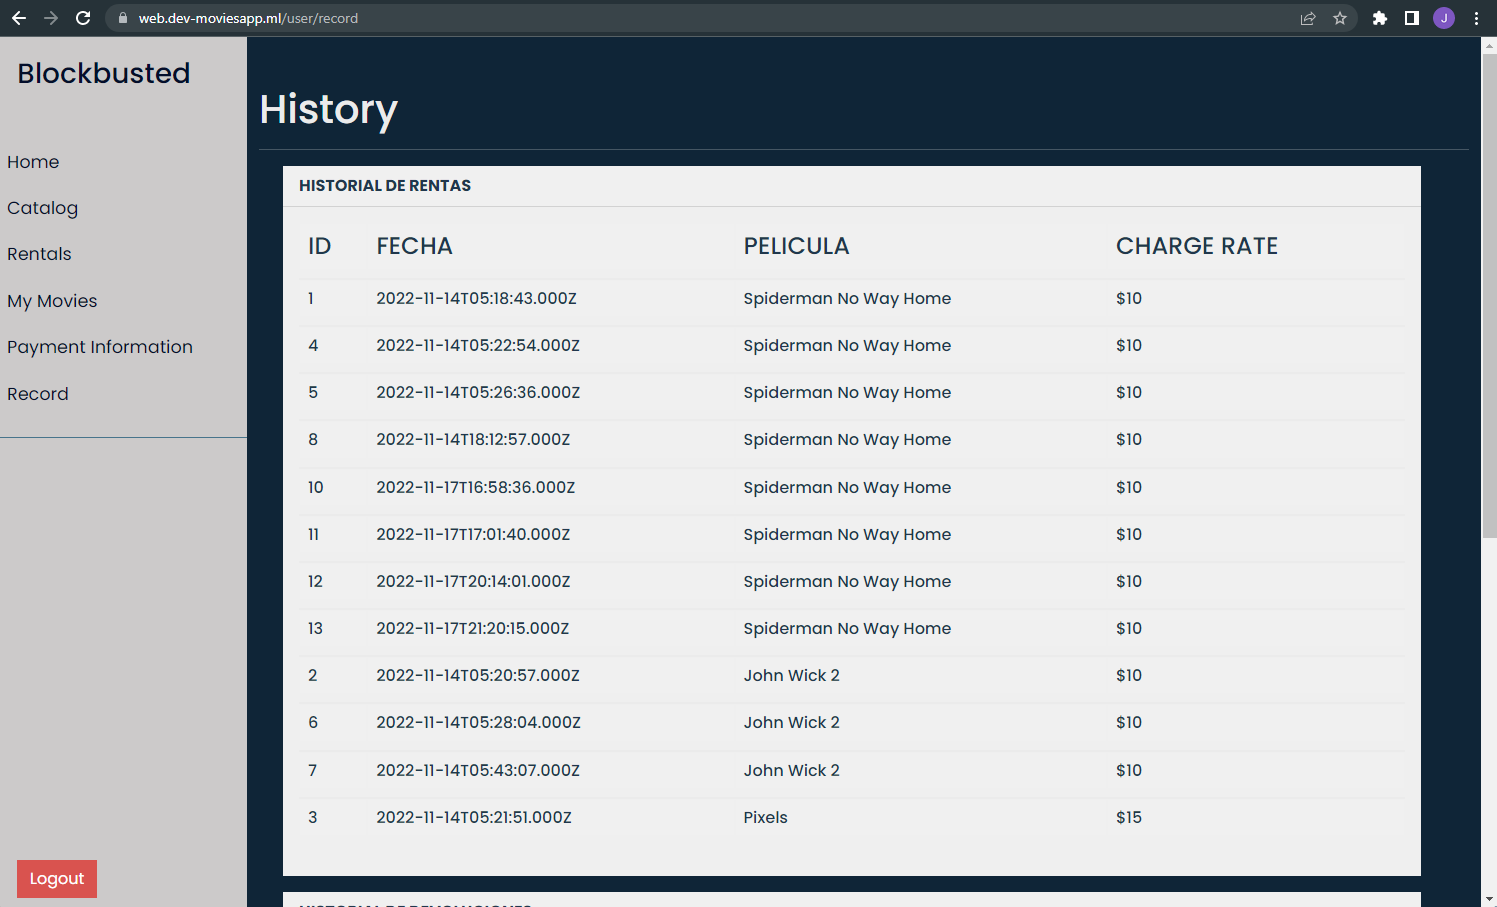
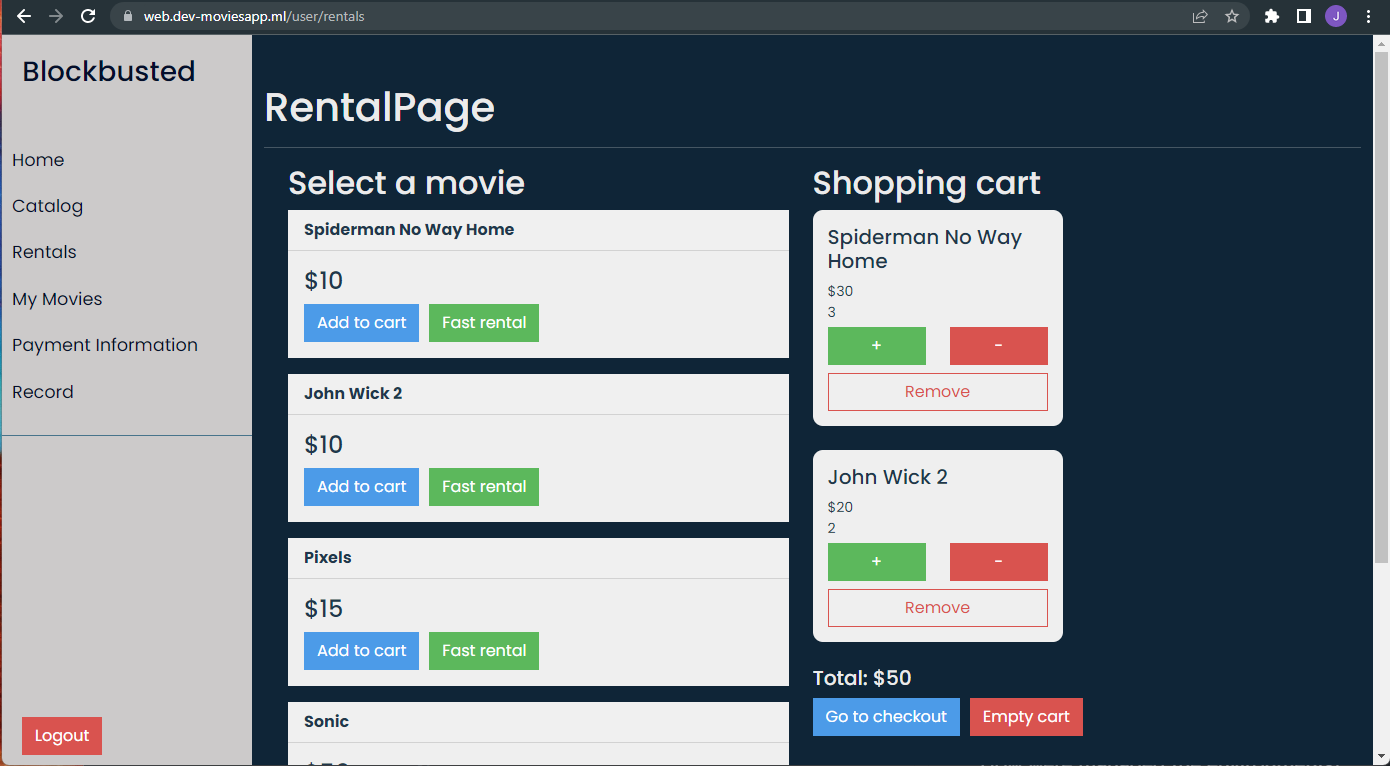
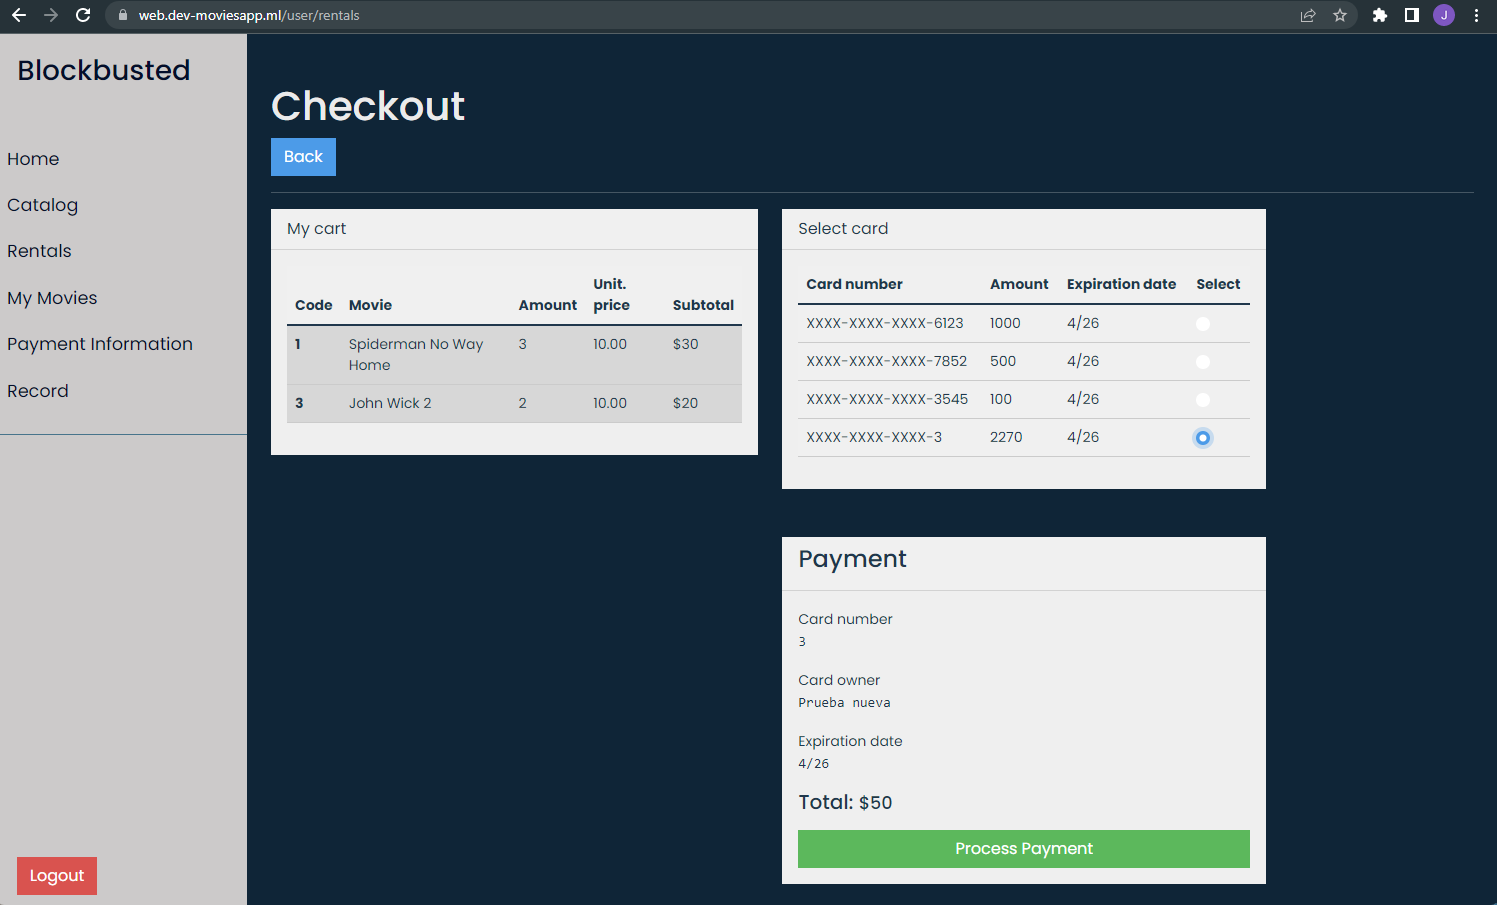
This is a renting movies app, where the user can rent a lot of movies from the movie catalog.
On this project, we hace all the resources and infrastructure separated in two environments, development and production.
| Environment | GCP Project Name Used |
|---|---|
| Development | FinalProject-tp |
| Production | FinalProject-tp-production |
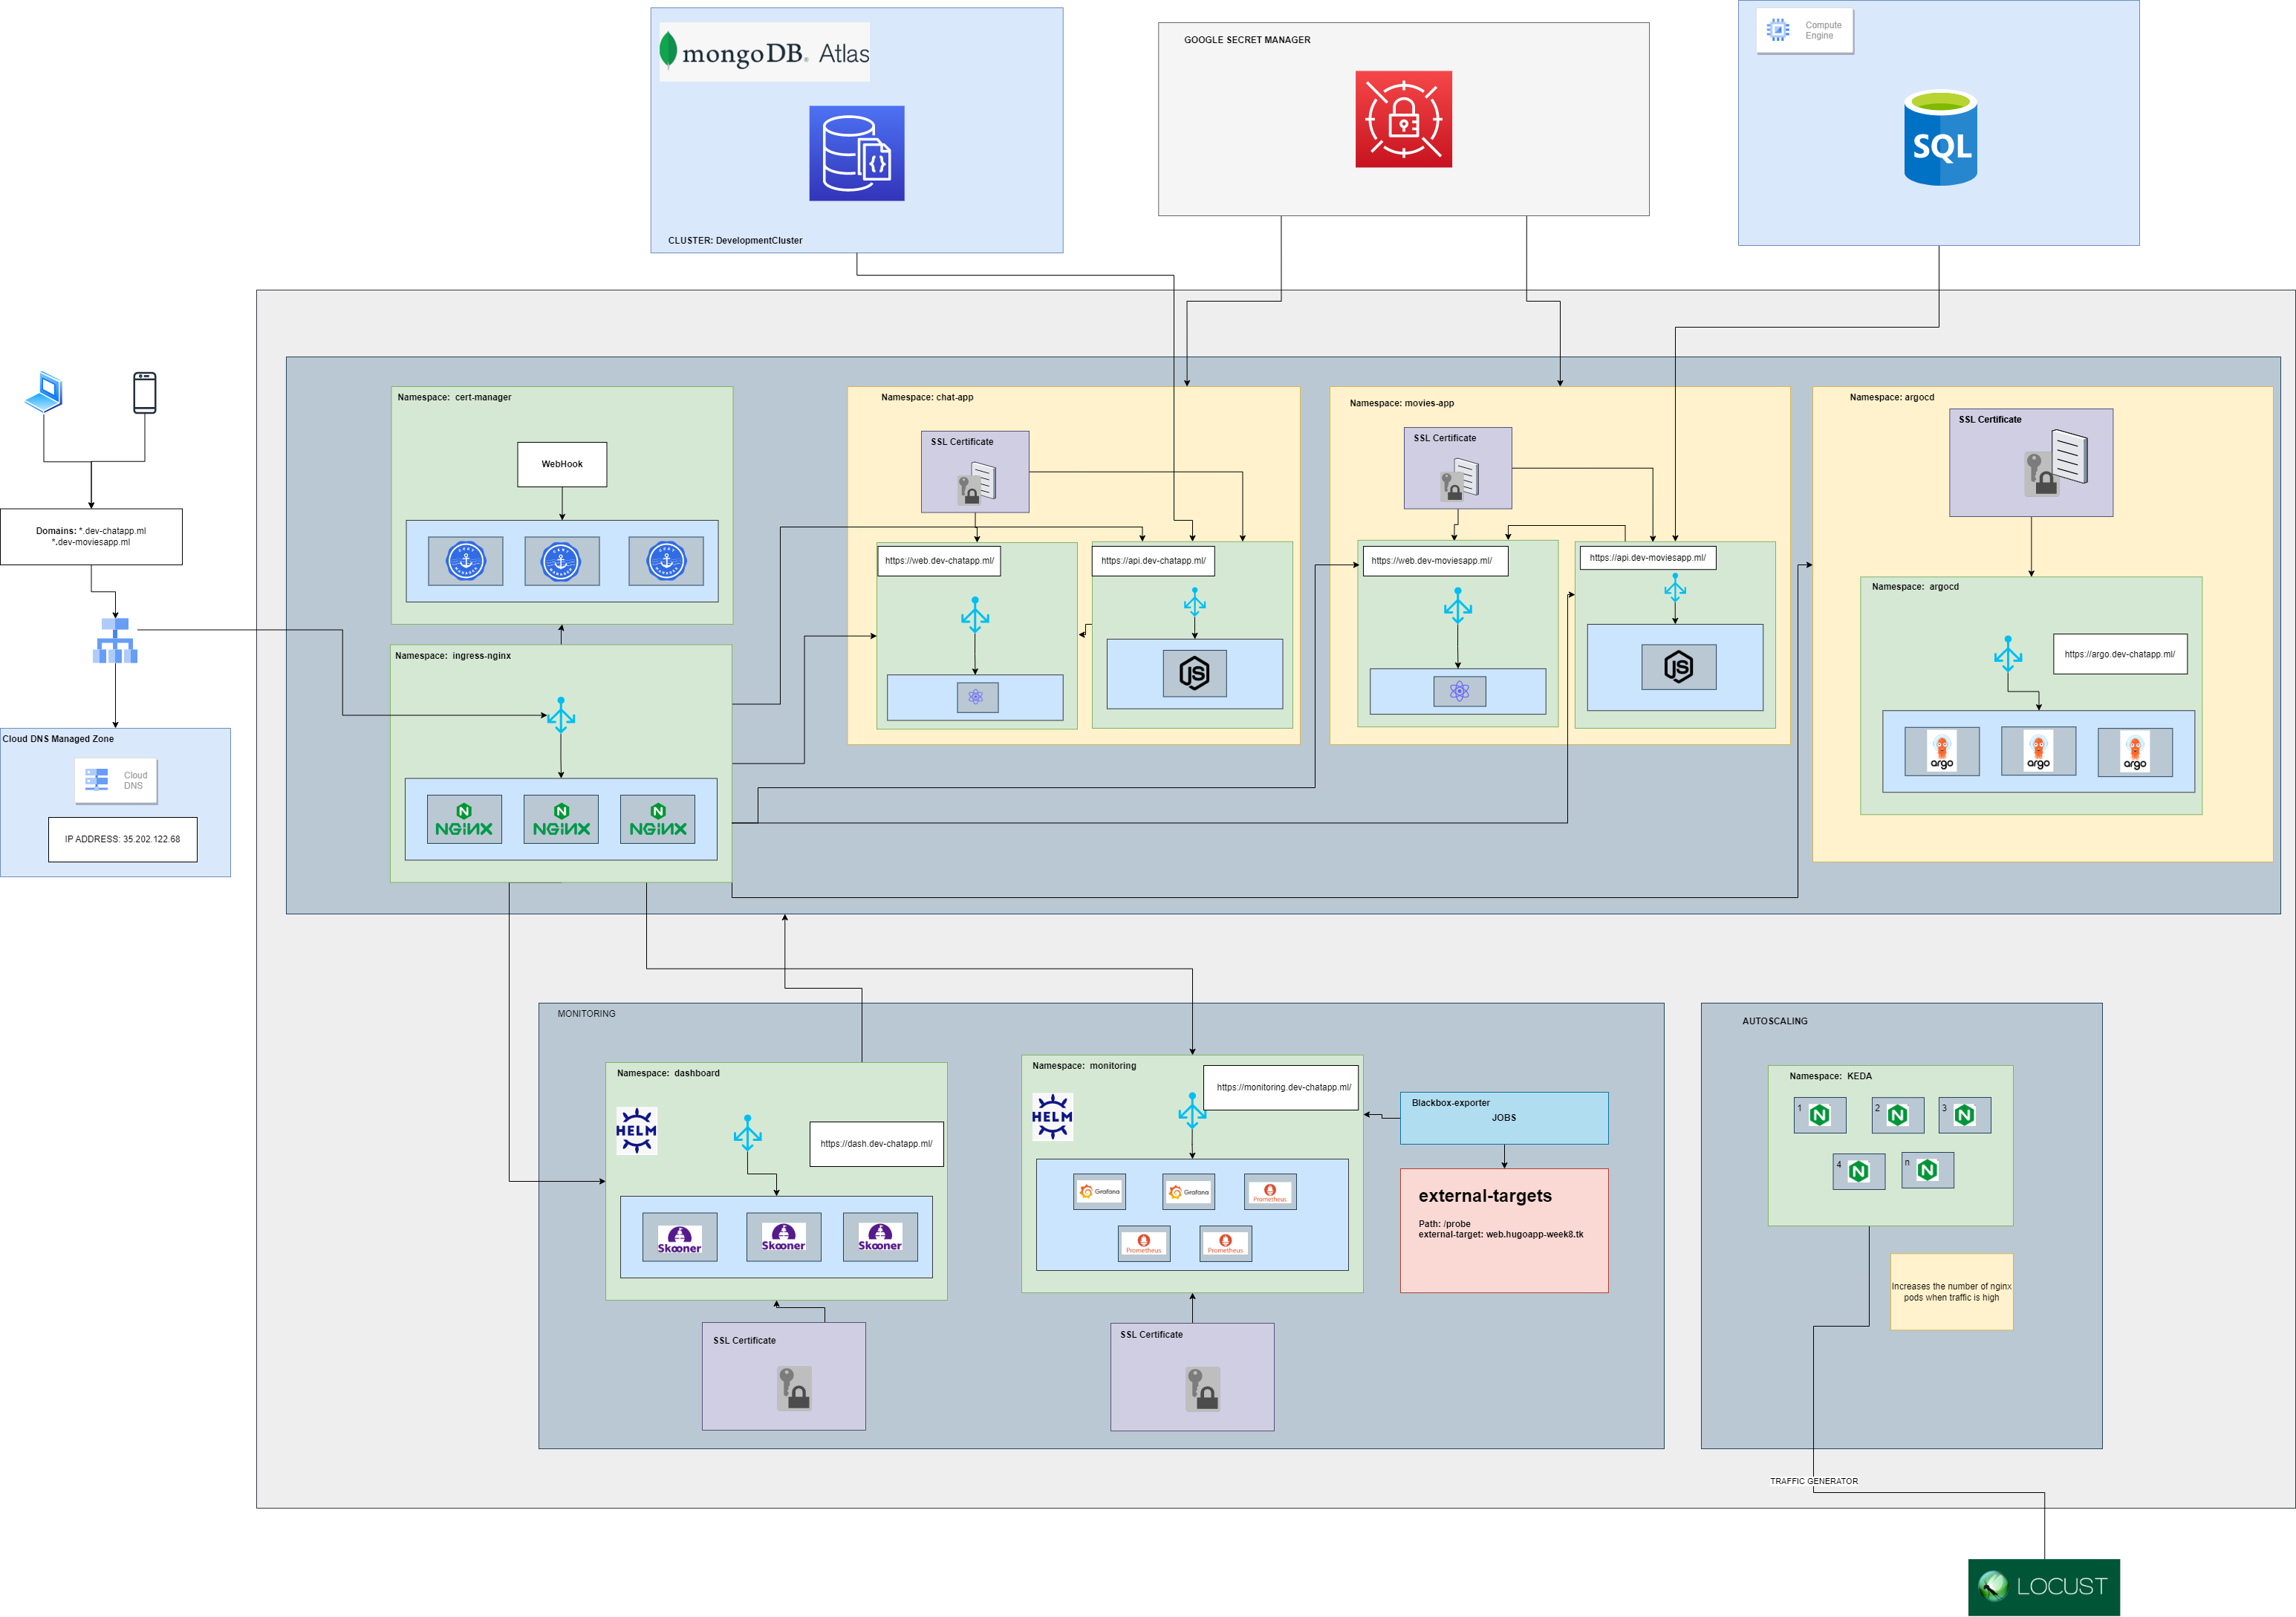
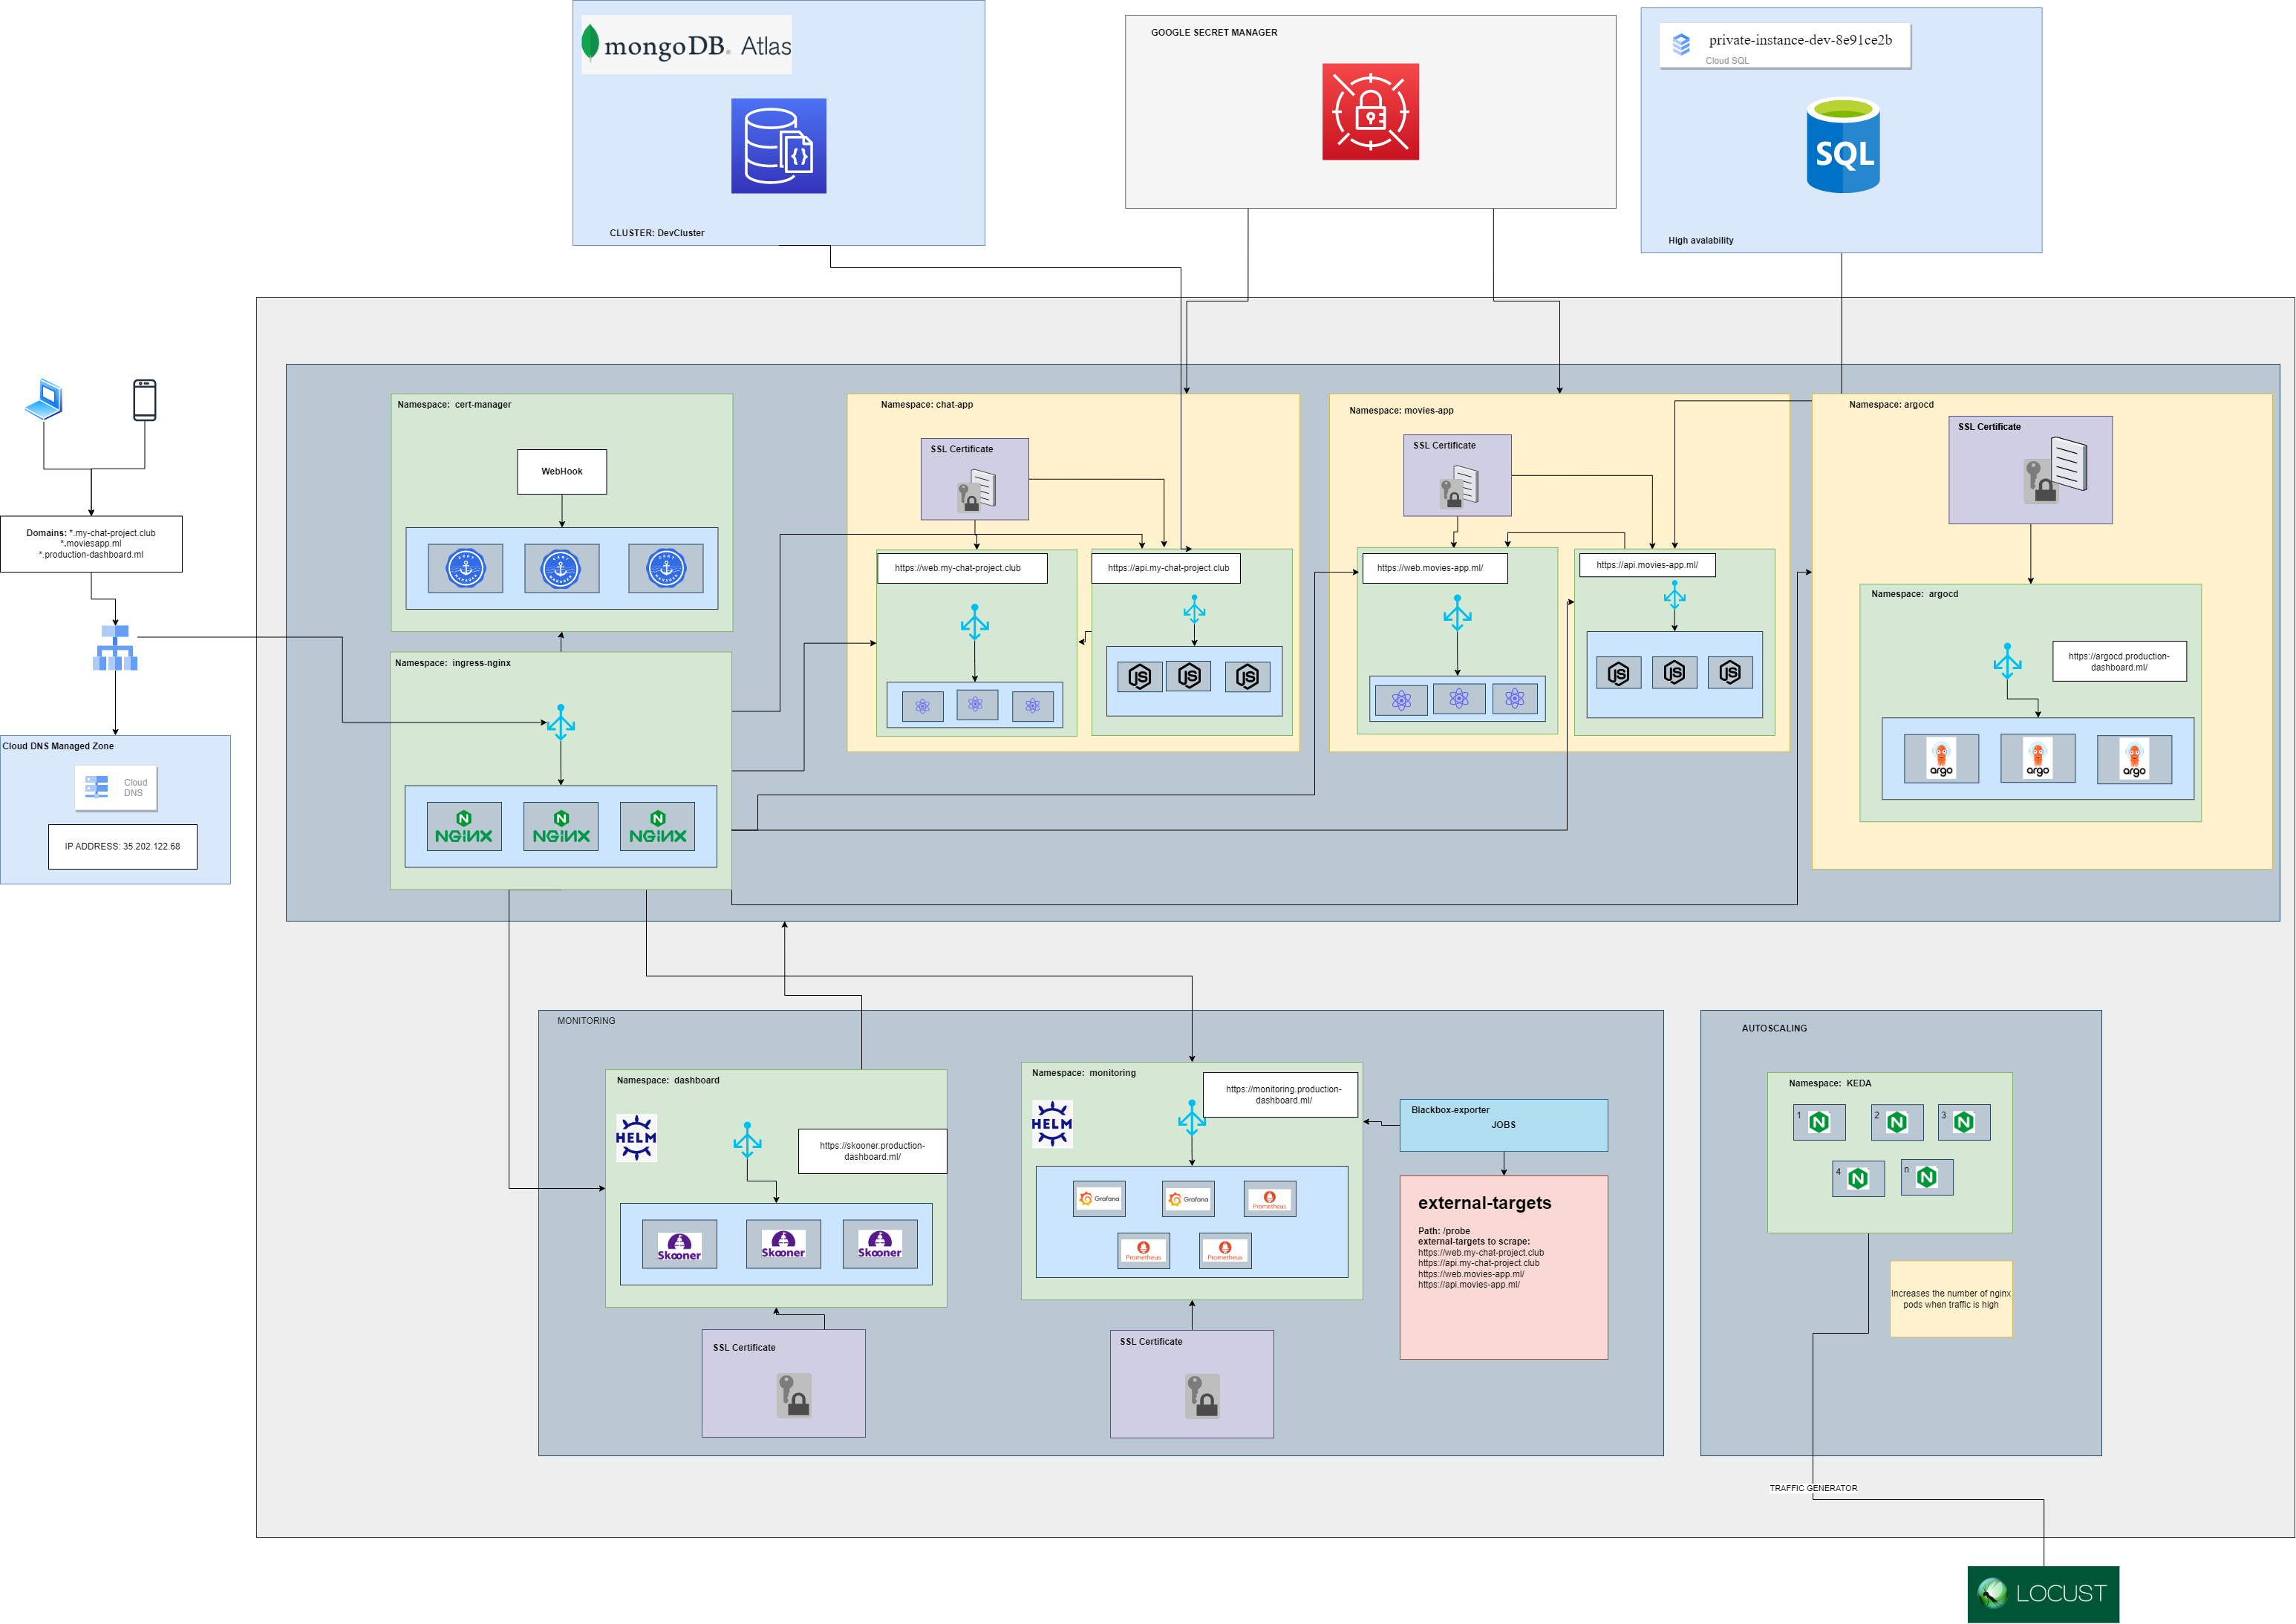
For the management of both applications infrastructure Terraform was used, because provides an Infrastructure as Code Solution, where we can have all the Google Cloud Platform Resources that can be created with a CI/CD pipeline
| Trigger | Action |
|---|---|
| tf-plan | Executes a terraform plan when the develop branch is pushed |
| tf-apply | Executes a terraform apply when the staging branch is pushed |
For added security, the sensible information was managed by Google Secret Manager, where we can store all the important information such as tokens, string connections, users and passowrd for databases.
| Trigger | Action |
|---|---|
| tf-plan | Executes a terraform plan when the production branch is pushed |
| tf-apply | Executes a terraform apply when the main branch is merged from production branch |
For this project, the registry used is Google Container Registry, for this purpose a CI/CD pipeline was build using GitHub Actions. A different CI/CD pipeline was built for each application and environment used in this project.
| App | Link to pipeline file |
|---|---|
| Chat App Services | Link |
| Chat App Frontend | Link |
| Movies App Services | Link |
| Movies App Frontend | Link |
| App | Link to pipeline file |
|---|---|
| Chat App Services | Link |
| Chat App Frontend | Link |
| Movies App Services | Link |
| Movies App Frontend | Link |
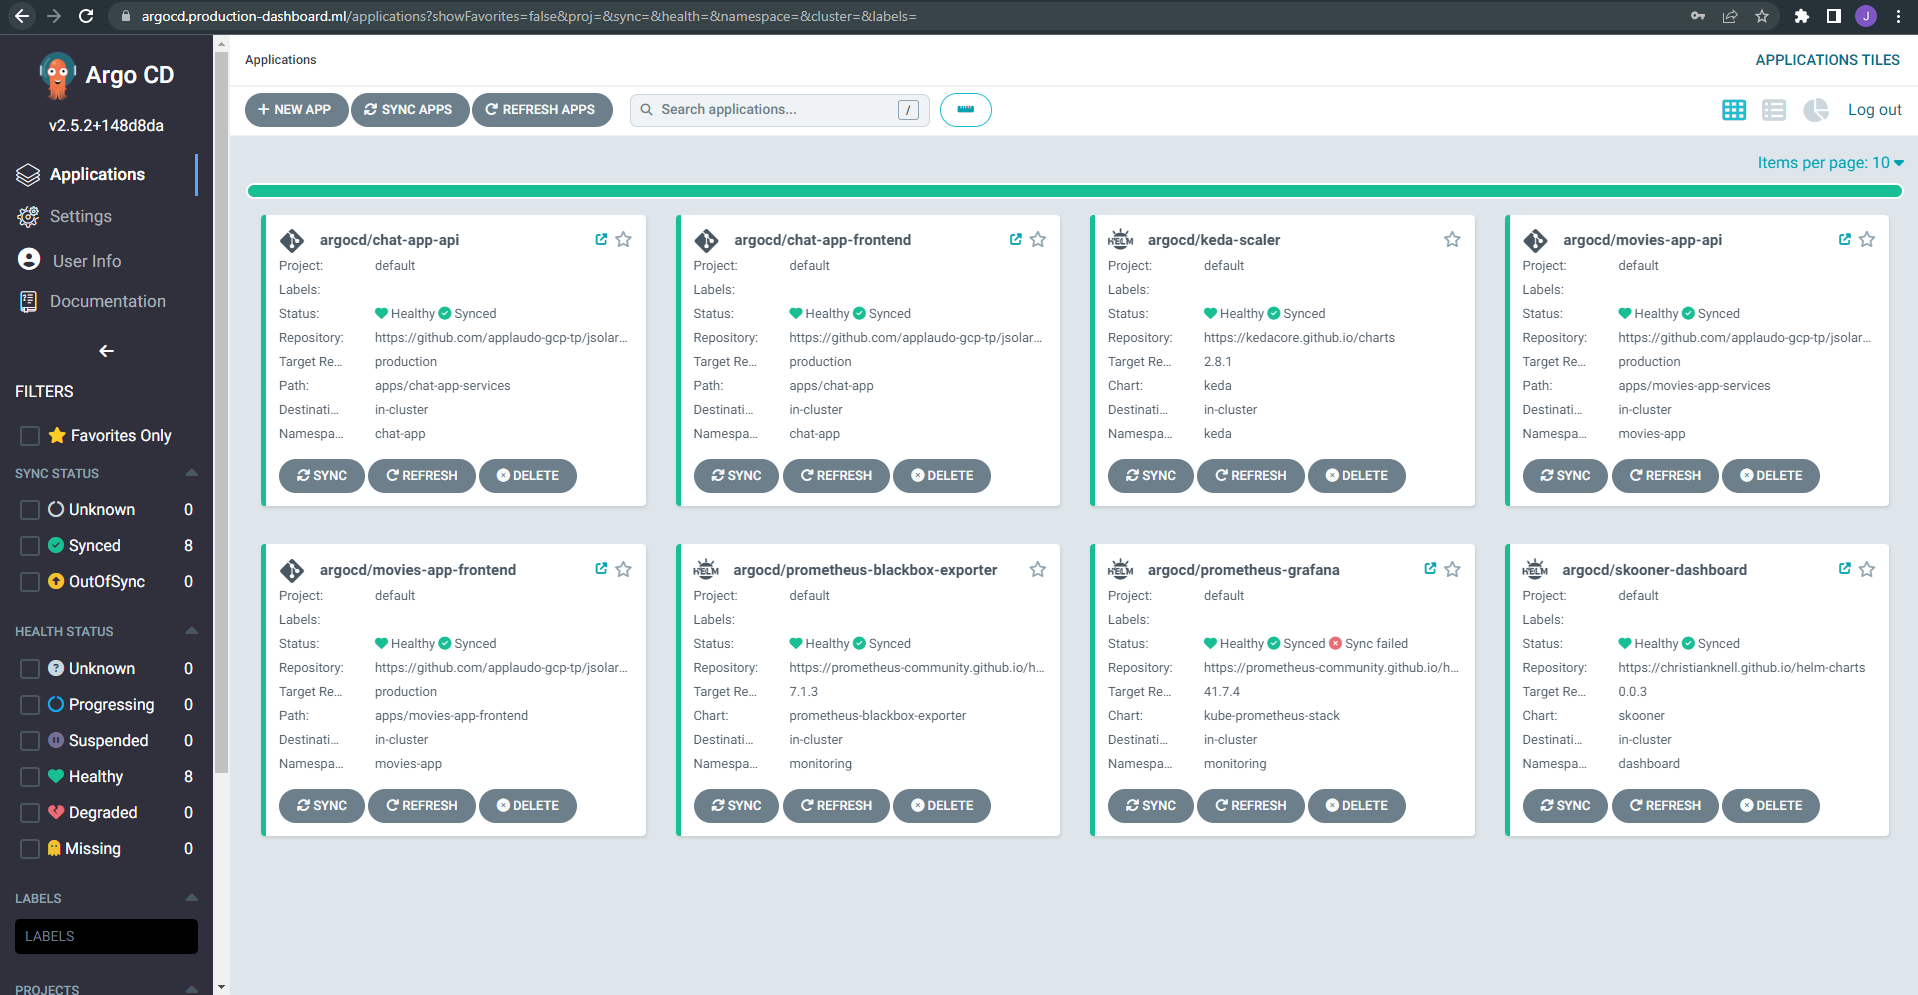
ArgoCD was used for the application configuration powered by Kubernetes, where each one of the frontend, monitoring, scaling and services that are managed with ArgoCD that allow to keep the state of the appllication syncronized with the "Source of Truth" that is all our repositories that are located in GitHub.
When the GitHub Repository has a new change (push), the application will be synchronized and will apply the new changes.
The ArgoCD Dashboard (for both environments) looks like this:
And the GitHub and Helm repositories connected with argoCD
| Resource Name | Description |
|---|---|
| Cloud SQL for MySQL: Regional - Micro instance in Americas | CP-DB-F1-MICRO |
| Cloud SQL for MySQL: Regional - Standard storage in Americas | CP-DB-F1-MICRO |
| E2 Instance Core running in Americas | CP-COMPUTEENGINE-VMIMAGE-E2-STANDARD-2 |
| E2 Instance Ram running in Americas | CP-COMPUTEENGINE-VMIMAGE-E2-STANDARD-2 |
| Cloud Build - Default | CP-CLOUDBUILD |
| Standard Storage US Regional | CP-BIGSTORE-STANDARD |
| Standard Storage US Regional | CP-BIGSTORE-STANDARD |
| N1 Predefined Instance Core running in Americas | CP-COMPUTEENGINE-VMIMAGE-N1-STANDARD-1 |
| N1 Predefined Instance Ram running in Americas | CP-COMPUTEENGINE-VMIMAGE-N1-STANDARD-1 |
| Balanced PD Capacity | CP-COMPUTEENGINE-STORAGE-PD-READONLY |
The estimated cost of the development environment of the project you can find it here
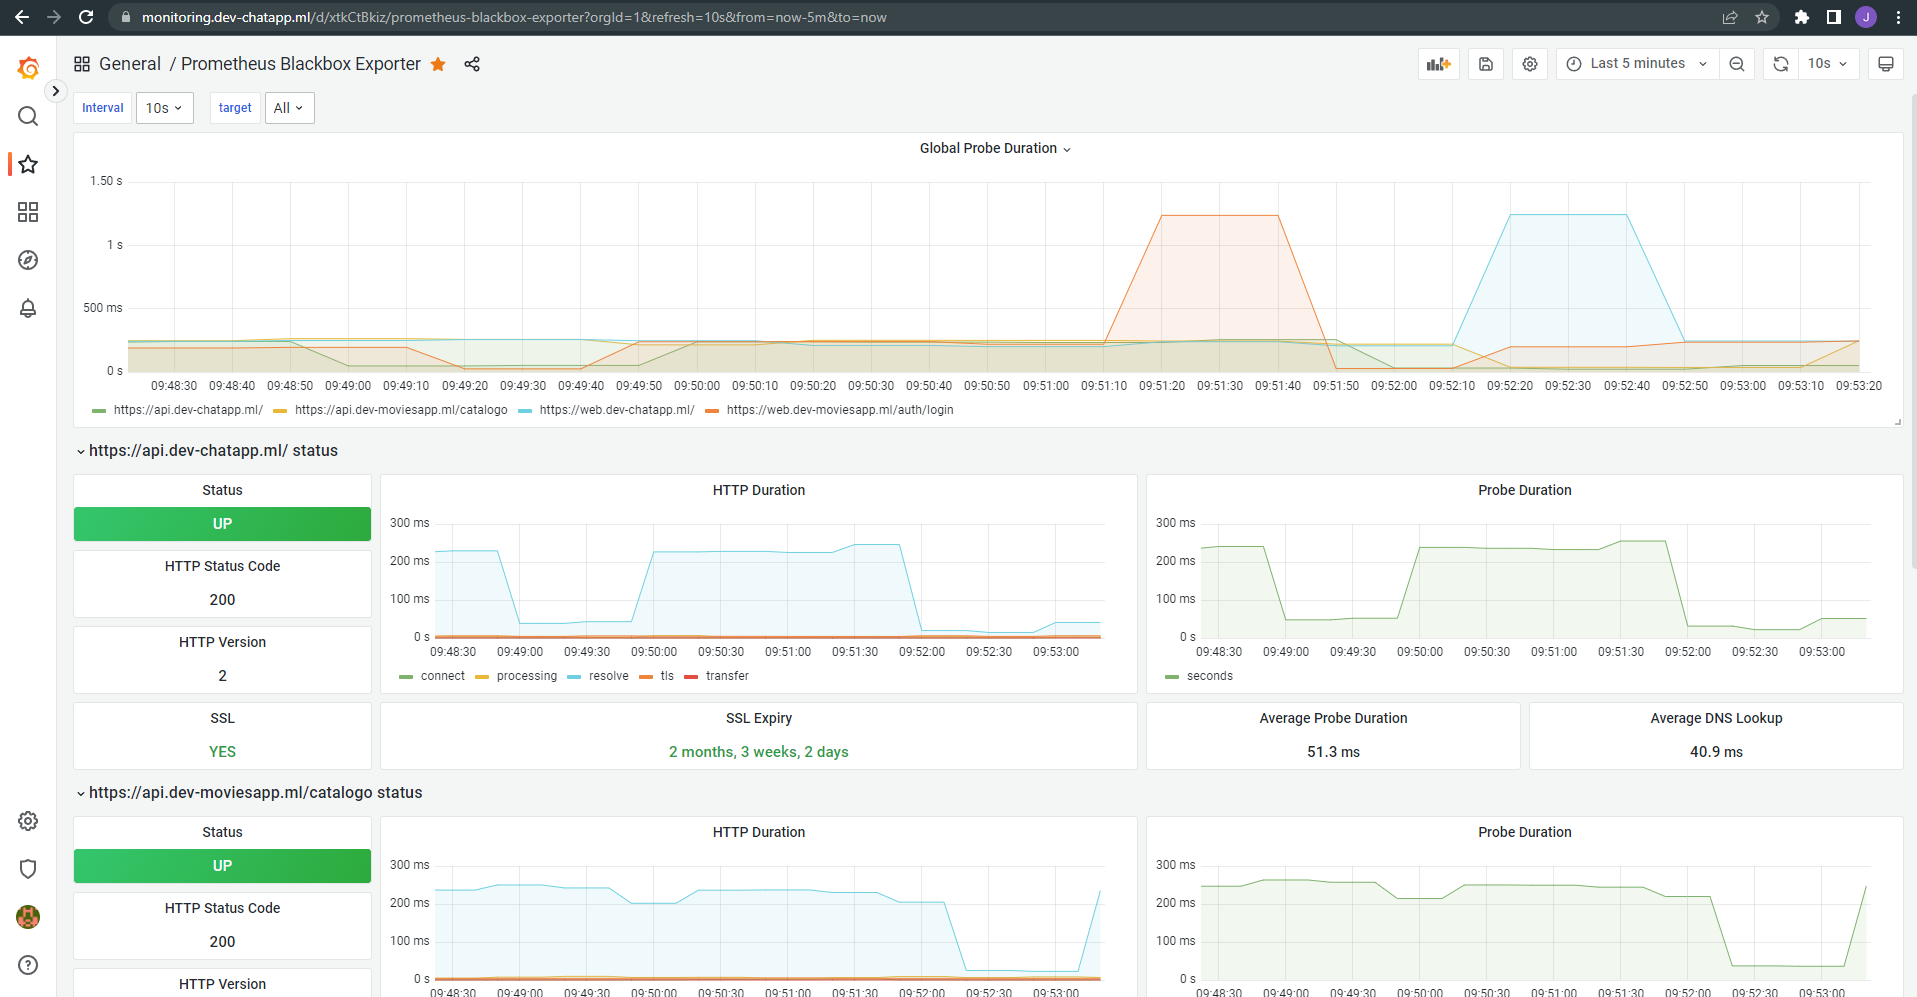
For the monitoring of development environment Grafana and prometheus was used. Prometheus is an open source monitoring system for which Grafana provides out-of-the-box support. This topic walks you through the steps to create a series of dashboards in Grafana to display system metrics for a server monitored by Prometheus
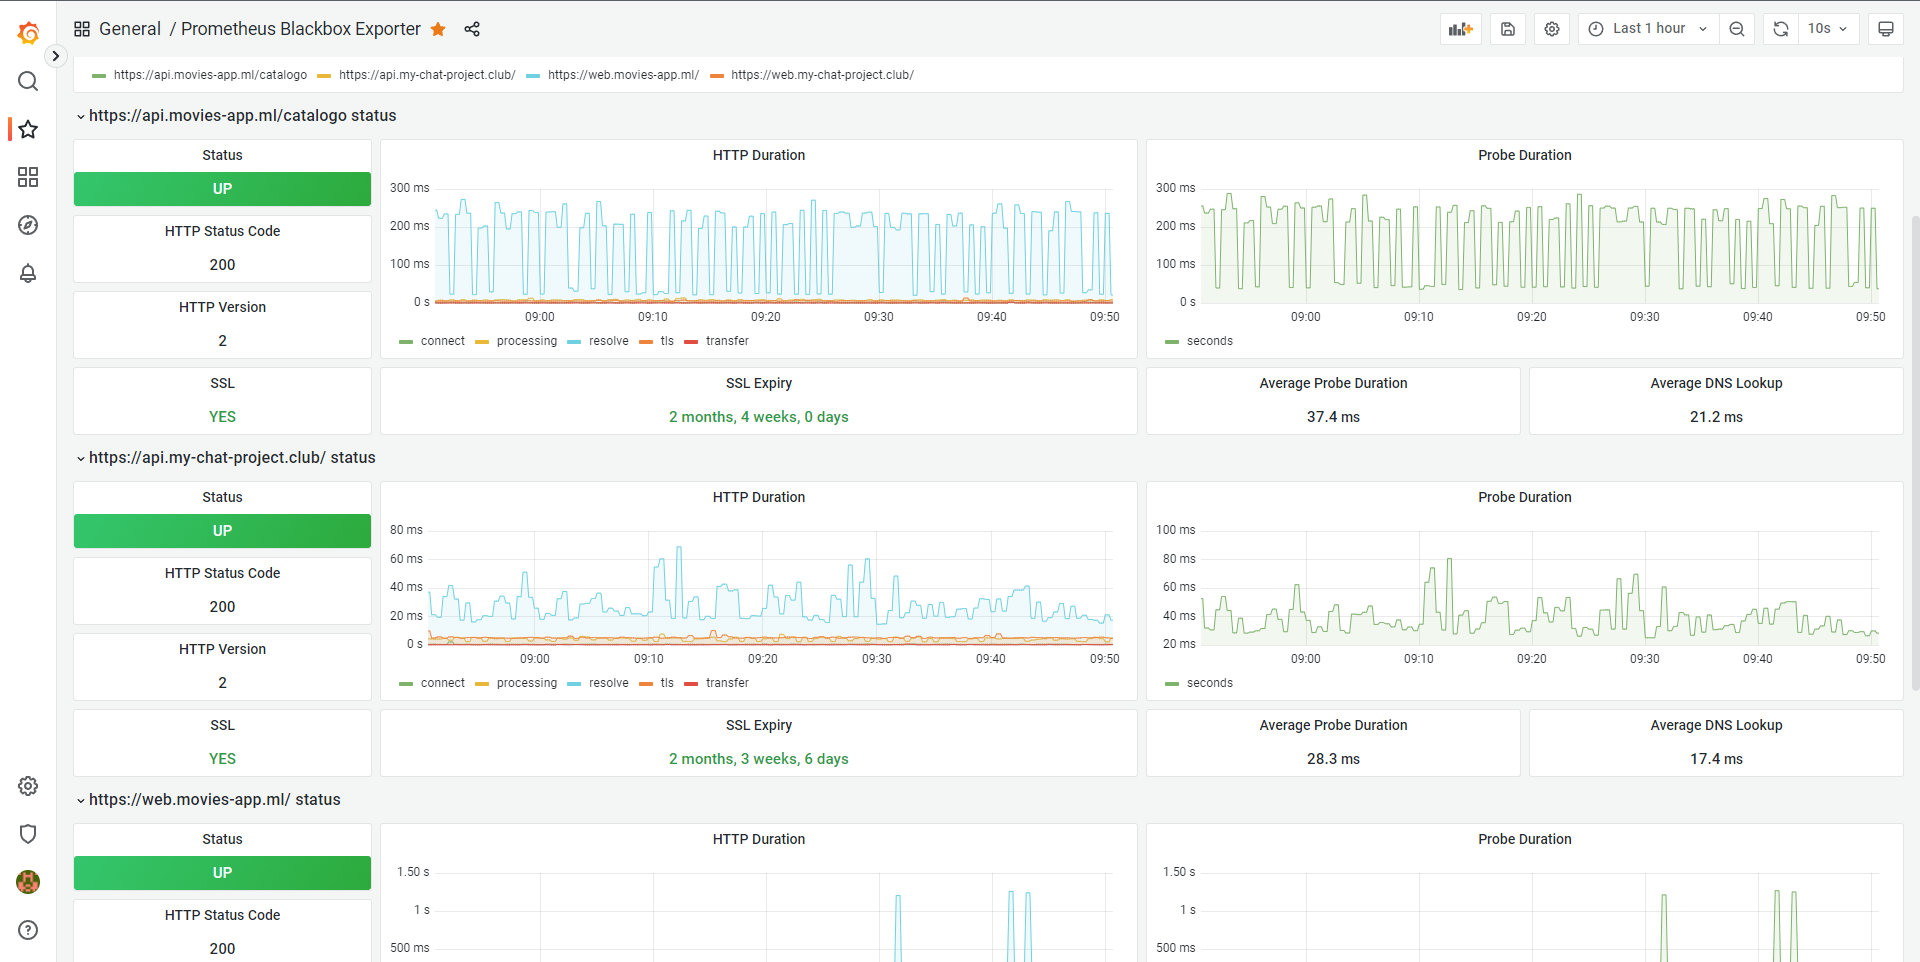
Blackbox exporter provides us an exploration of several network protocols and give to user multiple metrics, that can be useful to get a general state of the appllication.
Metrics collected by Prometheus blackbox Exporter:
- Endpoint status
- Response time
- Redirect information
- Certificate expiration dates.
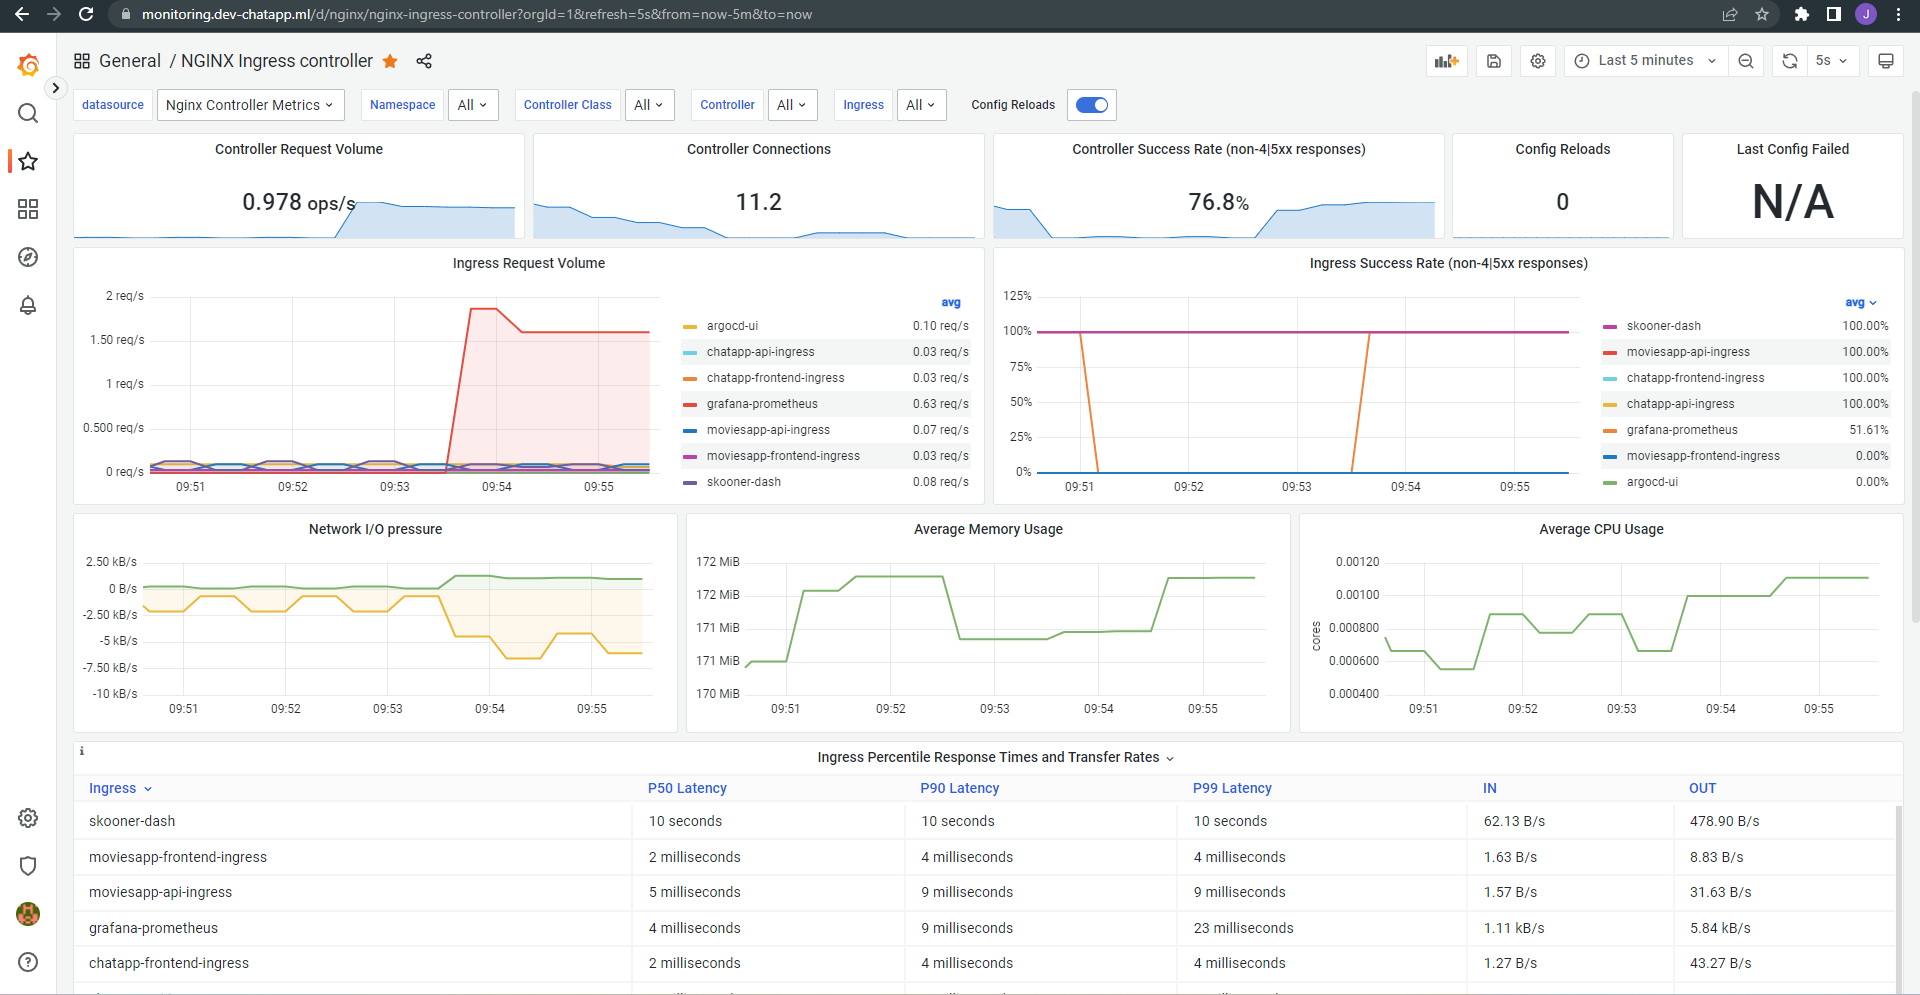
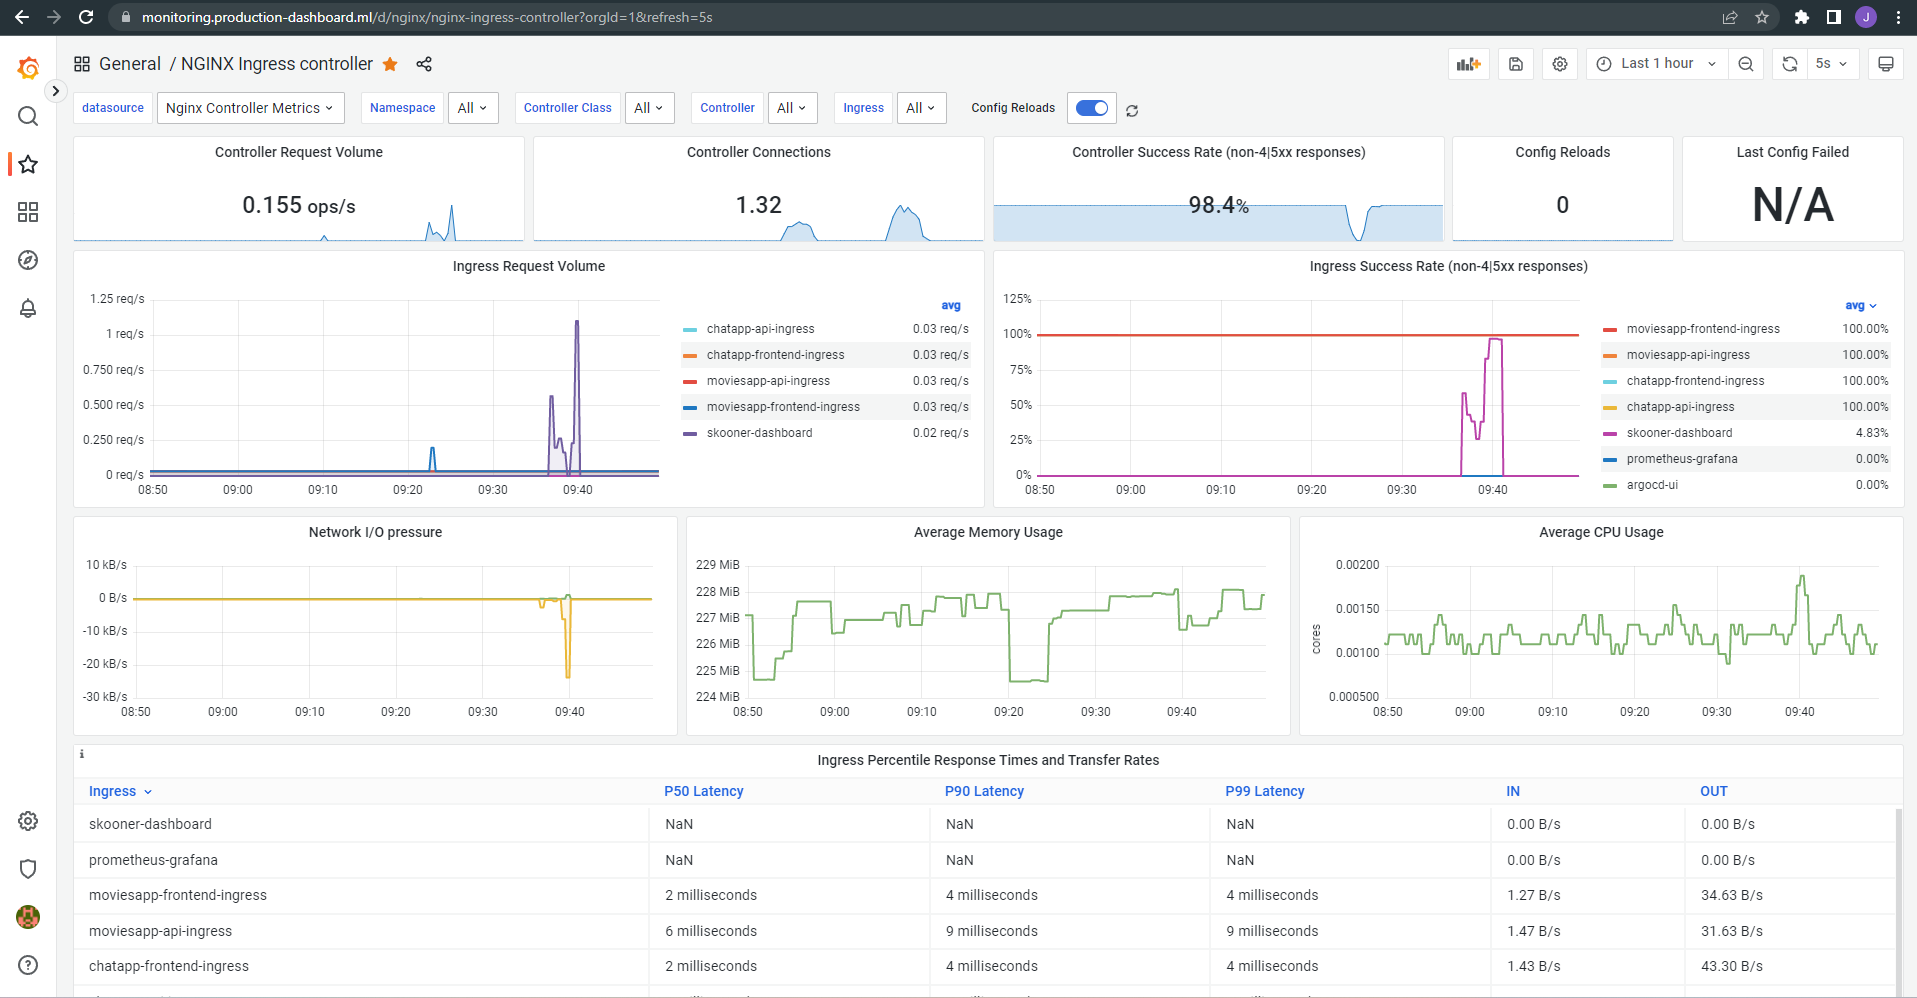
Nginx controller metrics collects the following metrics
- Ingress resquest volume
- Average Memory usage
- Average CPU usage
- Ingress Percentile Response times and transfer rates
- Ingress Certificate
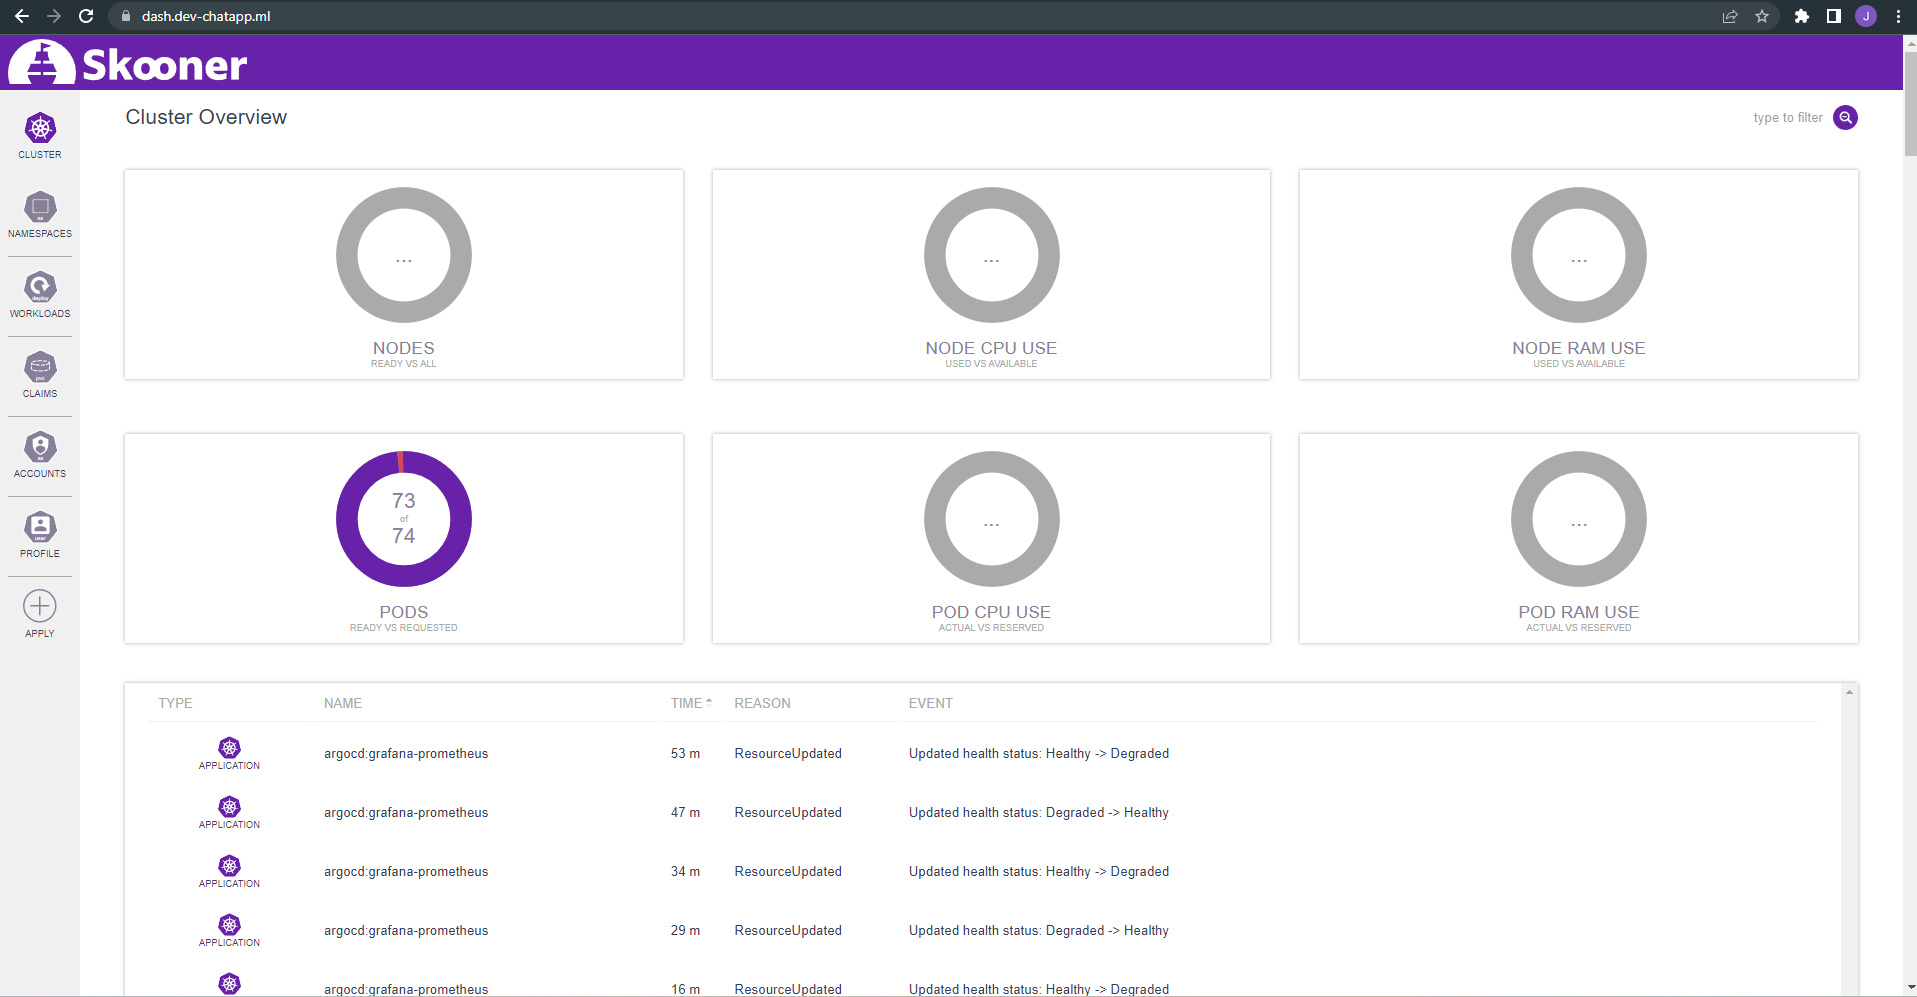
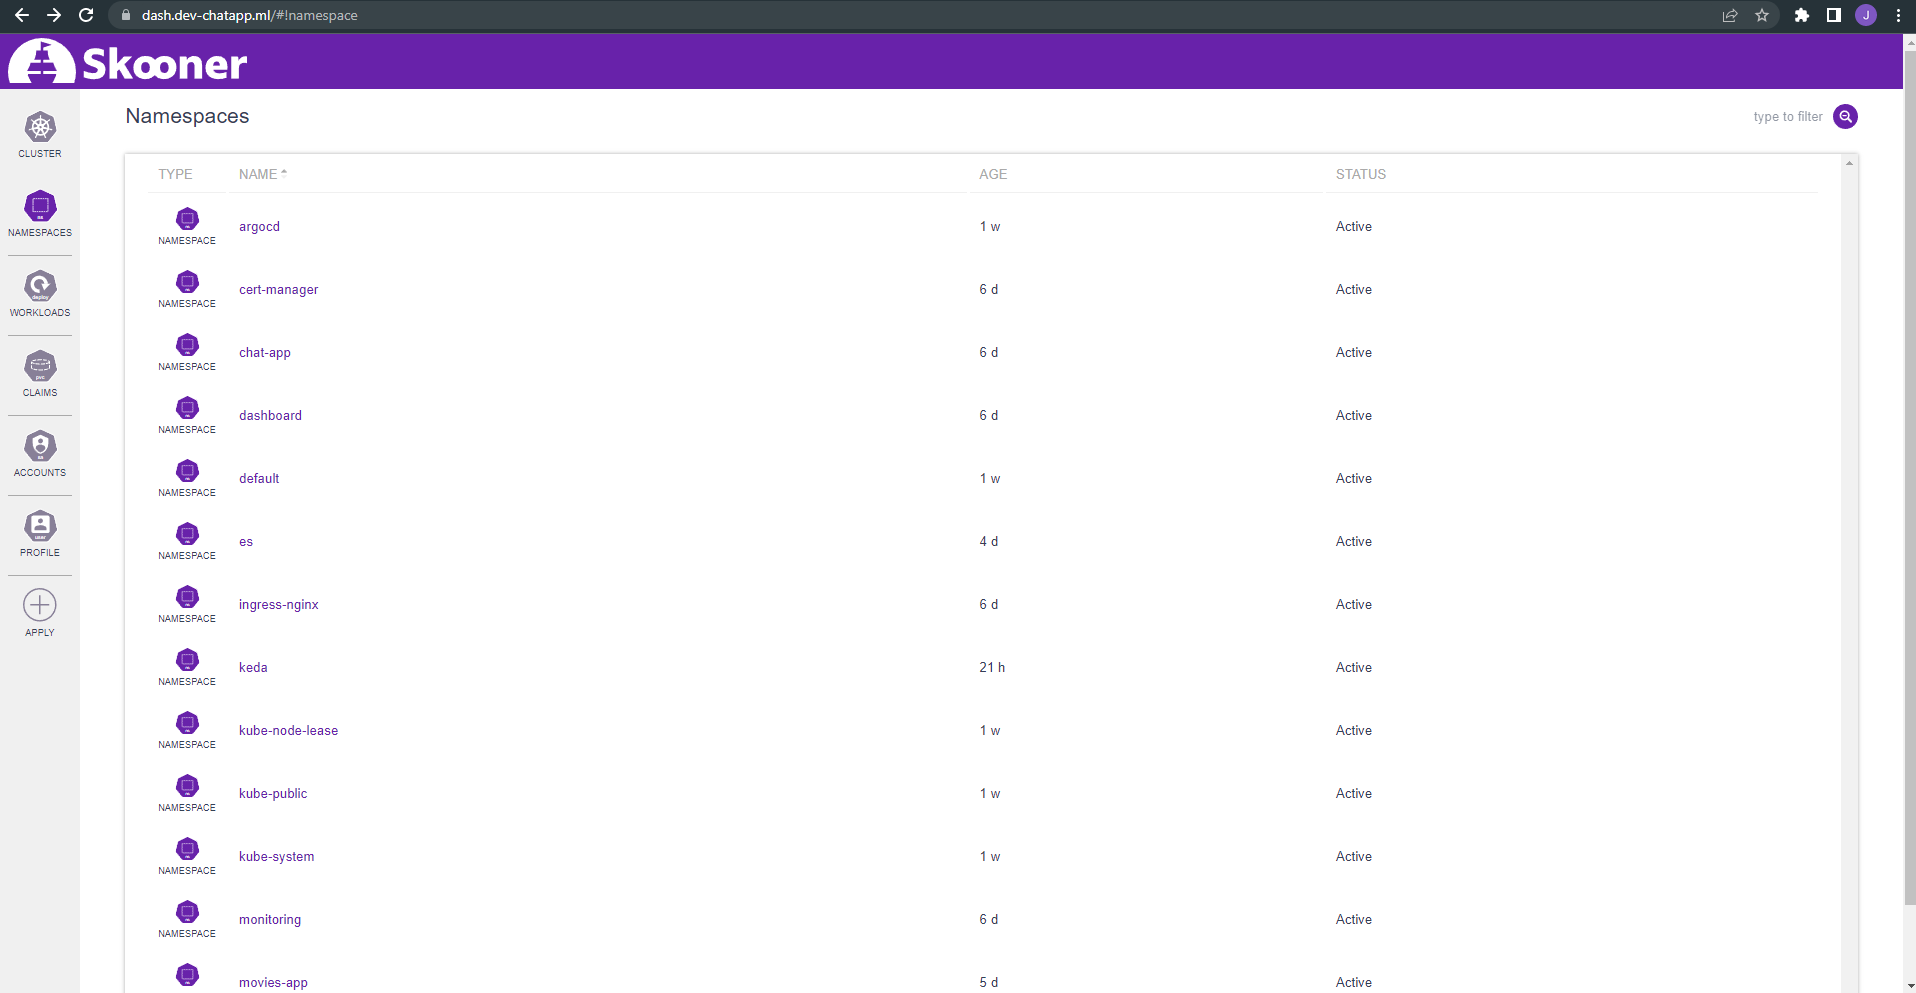
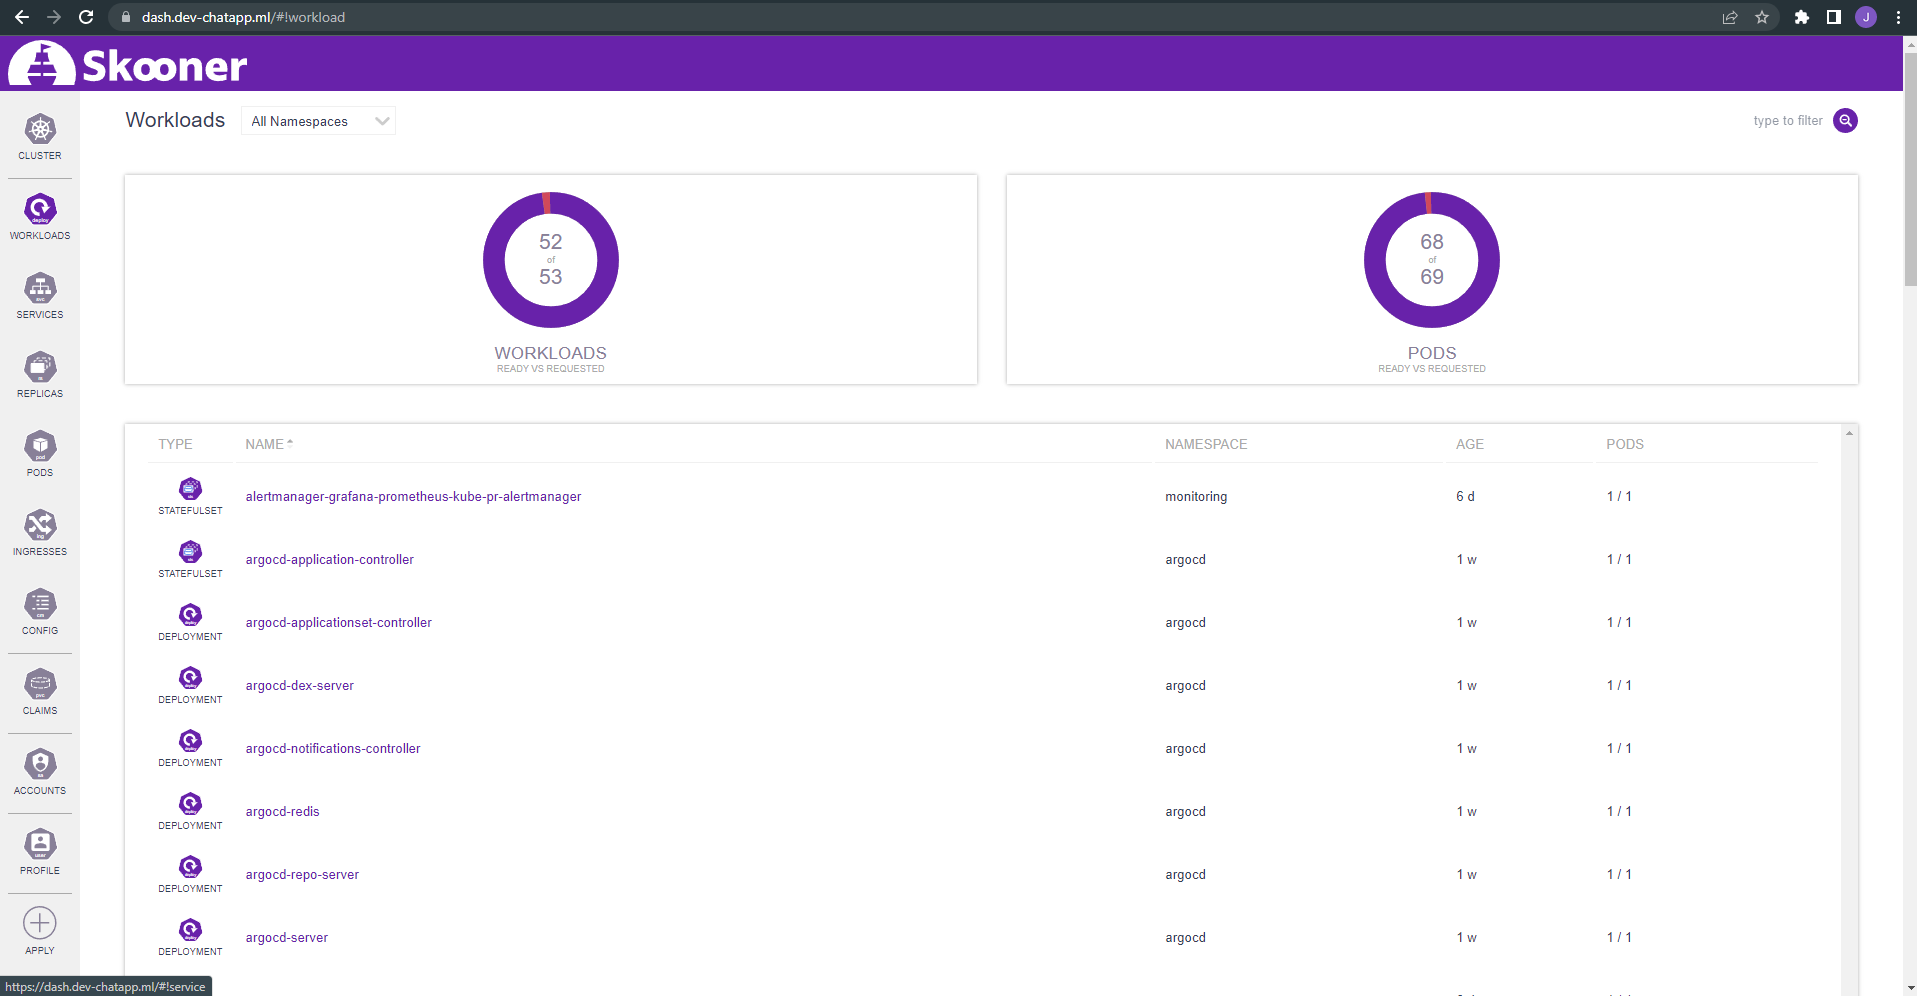
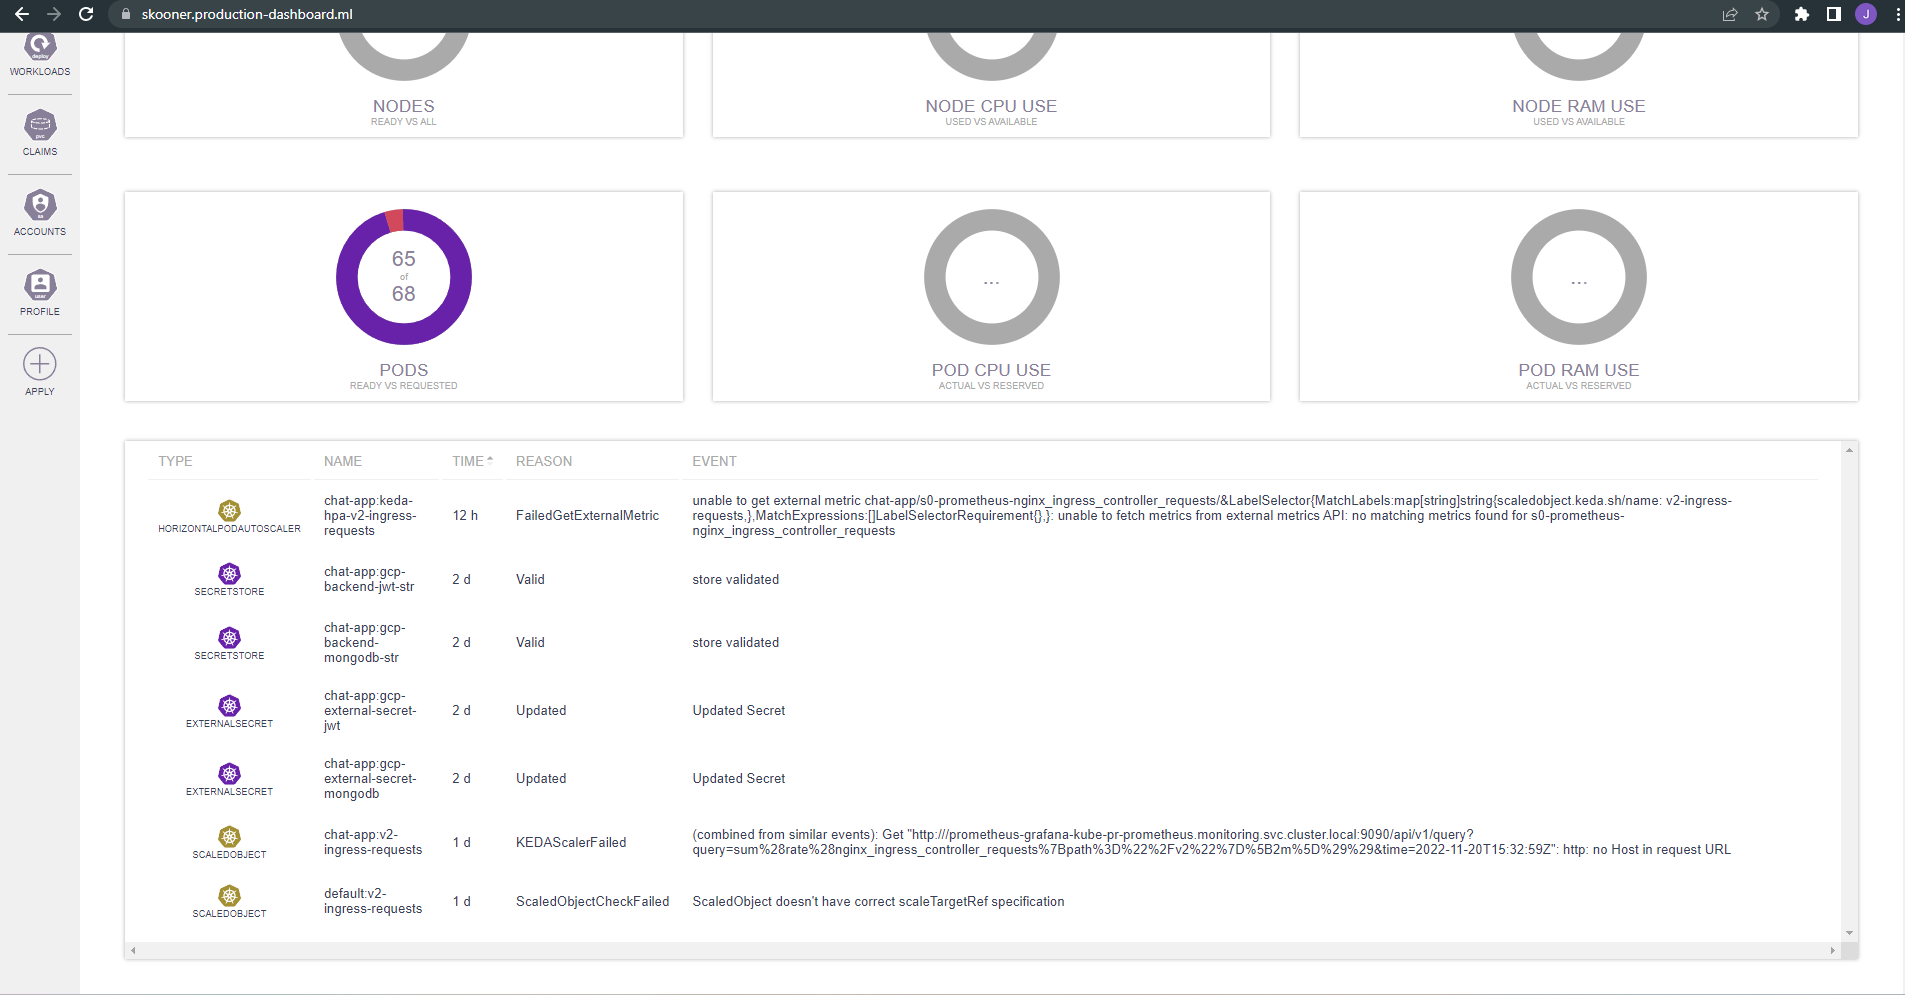
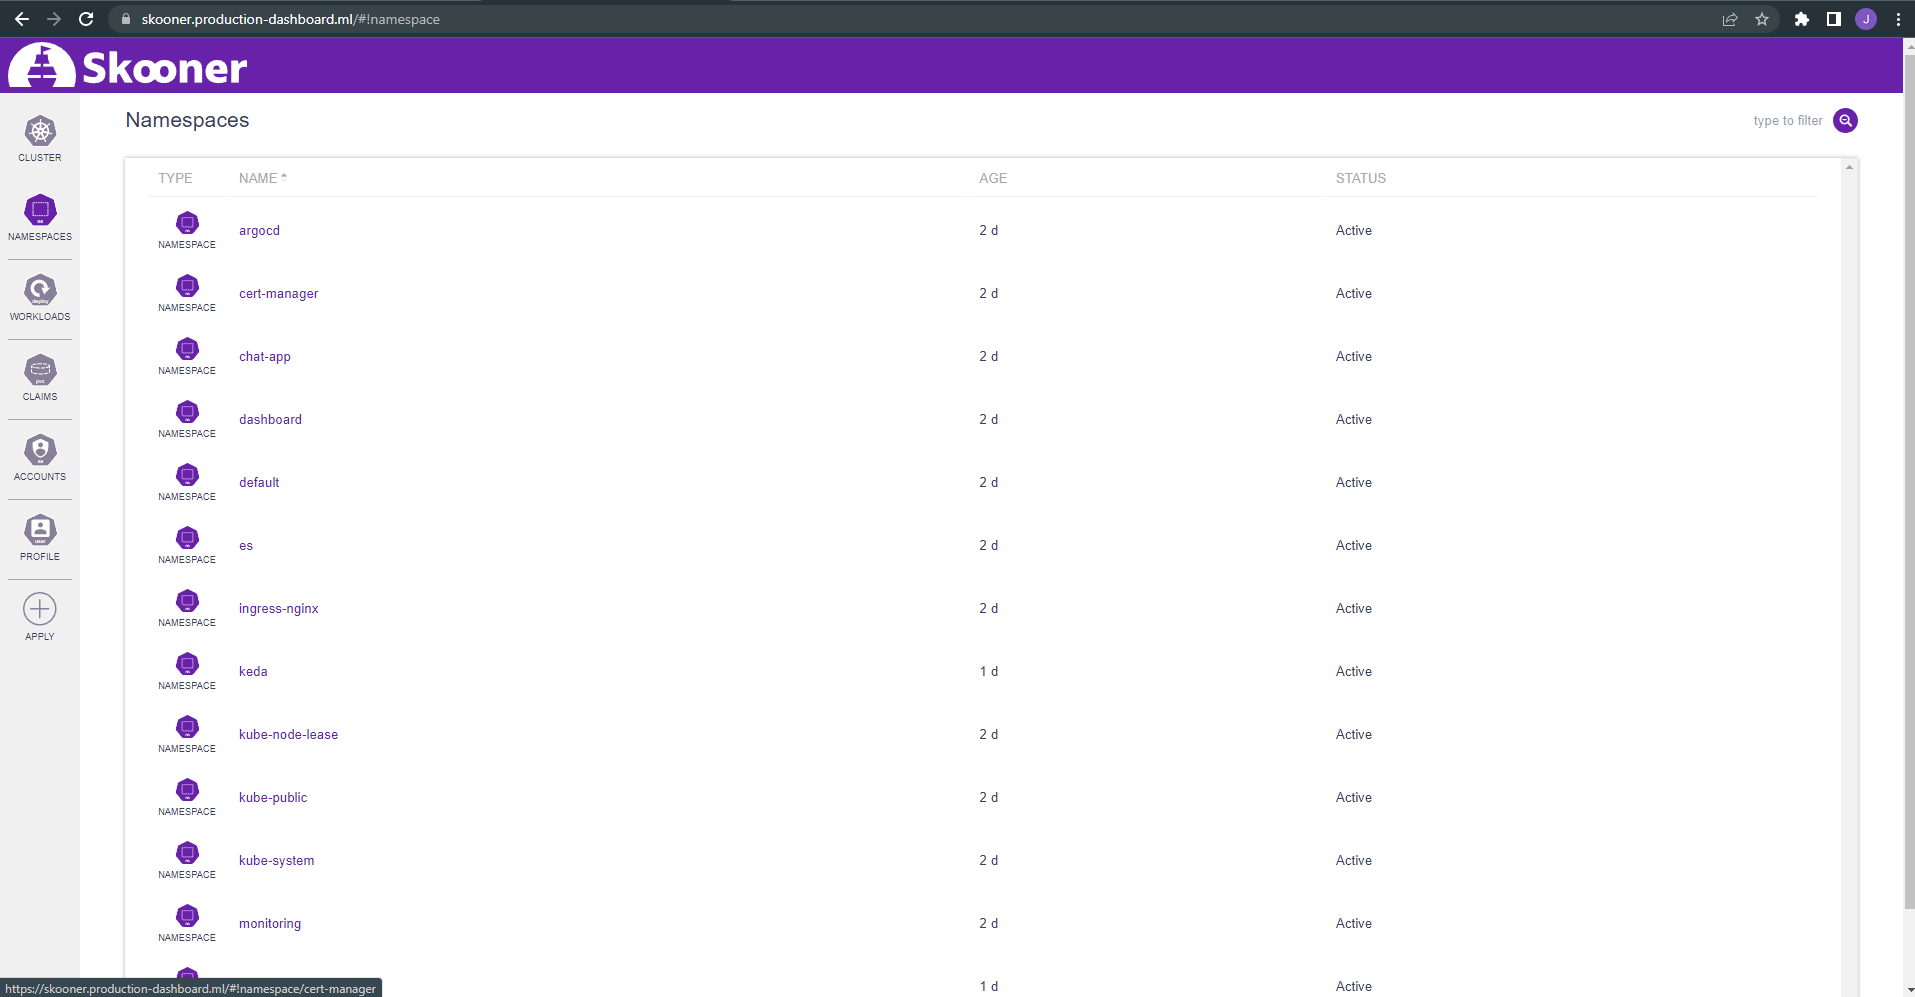
Skooner is an solution that provides us for an overview of the Kubernetes Cluster, with a web GUI instead of command line.
| Resource Name | Description |
|---|---|
| E2 Instance Core running in Americas | CP-COMPUTEENGINE-VMIMAGE-E2-STANDARD-2 |
| E2 Instance Ram running in Americas | CP-COMPUTEENGINE-VMIMAGE-E2-STANDARD-2 |
| Cloud Build - Default | CP-CLOUDBUILD |
| Standard Storage US Regional | CP-BIGSTORE-STANDARD |
| Standard Storage US Regional | CP-BIGSTORE-STANDARD |
| N1 Predefined Instance Core running in Americas | CP-COMPUTEENGINE-VMIMAGE-N1-STANDARD-2 |
| N1 Predefined Instance Ram running in Americas | CP-COMPUTEENGINE-VMIMAGE-N1-STANDARD-2 |
| Cloud SQL for MySQL: Regional - Micro instance in Americas | CP-DB-F1-MICRO |
| Cloud SQL for MySQL: Regional - Standard storage in Americas | CP-DB-F1-MICRO |
| Balanced PD Capacity | CP-COMPUTEENGINE-STORAGE-PD-READONLY |
The estimated cost of the of the project for a production environment you can find it here
(The estimated value of the production environment is monthly).
- Note that the price for the production environment price is higher than the develompment environment, due to multiple factors:
- The Kubernetes Cluster has more capacity for bigger workloads and horizontal scaling of applications.
- The Cloud SQL instance has the feature of High Availabilty enabled.

