Vehicle Detection Project
The goals / steps of this project are the following:
- Perform a Histogram of Oriented Gradients (HOG) feature extraction on a labeled training set of images and train a classifier Linear SVM classifier
- Optionally, you can also apply a color transform and append binned color features, as well as histograms of color, to your HOG feature vector.
- Note: for those first two steps don't forget to normalize your features and randomize a selection for training and testing.
- Implement a sliding-window technique and use your trained classifier to search for vehicles in images.
- Run your pipeline on a video stream (start with the test_video.mp4 and later implement on full project_video.mp4) and create a heat map of recurring detections frame by frame to reject outliers and follow detected vehicles.
- Estimate a bounding box for vehicles detected.
Rubric Points
Here I will consider the rubric points individually and describe how I addressed each point in my implementation.
The project implementation consist of following files:
helper.py: collections of helper functions for feature extraction, heatmap and thresholdingsubsample_pipeline: pipeline for finding a car in each frameCachedata.py: tracking last n frame and averaging heatmap and labelstrain_pipeline.py: training pipeline for distinguishing car object from non-car objecttracker.py: tracking algorithm for detecting vehicles in the video
1. Explain how (and identify where in your code) you extracted HOG features from the training images.
The code for this step is contained in lines 19 through 93 of the file called train_pipeline.py).
I started by importing dataset for vehicles and non-vehicles and explored some examples, then I started to visualise hog features that I tried to extract. I visualised it like this:

Above operation is applied using function get_hog_feature found in line 34 of helper.py file. I then explored different color spaces YCrCb has shown the best result. HOG parameters of orientations=9, pixels_per_cell=(8, 8) and cells_per_block=(2, 2) .
It was interesting to see in the image that car_hog feature represents clearly a car and that is a good feature for training our model.
I tried various combinations of parameters for hog feature with different channels with various orientation values and pixel per cell. My final choice of parameters for hog features were as followsorientations=9, pixels_per_cell=(8, 8) and cells_per_block=(2, 2). You can find these values in lines 54 through 56 of the file called train_pipeline.py.
3. Describe how (and identify where in your code) you trained a classifier using your selected HOG features (and color features if you used them).
I decided to use a linear SVM using all three hog, histogram and spatial features have a look at parameters:
| Parameter | Value |
|---|---|
| color space | YCrCb |
| orientation | 9 |
| pixel per cell | 8 |
| cell per block | 2 |
| hog channel | ALL |
| spatial size | (64 x 64) |
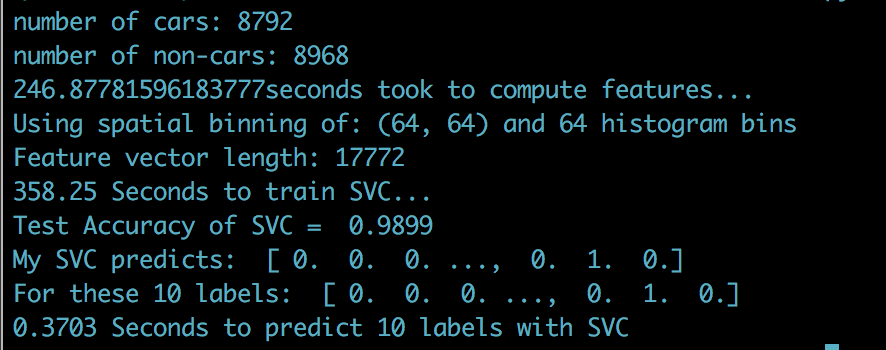
I used the features that I extracted using extract_features function from helper.py and applied the scaler function using StandardScaler() from sklearn to normalise the data and then I transform to each feature vector that I stacked together using StandardScaler().transform, besides I also generate labels for cars and non-car. After data is preprocessed , data is splitter into training and test data with train_test_split sklearn . I then created an SVM and ran training on training data. The result came up as follows when trained on my machine :

Testing accuracy of almost 99 percent was a satisfiable result to proceed testing on unseen data. I stored all the parameters I used during training with SVC in a pickle file to use for the test images and video frames.
1. Describe how (and identify where in your code) you implemented a sliding window search. How did you decide what scales to search and how much to overlap windows?
The code for this step is find_cars function contained in lines 26 through 99 of the file called subsample_pipeline.py).
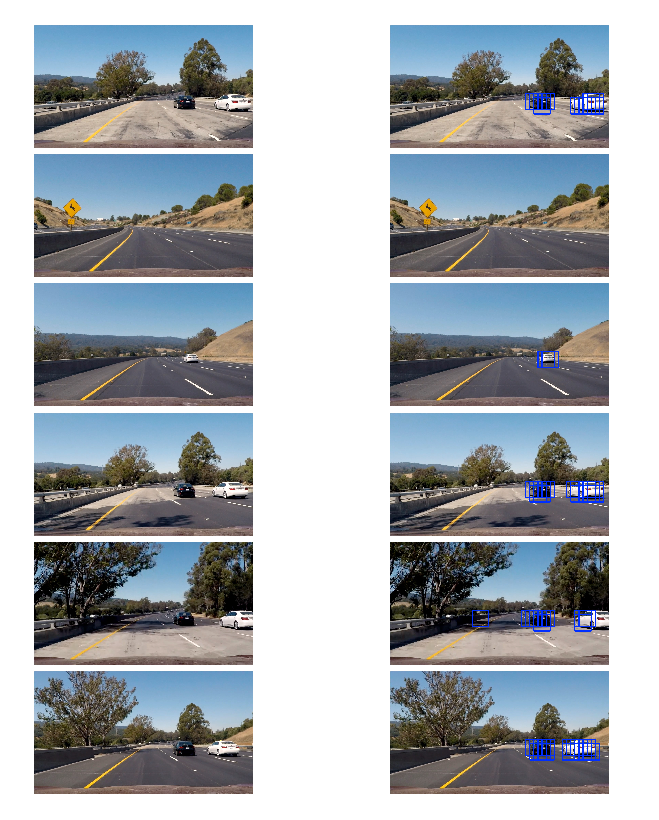
As recommended in lecture, to avoid slow computing by sliding window and calculating hog features each time, Instead of recomputing hog when we have a new image, efficient way is taking hog feature for entire image only once and subsampling that to extract feature for each window. I defined ystart = 400 and ystop=656 for y direction in the image because out region of interest are cars which are naturally on the road, we don't restrict the x axes. I also set a scale =1.5 its a trick for searching different window sizes, it will scale the entire image and apply hog and then subsample, this will resample different window sizes. The function pipeline will extract hog, spatial feature and then predict those on trained svc model. If we got a correct prediction then we draw a box around detected match with given scale. Result is good but classifier also detected some false positive detection on test images shown in the fifth row.
2. Show some examples of test images to demonstrate how your pipeline is working. What did you do to optimize the performance of your classifier?
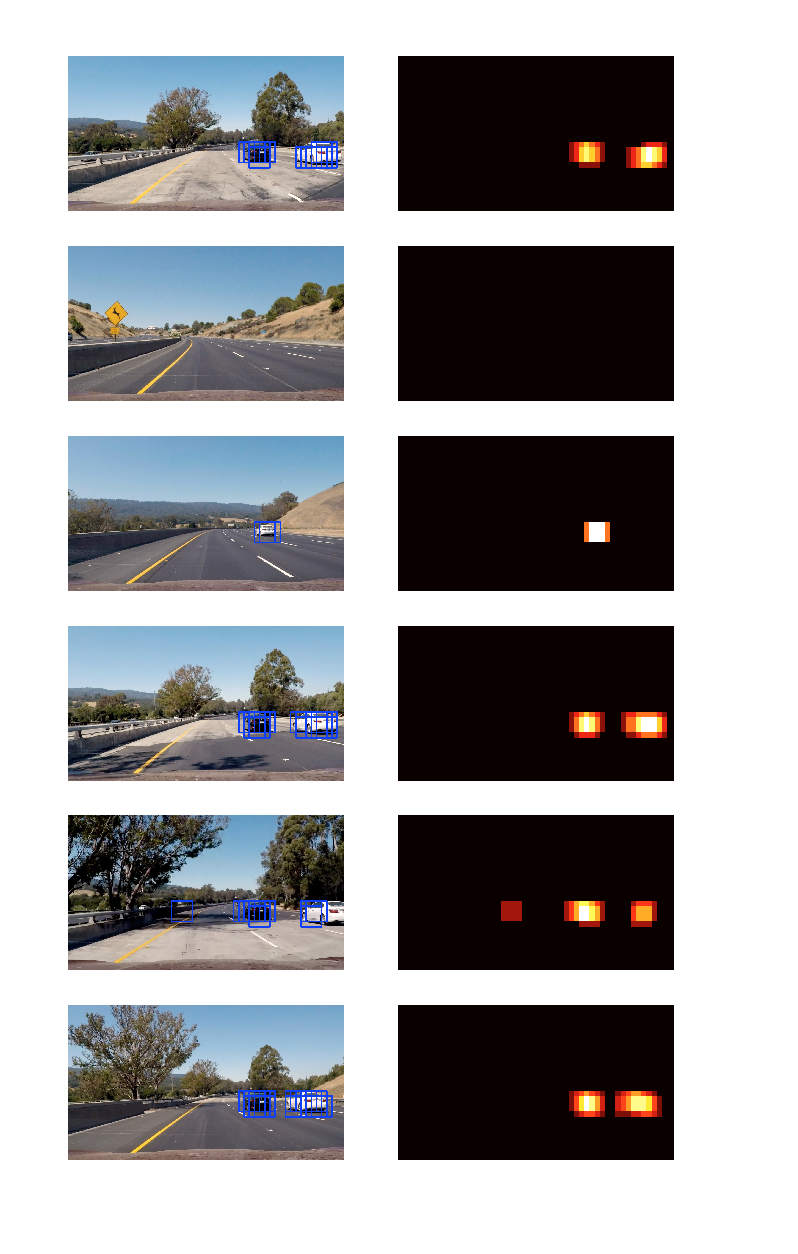
To optimise the classifier and identifying overlapping and false positives I explored test images by applying heat map to each test image, This is when there is a correct prediction we will add heat to the heat map image in the area we found a car, since we have different scale we will have overlapping bounding boxes. Visualisation of these step with heat map results like this:
The heat map that we are generating shows the hot spots in the heatmap let us draw only one box around the vehicle. Also notice the false positive. This should be filtered out in a video pipeline in the later stage using threshold.
1. Provide a link to your final video output. Your pipeline should perform reasonably well on the entire project video (somewhat wobbly or unstable bounding boxes are ok as long as you are identifying the vehicles most of the time with minimal false positives.)
Here's a link to my video result
<iframe width="850" height="415" src="./tracked_video.mp4" frameborder="0" ></iframe>2. Describe how (and identify where in your code) you implemented some kind of filter for false positives and some method for combining overlapping bounding boxes.
The code for this step is process function contained in lines 30 through 58 of the file called track.py).
For the video process in order to get a less wobbly effect , I have created a class called CacheData to keep track of last 3 heat maps that are detected in the previous frames and average it when drawing boxes, this number is result of experimenting 5, 10 , 15 frames. I have used similar parameters for hog and window sizes. To get rid of false positive after averaging the heat maps over last 3 frames, I thresholded that heat map set to threshold = 1.
Here's an example result showing the heatmap from a series of frames of video, the result of scipy.ndimage.measurements.label() and the bounding boxes then overlaid on final output frame of test image(also video works the same way):
1. Briefly discuss any problems / issues you faced in your implementation of this project. Where will your pipeline likely fail? What could you do to make it more robust?
Here I'll talk about the approach I took, what techniques I used, what worked and why, where the pipeline might fail and how I might improve it if I were going to pursue this project further.
I spend considerable amount of time exploring the data and what features might be useful, I trained my model with hist feature alone , then I tried color features, also combined them with hog features. This process led to different test accuracy result using linear support vector machine. For window search first I tested hog feature extraction per window of different scale for the whole image but that led to the lot of outliers. I then enhanced my window search with subsampling. Finally detected vehicles for unseen images was having a minimum false positives using subsampling method.
SVM worked well because we had a good scaled data and processing steps, the prediction result gave minimum subsamples and together with averaging the heat maps and applying threshold, model successfully could remove the false positives.
smaller vehicles further way in the image is not detected.
Drawing boxes scale can be better drawn around the detected car, also would be best to also detect small cars further away.


