This repository is a contribution to the Amazon Sustainability Data Initiative (ASDI) Global Hackathon 2022.
The idea is to support the UN Sustainable Development Goal Nr. 11 Sustainable Cities and Communities by analyzing the development of urban green areas by the example of Freising a small city near Munich, Germany.
- check http://greenscreen.sommergis.de/ for a working demo app
- install all Python packages from the requirements.txt
pip3 install -f requirements.txt - run the processing chain: change the city name to your city in
scripts/processing.py - change the city name in
src/app.pyand adjust the statistics loading - run streamlit app with
streamlit run app.py
The goal is to collect and analyze data on urban green spaces and visualize it in an appealing way with interactive maps and graphics so that the resulting information is easy to understand.
The methods and outcomes of this project shall be transferable to other cities. This is ensured by a high level of automation of the data processing and the usage of global avaliable datasets.
The information shall be derived with the support of the following available datasets of ASDI:
Additional datasets:
The following methods shall be evaluated regarding their application in the project:
- machine learning / deep learning based classification
- classic remote sensing analysis & statistial methods
- change detection
- development of a processing chain and a web app
Data shall be analyzed since 2017 until 2022. As the city of Freising is located on the northern hemisphere in the moderate climate zone the start of june should be fine for detecting vegetation.
Aggregated statistical results shall be dervied at GADM Level 3 (communities) for each year.
If applicable a more fine grained city boundary shall be created from the data. This finer boundary may be more valueable for insights because GADM Level 3 may contain the city itself with rural areas.
Furthermore various maps at pixel level analysis shall be compiled that show the urban green area development for each year.
Furthermore various maps at pixel level analysis shall be compiled that show the urban green area development for each year.
- create project logo (first draft)
- create video (first draft)
- checkout available resources on AWS
- SageMaker Labs account
- extra credits on AWS
- evaluate data & methods
- formulate technical road map
- implementation phase
- presentation (web page)
- create final project logo
- create final video
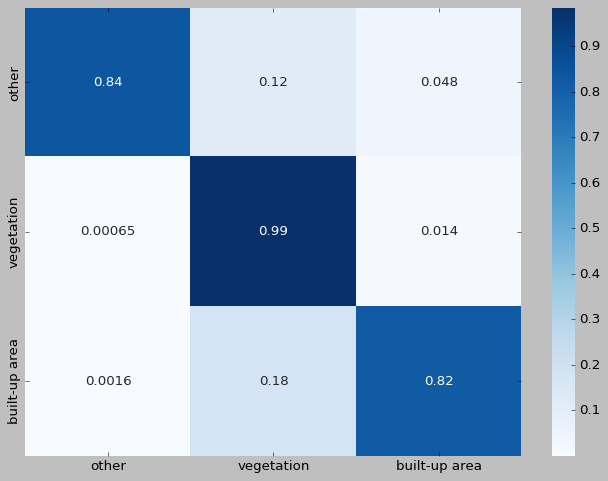
The idea was to train a machine learning model on the median composite of Sentinel-2 for the year 2020 with the ESA Worldcover 2020 map as ground truth for the landuse classification.Then the trained model shall predict vegetation, built up area/bare soil or other pixels for the years 2017,2018,2019,2021 and (if possible) 2022. Input features for the training of the machine learning model were remote sensing indices like NDVI, NDWI, NDBI and some GLCM texture metrics such as homogeneity and entropy. Several classification algorithms of the scikit learn package were tested - RandomForestClassifier and MLPClassifier performed best while MLPClassifier was even slightly better on recognizing textures like bigger buildings than RandomForestClassifier.
The current model trained on the ESA Landcover extent for the city of Freising for 3 classes (1: vegetation, 3: built up area, 0: other) had an overall accuracy of 96,6% scripts/esa_landcover_model_MLPClassifier_2022-08-29 13:04:16.912490_score_96_3classes.txt.
Dieses Repository ist ein Beitrag zum Amazon Sustainability Data Initiative (ASDI) Global Hackathon 2022.
Die Idee ist, das UN-Nachhaltigkeitsziel Nr. 11 Nachhaltige Städte und Gemeinden zu unterstützen, indem die Entwicklung von städtischen Grünflächen am Beispiel von Freising, einer Kleinstadt in der Nähe von München, analysiert wird.
Ziel ist es, Daten über städtische Grünflächen zu sammeln, zu analysieren und mit interaktiven Karten und Grafiken ansprechend zu visualisieren und damit die daraus resultierenden Informationen leicht verständlich aufzubereiten. Die Methoden und Ergebnisse dieses Projekts sollen auf andere Städte übertragbar sein. Dies wird durch einen hohen Automatisierungsgrad der Datenverarbeitung und die Nutzung global verfügbarer Datensätze gewährleistet.
Die Informationen sollen mit Hilfe der folgenden verfügbaren Datensätze von ASDI abgeleitet werden:
Zusätzliche Daten:
Die folgenden Methoden sind auf ihre Verwendung zu bewerten:
- maschinelles Lernen / Deep Learning basierte Klassifizierung
- klassische Fernerkundungsanalyse und statistische Methoden
- Veränderungsanalyse
- Entwicklung einer Verarbeitungskette und einer Web-App
Die Daten sollen von 2017 bis 2022 ausgewertet werden. Da die Stadt Freising auf der nördlichen Hemisphäre in der gemäßigten Klimazone liegt, sollte der Beginn des Monats Juni für die Erfassung der Vegetation gut geeignet sein.
Aggregierte statistische Ergebnisse werden auf GADM Level 3 (Gemeinden) für jedes Jahr abgeleitet.
Gegebenenfalls ist eine feinere Stadtgrenze aus den Daten zu erstellen. Diese feinere Grenze kann für Erkenntnisse wertvoller sein, da die GADM-Ebene 3 die Stadt selbst mit ländlichen Gebieten enthalten kann.
Außerdem sollen verschiedene Karten auf Pixelebene erstellt werden, die die Entwicklung der städtischen Grünflächen für jedes Jahr zeigen.
Darüber hinaus sollen verschiedene Karten auf Pixelebene erstellt werden, die die Entwicklung der städtischen Grünflächen für jedes Jahr darstellen.
- Projektlogo erstellen (erster Entwurf)
- Video erstellen (erster Entwurf)
- Verfügbare Ressourcen auf AWS prüfen
- Daten und Methoden auswerten
- Technische Roadmap formulieren
- Umsetzung
- Präsentation (Webseite)
- Projektlogo final erstellen
- Video final erstellen
Mit maschinellem Lernen soll auf der Basis von Median Kompositbildern von Sentinel-2 für das Jahr 2020 ein Modell trainiert werden, wobei die ESA Worldcover 2020-Karte als Grundlage für die Landnutzungsklassifizierung dienen sollte. Das trainierte Modell soll Vegetation, bebaute Flächen/offenen Boden oder andere Pixel für die Jahre 2017, 2018, 2019, 2021 und (wenn möglich) 2022 vorhersagen. Die Eingangsdaten für das Training des ML Modells waren Fernerkundungsindizes wie NDVI, NDWI, NDBI und einige GLCM-Texturmetriken wie Homogenität und Entropie. Es wurden mehrere Klassifizierungsalgorithmen des Scikit-Learn-Pakets getestet - RandomForestClassifier und MLPClassifier schnitten am besten ab, wobei MLPClassifier bei der Erkennung von Texturen wie größeren Gebäuden sogar etwas besser war als RandomForestClassifier.
Das aktuelle Modell, das auf der ESA Worldcover 2020 für die Stadt Freising für 3 Klassen (1: Vegetation, 3: bebaute Fläche, 0: andere) trainiert wurde, hatte eine Gesamtgenauigkeit von 96,6% scripts/esa_landcover_model_MLPClassifier_2022-08-29 13:04:16.912490_score_96_3classes.txt.


