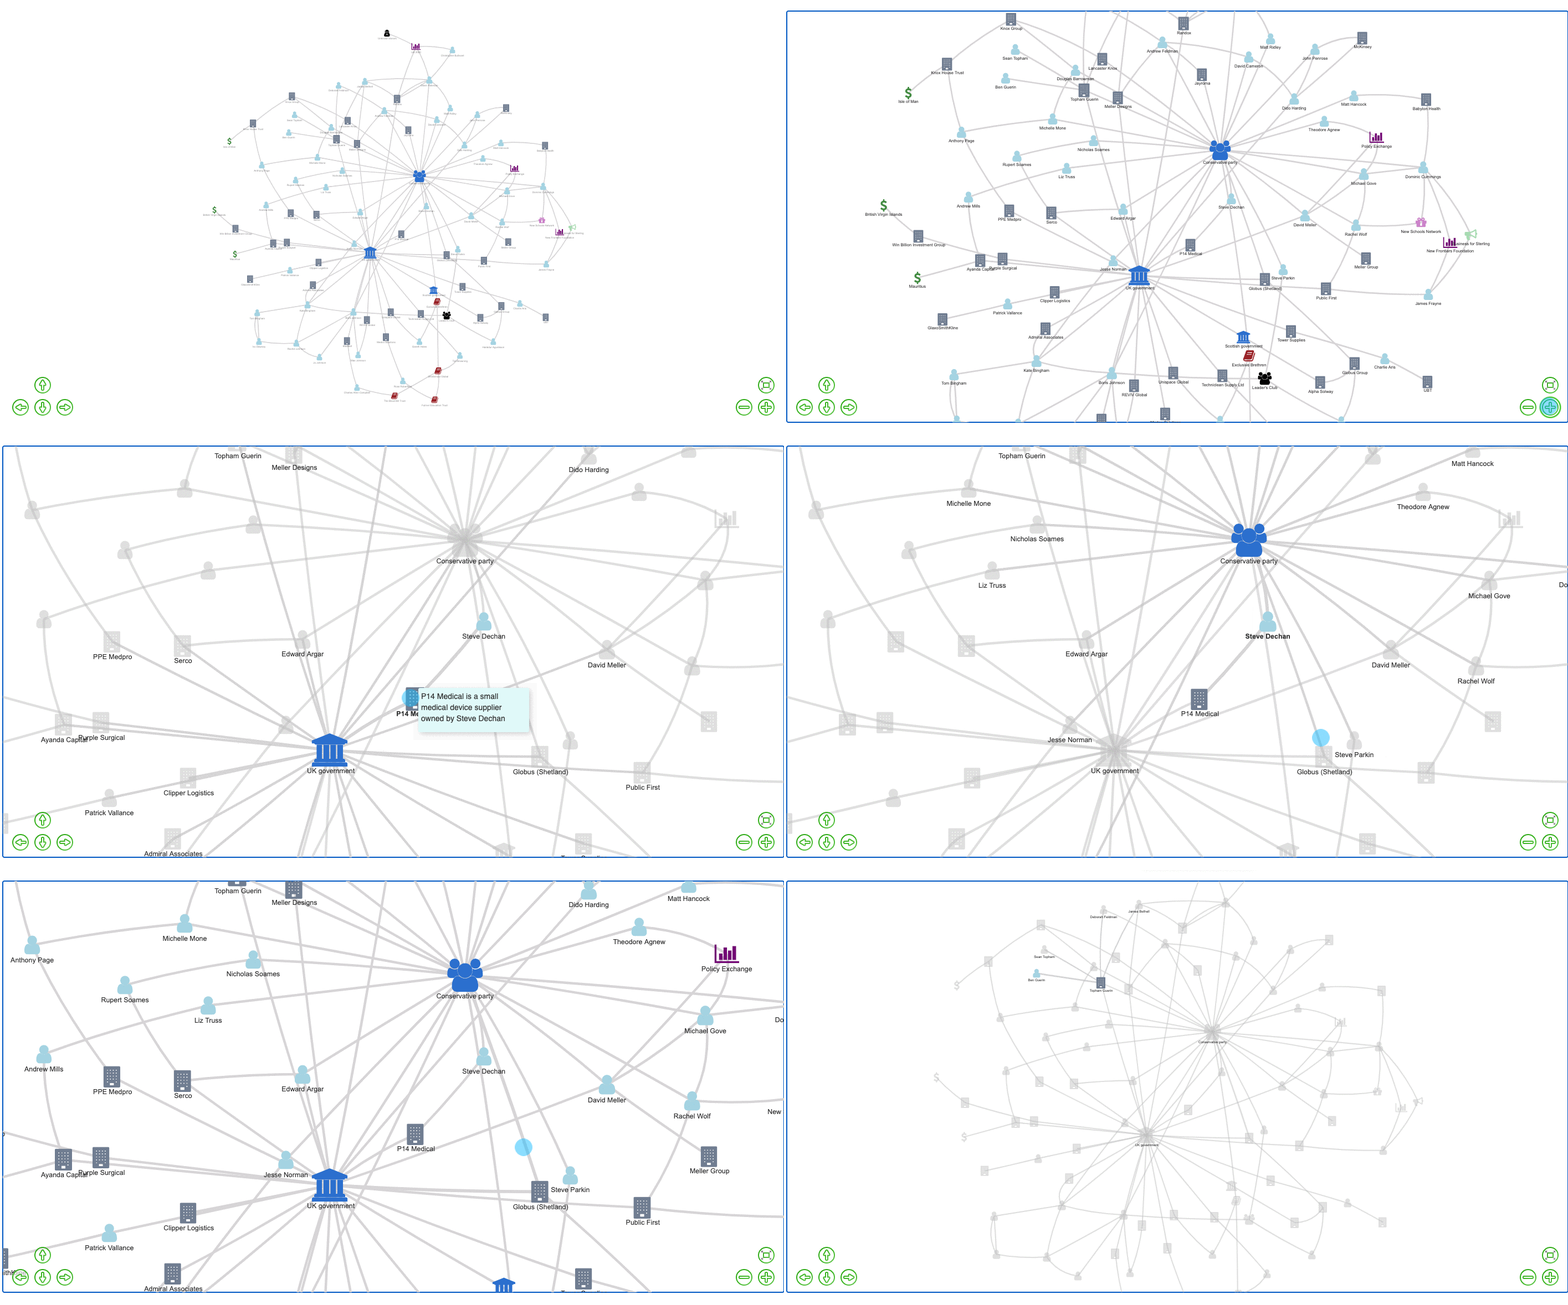
This repo contains the data and code for My Little Crony, a visualization of the links between Tory politicians and the companies being awarded government contracts during the pandemic.
Please feel free to contact me (sophie DOT eva DOT hill AT gmail DOT com) or submit a PR with any corrections, comments, or suggestions!
The raw data is contained in two files: people.csv identifies individuals and organizations (i.e. the "nodes" of the network) and connections.csv identifies the links between individuals and organizations (i.e. the "edges" of the network).
The script code.R adds some attributes to the data to aid visualization, like specifying the icon type, colour, size. The data files are then resaved as people.RData and connections.RData.
The script save_to_html.R takes the cleaned datasets (people.RData and connections.RData) and produces the visualization as a standalone HTML file called crony.html. This HTML file can be opened and viewed in any web browser.
If you are new to R, here is a quick guide to getting started with this repo:
- Install R
- Install RStudio
- Download a local copy of this repo (click on "Code" and then "Download ZIP")
- Open the project (
my-little-crony.Rproj) in RStudio - Install the required packages ("install.packages(packagename)")
- Run the code!
This visualization relies on excellent investigative journalism by Byline Times, Open Democracy, The Citizens, and many others! The visualization itself relies on the awesome visNetwork R package.
