Tools used for LDR/HDR environment map (IBL) handling, conversion and I/O.
Install using:
pip install --upgrade skylibs
To develop skylibs, clone the repository and execute python setup.py develop
To read and save exr files, install the following dependencies (works on win/mac/linux):
conda install -c conda-forge openexr-python openexr
To use the spherical harmonics functionalities, install the following dependency (works on mac/linux):
conda install -c conda-forge pyshtools
Example usage:
from envmap import EnvironmentMap

e = EnvironmentMap('envmap.exr', 'latlong')
e_angular = e.copy().convertTo('angular')
e_angular_sa = e_angular.solidAngles()
envmap.EnvironmentMap Environment map class. Converts easily between those formats:
- latlong (equirectangular)
- angular
- sphere
- cube
- skyangular
- skylatlong
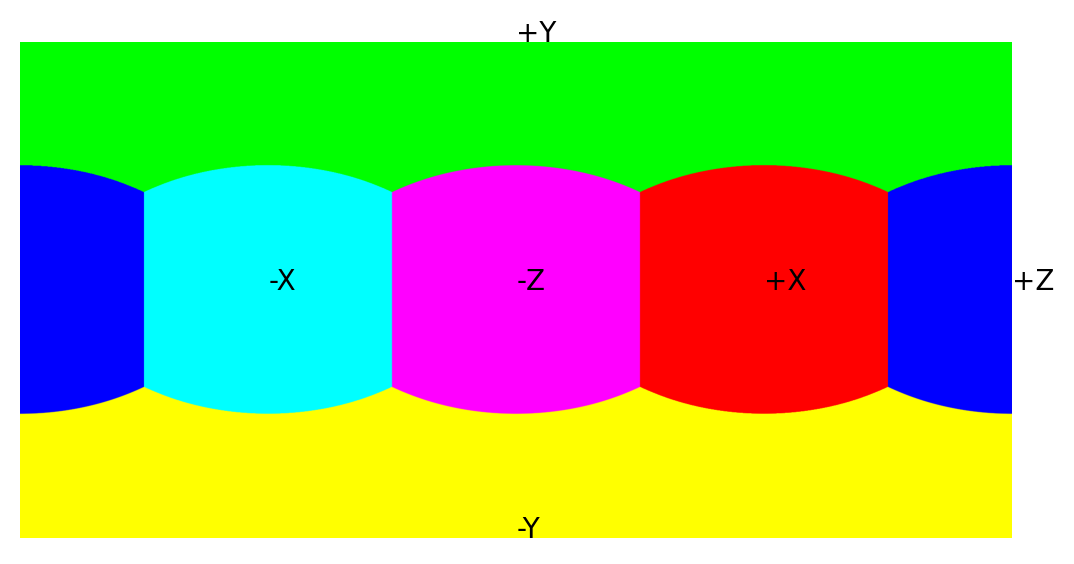
Skylibs employs the following right-handed coordinates system: +X = right, +Y = up, +z = towards the camera. Here is its latitude-longitude map (see code below):
.copy(): deepcopy the instance..solidAngles(): provides the solid angle for each pixel of the current representation..convertTo(targetFormat): convert to thetargetFormat..rotate(rotation): rotate the environment map using a Direction Cosine Matrix (DCM)..resize(targetHeight): resize the environment map. Down-scaling will use energy-preserving interpolation (best results with integer downscales), which may introduce aliasing..toIntensity(mode, colorspace): convert to grayscale..getHemisphere(normal): returns a mask of the hemisphere visible from a surface withnormal..setHemisphereValue(normal, value): sets all pixels visible from a surface withnormaltovalue..getMeanLightVectors(normals): compute the mean light vector of the environment map for the given normals..project(vfov, rotation_matrix, ar, resolution, projection, mode): Extract a rectified image from the panorama, simulating a camera with field-of-viewvfov, extrinsicsrotation_matrix, aspect ratioar,resolution..embed(self, vfov, rotation_matrix, image): inverse ofproject, embeds an image in the environment map..imageCoordinates(): returns the (u, v) coordinates at each pixel center..worldCoordinates(): returns the (x, y, z, valid) world coordinates for each pixel center, with maskvalid(anything outside this mask does not project to the world)..world2image(x, y, z): returns the (u, v) coordinates of the vector (x, y, z). Pixel coordinates can be obtained withfloor(u)andfloor(v)..image2world(u, v): returns the (x, y, z) coordinates of the coordinates (u, v)..interpolate(u, v, valid): interpolates the envmap to coordinates (u, v) masked with valid.
To perform a crop from pano.jpg:
import numpy as np
from imageio import imread, imsave
from envmap import EnvironmentMap, rotation_matrix


e = EnvironmentMap('pano.jpg', 'latlong')

dcm = rotation_matrix(azimuth=np.pi/6,
                      elevation=np.pi/8,
                      roll=np.pi/12)
crop = e.project(vfov=85., # degrees
                 rotation_matrix=dcm,
                 ar=4./3.,
                 resolution=(640, 480),
                 projection="perspective",
                 mode="normal")

crop = np.clip(255.*crop, 0, 255).astype('uint8')
imsave("crop.jpg", crop, quality=90)
imread and imwrite/imsave supporting the folloring formats:
- exr (ezexr)
- cr2, nef, raw (dcraw)
- hdr, pic (custom, beta)
- tiff (tifffile)
- All the formats supported by
imageio
Internal exr reader and writer, relies on python-openexr.
-
getMaskDerivatives(mask): creates the dx+dy from a binarymask. -
NfromZ: derivates the normals from a depth mapsurf. -
ZfromN: Integrates a depth map from a normal mapnormals. -
display.plotDepth: Creates a 3-subplot figure that shows the depth mapZand two side views. -
spharm.SphericalHarmonicSpherical Harmonic Transform (usespyshtools).Example usage of
spharm:from envmap import EnvironmentMap from tools3d import spharm e = EnvironmentMap('envmap.exr', 'latlong') sh = spharm.SphericalHarmonic(e) print(sh.coeffs) reconstruction = sh.reconstruct(height=64) -
warping_operator.warpEnvironmentMap: The warping operator of Gardner et al., 2017. See documentation here.
Tonemapping using pfstools.
- 0.7.4: Fixed tools3d.spharm compatibility with latest pyshtools.
- 0.7.3: Added vMF-based envmap blur functionality.
ezexrdoes not print the number of channels on stdout. - 0.7.2:
ezexr.imwrite()now orders correctly channels when > 10 are used. - 0.7.1: Added
sunFromPySolar(Thank Ian!) and support for alpha values and imageio v3 in ezexr(thanks Hong-Xing!). - 0.7.0: Fixed
.setHemisphereValue(), added mode to.toIntensity(), fixed angular and sphere projections for normals [0, 0, ±1], added.getHemisphere(normal). - 0.6.8: Fixed resizing to be energy-preserving when downscaling; fixed conversion that shifted the envmap by half a pixel
- 0.6.7: Fixed image envmap embedding to fit the projection coordinates; fixed crash in imwrite with specific channel names
- 0.6.6: Fixed aspect ratio when embedding
- 0.6.5: Added envmap embed feature
- 0.6.4: Removed
pyshtoolsas mandatory dependency - 0.6.3: Removed custom OpenEXR bindings (can be easily installed using conda)
- 0.6.2: Removed
rotlibdependency - 0.6.1: Aspect ratio in
project()now in pixels - 0.6: Updated the transport matrix Blender plugin to 2.8+
- Improved display for environment maps (change intensity with keystroke/button)
- Standalone
ezexron all platforms (investigatepyexr) - add
worldCoordinates()output in spherical coordinates instead of (x, y, z) - Add assert that data is float32 in convertTo/resize (internal bugs in scipy interpolation)
import numpy as np
from matplotlib import pyplot as plt
from envmap import EnvironmentMap

sz = 1024
e = EnvironmentMap(sz, 'cube', channels=3)
e.data[:sz//4,:,:] = [0, 1, 0]                   # +Y
e.data[sz//4:int(0.5*sz),:,:] = [1, 0, 1]        # -Y
e.data[:,int(0.5*sz):,:] = [1, 0, 0]             # +X
e.data[:,:int(0.25*sz),:] = [0, 1, 1]            # -X
e.data[int(3/4*sz):,:,:] = [0, 0, 1]             # +Z
e.data[int(0.5*sz):int(3/4*sz):,:,:] = [1, 1, 0] # -Z
e.convertTo('latlong')

def getCoords(normal):
    u, v = e.world2image(*normal)
    return [u*e.data.shape[1], v*e.data.shape[0]]

plt.imshow(e.data)
plt.text(*(getCoords([1, 0, 0]) + ["+X"]))
plt.text(*(getCoords([-1, 0, 0]) + ["-X"]))
plt.text(*(getCoords([0, 1, 0]) + ["+Y"]))
plt.text(*(getCoords([0, -1, 0]) + ["-Y"]))
plt.text(*(getCoords([0, 0, 1]) + ["+Z"]))
plt.text(*(getCoords([0, 0, -1]) + ["-Z"]))
plt.axis('off')
plt.savefig('coordinates.png', bbox_inches="tight", dpi=200)
plt.show()
