Aliyun log service Datasource
More documentation about datasource plugins can be found in the Docs.
Install
clone this project into grafana plugin directory , then restart grafana
in mac the plugin directory is /usr/local/var/lib/grafana/plugins
after install the plugin ,restart grafana
brew services start grafana
Add datasource
in datasource management panel, add a datasource with the type "LogService"
in Http settings, set Url = http://${log_service_endpoint} . e.g. Your projectName is accesslog in qingdao region, then the url is http://cn-qingdao.log.aliyuncs.com
Access : select "proxy"
log service details:
set Project and logstore
AccessId and AccessKey : it is better to use a sub user accessId and accessKey
Add dashboard
Add a panel, in the datasource option, choose the log service datasource that is just created.
in the query : insert your query , e.g.
*|select count(1) as c,count(1)/2 as c1, __time__- __time__%60 as t group by t limit 10000
the X column ,insert t the Y column , insert c,c1
save the dashboard
Usage
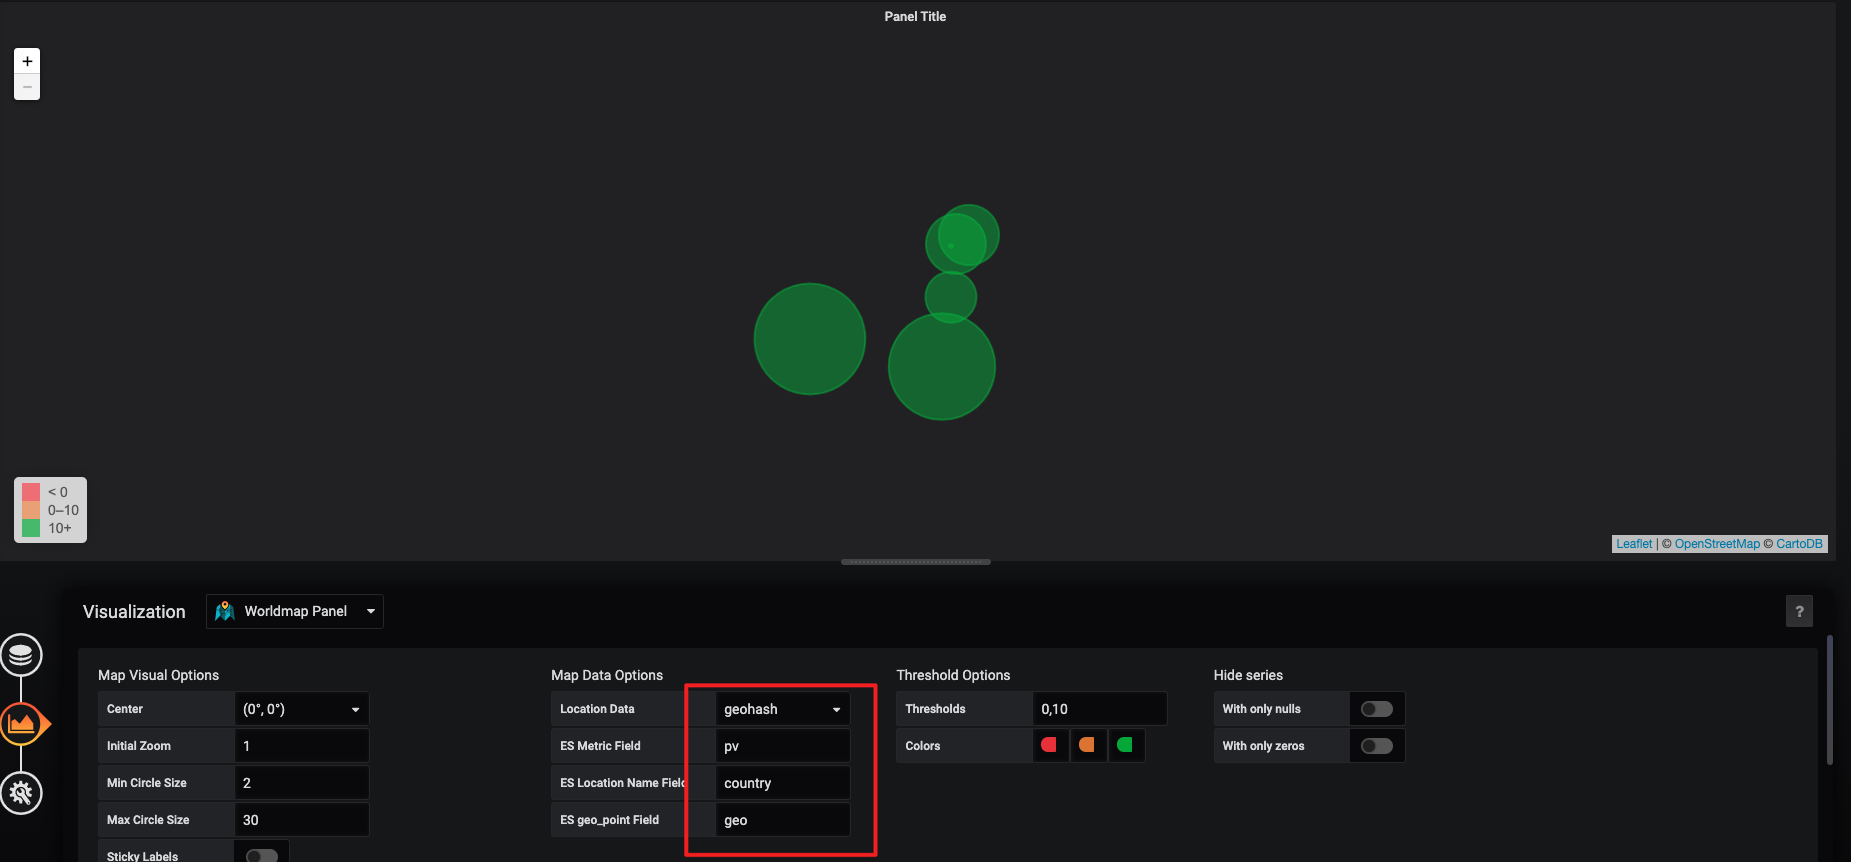
world map penel
configuration of log service :
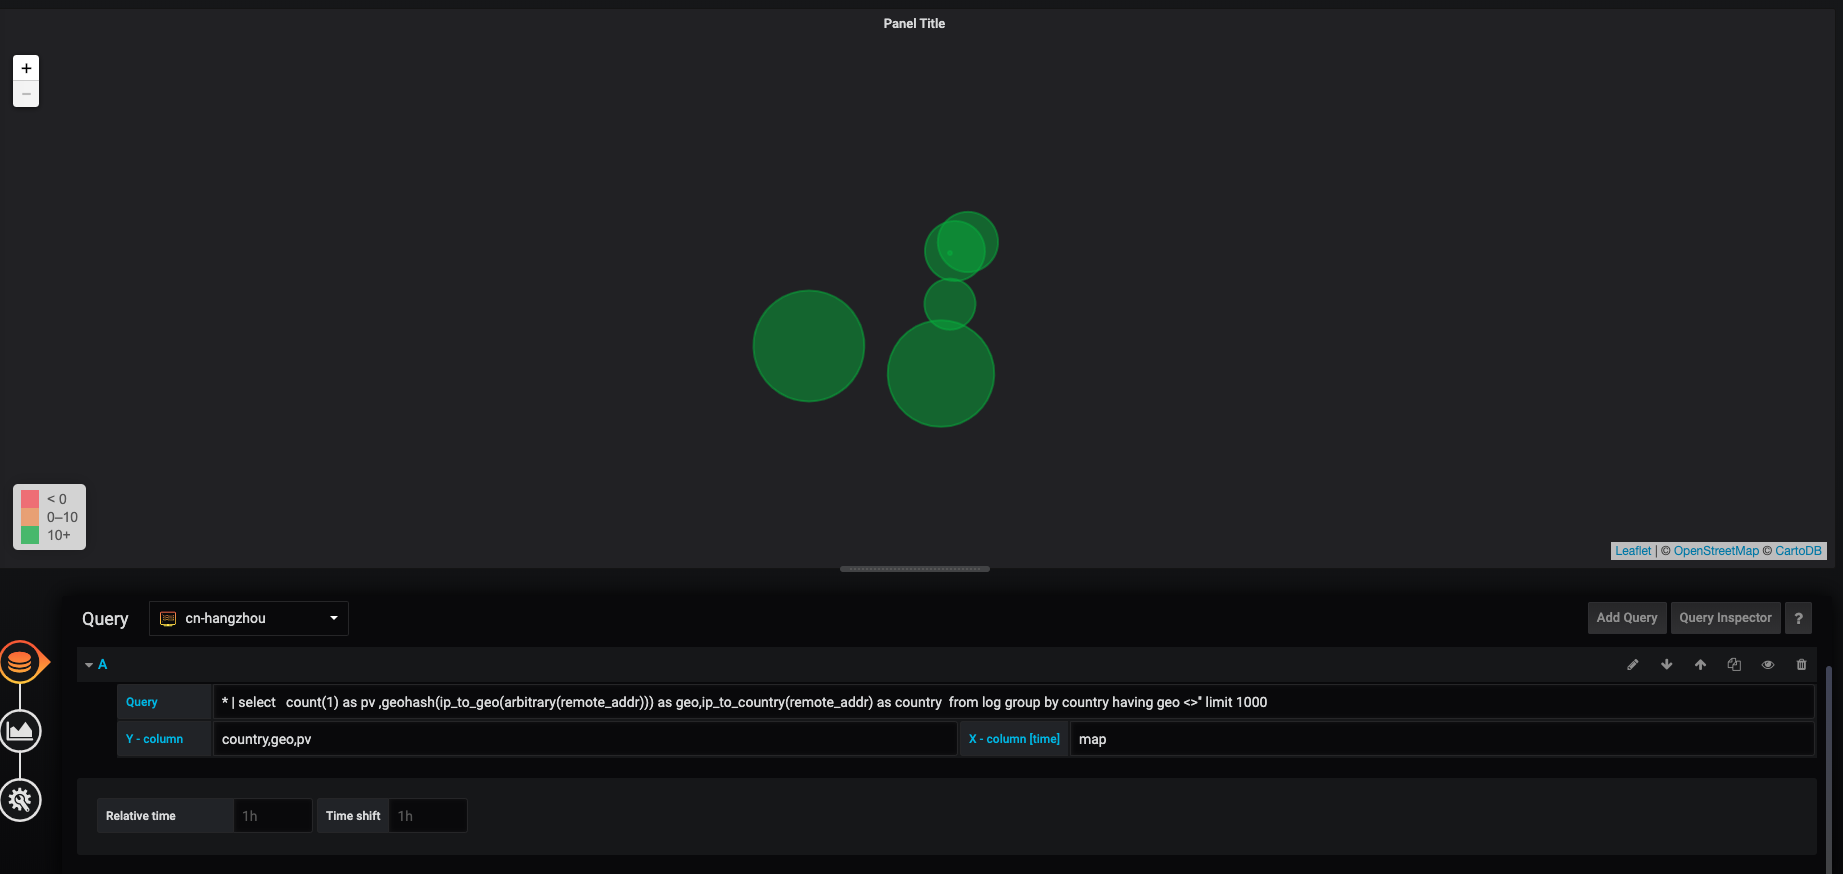
configuration of worldmap penel(please specify Map Data Options):
Contributors
@WPH95 made a great contribution to this project.
Thanks for the excellent work by @WPH95.