How to use the code:
-
Compile:
make install
-
Test the code:
make test
If no significant differences exist you are good to go.
-
Clean the directory:
make clean
README This file ARES_v2.c source code of main ARES areslib.h source code of main ARES functions aresplot.h source code for ARES plots filesio.h source code for ARES input/output file ngaussfdf.h source code for Gaussian fitting - non linear least square fitting rvcor.h source code for the spectral radial velocity correction sn_rejt_estimator.h source code for the automatic sn and rejt determination mine.opt default ARES input parameter file sun_harps_ganymede.fits test spectra - spectrum from the Sun via Ganymede linelist.dat linelist example for ARES test.ares_ori expected result for ARES for default parameters and test file mine.opt_ori a copy of the default ARES input parameter file mine.opt_autorejt_autorv ARES input parameters example for automatic rejt and automatic RV correction mine.opt_rejt_dep_lambda ARES input parameters example for rejt dependent on wavelenght lambda_rejt.opt file needed for the option on rejt dependent on wavelenght
The spectrum sun_harps_ganymede.fits is corrected from the radial velocity and is avaiable here
cfitsio - CFITSIO gcc - GNU Compiler Collection gsl - GNU Scientific Library OpenMP - Open Multi-Processing library plotutils - The plotutils Package gnuplot - gnuplot library
In this new version of ARES you can select which ploting library you want to use. The default is gnuplot. You can change back to plotutils editing the file aresplot.h in line 13. Instructions are commented in the code.
The new code was tested on different linux machines, with different linux flavours, including debian based, such as UBUNTU and Linux Mint, and other flavours such as FEDORA, CENT OS. The code was also tested on MAC OSX.
Everything should compile smoothly if you use the repository of your OS to install the required libraries. If you have installed the libraries manually, keep a note on the location of the libraries in your computer.
With the libraries installed from the repositories:
make install
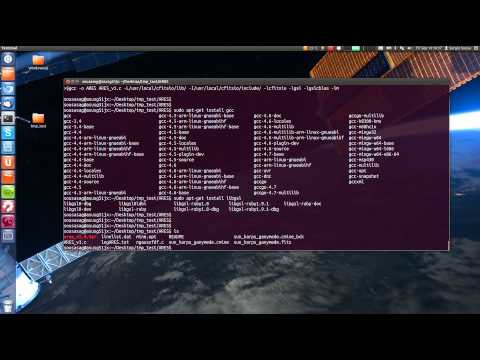
If you have installed one library manually, an example for the case of CFITSIO, is the folloing:
gcc -o ARES ARES_v2.c -L/usr/local/cfitsio/lib/ -I/usr/local/cfitsio/include/ -lcfitsio -lgsl -lgslcblas -lm -lgomp -fopenmp
Another example with multiple libraries in different places in a MacOS system:
gcc-12 -o ARES ARES_v2.c -L/usr/local/Cellar/gsl/2.7.1/lib/ -I/usr/local/Cellar/gsl/2.7.1/include/ -L/usr/local/Cellar/cfitsio/4.2.0/lib/ -I/usr/local/Cellar/cfitsio/4.2.0/include/ -lcfitsio -lgsl -lgslcblas -lm -lgomp -fopenmp
Note: -L and -I is the location of the libraries and the include files of the cfitsio package.
In case of having problems finding the libraries, you can add the path of the
missing files (e.g. error while loading shared libraries:
libgsl.so.0: cannot open shared object file: No such file or directory) to
$LD_LIBRARY_PATH.
After the compilation is completed you can create a link into your favorite
link directories (e.g. ~/bin) symbolic link directory.
>$ln -s compiledfile ~/bin/ARES (it is better to use the full paths of both files)
If you have the ~/bin/ in the $PATH system variable then you can run the
program easily by typing:
>$ARES
Make sure that you have the mine.opt file in the running directory.
You can check the previous installation help for MAC. I will update this section if problems are identified.
specfits : 1D fits spectrum for the analysis
readlinedat : line list for the analysis
fileout : output file for the results
lambdai : initial wavelength for the search of the lines
lambdaf : final wavelength for the search of the lines
smoothder : parameter for the calibration of the search of the lines. Noise smoother for the derivatives.
space : interval in Angstrom for the computation for each line
rejt : parameter for the calibration of the continuum position.
lineresol : this parameter sets the line resolution of the input spectra. If the code finds two lines closer than the value set for this parameters, then we take the two lines as one line alone.
miniline : weaker line strength to be printed in the output file
plots_flag : flag for the plots. 0-runs in batch, 1-shows the plots and stops for each line calculation.
rvmask : parameter for the automatic RV correction
Detailed description:
To run the code it is necessary to have a file in the system running directory named mine.opt that contains the input parameters with a specified format. The format of this file can be seen below. The input parameters required to run are the following:
-specfits : is the location of the spectra in the FITS format.
The header of this file must contain the CRVAL1
and CDELT1 keywords. The spectra should be reduced
and calibrated in wavelength. It is supposed that
the spectra should have a preliminary normalization
to avoid abnormal features in the 1D spectra such
the ones that can appear when using reduced echelle
spectra.
-readlinedat: is the location of the file that contains the lines
to be measured. The format of this file is described
in the help file that is supplied with the code. Each
line of this file should indicate the wavelength
position of each line to measure. We note that the
code can crash if is trying to find lines in a spectral
region not existent in the spectrum (e.g. a spectral gap).
-fileout : the output file. The results for the identified lines
are prompted in this file with the following order:
the central line wavelength, the number of lines used
to fit the local spectrum, the depth of the line to
measure, the FWHM of the line, the EW of the line, and
the three coefficients of the gaussian used to fit the
line (depth, sigma, central position) respectively.
-lambdai : initial wavelength of the interval to search the lines.
-lambdaf : final wavelength of the interval to search the lines.
-smoothder : value of the smooth boxcar to use in the
numerical derivatives. Value 1 implies no smoothing.
-space : wavelength interval around the line where the
computation will be conducted.
-rejt : parameter required to calibrate the local continuum
determination.
-lineresol : minimum distance in Angstroms between lines in the spectra.
-miniline : minimum EW value that will be prompted into the output file.
-plots_flag : If this flag is set to 1, plots of the continuum determination
and the fit of the line will be displayed, otherwise the
code will run automatically without interruptions. The stop
of the plots is available at any time passing to the auto run
of the code, so that the user can check the measurements of
the lines in the beginning of the line list.
New MUST KNOW features:
Here you can still provide a FITS 1D spectra, or alternatively you can provide an ASCII file. For this to work the data should be available in two distinct columns (wavelength and flux separated by spaces). Note that the wavelength still needs to be in units of Angstroms and this file should not contain any header.
you can still provide a value for the rejt with values ranging from [0-1[. If you provide a value greater than one it will assume that you are providing the S/N of the spectra and will compute the rejt parameters using the relation presented in the 2015 paper.
Alternatively you can tell ARES to compute the S/N and rejt. To better explain, nothing better than a practical example. For example setting:
rejt=3;5764,5766,6047,6052,6068,6076
This will tell ARES to evaluate the noise in three different spectral ranges, the first number (3) defines the number of ranges, and each next pair of numbers represent each wavelength region. To select these spectral regions the user should perform a careful eye inspection of the typical spectra in study, and look for spectral regions without the presence of strong lines, the ideal case will be without any lines at all. These three spectral regions given in this example are regions that have no lines, or at most very week lines, for solar-type stars, and therefore the user can take these as our recommendation.
An extra option is to have the rejt dependent on the wavelength for this we
should use the following option:
rejt=-2
Note that for this to work the file lambda_rejt.opt should in the same
directory. An example for this file is presented bellow.
Alternatively you can also provide the name of another file with similar information by using the following example:
rejt=-2;'other_lambda_rejt.opt'
To skip the local normalization you can try the following:
rejt=-3
This will not make the local normalization. And apply a "fake" rejt of 0.999. However this is still in testing phase. Be caution with this option since you don't control the continuum position.
this is the only new parameters. If you don't provide this parameter in the input parameter file the code will not complain and will work as before assuming that the spectra is already corrected in RV.
You can tell ARES the velocity to be corrected. For example 25.5 Km/s:
rvmask='0,25.5'.
The '0' in this option is for ARES to understand that the user is providing radial velocity to be corrected. The ARES code will read the value and will adjust the wavelength of the spectra accordingly with the Doppler shift formula:
Alternatively you can provide a mask to be used by ARES to estimate the RV. For example:
rvmask='3,6021.8,6024.06,6027.06,6024.06,20'
The first number (3) is the total of lines for the mask, the last number (20) is a kind of a ``space'' parameter to select the width for the wavelength region to compute the CCF which is then centered on the wavelength provided in the second to last position.
Example of a standard mini.opt file:
-----------------------------
specfits='sun_harps_ganymede.fits'
readlinedat='linelist.dat'
fileout='test.ares'
lambdai=3600.
lambdaf=9000.
smoothder=4
space=3.0
rejt=0.995
lineresol=0.1
miniline=2
plots_flag=0
-----------------------------
Example of a mini.opt file for RV autocorrection and rejt auto determination
-----------------------------
specfits='sun_harps_ganymede.fits'
readlinedat='linelist.dat'
fileout='test.ares'
lambdai=3600.
lambdaf=9000.
smoothder=4
space=3.0
rejt=3;5764,5766,6047,6053,6068,6076
lineresol=0.1
miniline=2
plots_flag=1
rvmask='3,6021.8,6024.06,6027.06,6024.06,20'
-----------------------------
Example of a mini.opt file for rejt dependent on wavelength
-----------------------------
specfits='sun_harps_ganymede.fits'
readlinedat='linelist.dat'
fileout='test.ares'
lambdai=3600.
lambdaf=9000.
smoothder=4
space=3.0
rejt=-2
lineresol=0.1
miniline=2
plots_flag=0
rvmask='3,6021.8,6024.06,6027.06,6024.06,20'
-----------------------------
Example of a file lambda_rejt.opt for the rejt dependent on wavelength
-----------------------------
4000.00 0.992
4500.00 0.992
5000.00 0.993
5500.00 0.993
6000.00 0.994
6500.00 0.995
7000.00 0.994
-----------------------------
Examples of an line list file: linelist.dat
Requirements for this file:
- The first and the second lines are ignored by the code, you can use these lines to put an header.
- For the rest of the lines the code only reads the 1st column, that should be the one of the position of the lines in Angstroms
example 1:
WL          Excit           loggf   Elm_Ion lt
-------     ---------       ------- ------- ---
4000.01     2.83     -3.687  FeI      26.0
4007.27     2.76     -1.666  FeI      26.0
4010.18     3.64     -2.031  FeI      26.0
4014.27     3.02     -2.330  FeI      26.0
4080.88     3.65     -1.543  FeI      26.0
4114.94     3.37     -1.720  FeI      26.0
example 2:
4000.01  	line1
4007.27  	line2
4010.18  	line3
4014.27  	line4
4080.88  	line5
4114.94  	line6
In comparison with the last version there will be an extra colunm with the estimated error on the equivalent width (column 6)
4000.01  9     0.07521     0.09146     7.32166     1.82360    -0.07521   331.47570     4000.03
4007.27  2     0.77465     0.10233    84.37734     0.77426    -0.77465   264.79268     4007.27
4010.18  9     0.35146     0.08053    30.12733     1.03317    -0.35146   427.55094     4010.17
4014.27  4     0.50826     0.08525    46.11996     1.97861    -0.50826   381.53631     4014.27
4080.88  3     0.59394     0.09307    58.83871     1.14868    -0.59394   320.11297     4080.88
4114.94  10     0.62096     0.08973    59.31302     0.66440    -0.62096   344.32693     4114.94
5501.48  4     0.67716     0.14047   101.24941     0.57105    -0.67716   140.52290     5501.47
Output report:
1st column: wavelength of the line
2nd column: number of lines fitted for the line result
3rd column: the depth of the line
4th column: FWHM of the line
5th column: EW of the line
6th column: error on EW of the line
7th-9th column: gaussians coefficients for the line fit: (depth, sigma, center)
In aresplot.h you can define a constant to select ploting choice:
#define PLOT_TYPE 2
1- for plot_utils
2- for gnuplot
3- for gnuplot saving png plots in plotdir
In ARES_v2.c you have a constant flag which can be used to skip the local normalization
#define CONT_FLAG 0
0- Local normalization (standard)
1- Skip Normalization
If you find a problem with compilation with the error mentioning: In file included from ARES_v2.c:47: areslib.h: In function : areslib.h:589: error: <gsl_multifit_fdfsolver> has no member named The solution is to replace the file areslib.h by the one named areslib_gsl2.h: https://github.com/sousasag/ARES/blob/master/areslib_gsl2.h
or if you have GSL 1.3 you can replace areslib.h by areslib_gsl1.h https://github.com/sousasag/ARES/blob/master/areslib_gsl1.h
In Fedora Core flavours it was reported a problem when finding the fitsio.h file in the system. A possible solution is to edit the areslib.h file and replace the line with #include "fitsio.h" by #include "cfitsio/fitsio.h"
-
apt-get install xfs xfstt (Problem in grace resolved)
-
apt-get install t1-xfree86-nonfree ttf-xfree86-nonfree ttf-xfree86-nonfree-syriac xfonts-75dpi xfonts-100dpi
(May be we just need to install xfonts-75dpi and xfonts-100dpi only)
- Then set the path:
xset +fp /usr/share/fonts/X11/75dpi/ xset +fp /usr/share/fonts/X11/100dpi/