Utilities for plotting, saving, analyzing the Poker Flat Research Range Digital All Sky Camera. (Other locations, too). This program handles the corrupted FITS files due to the RAID array failure on 2013 data. The raw data FITS contain one image per file.
 (using scripts/PlotProjectedImage.py
)
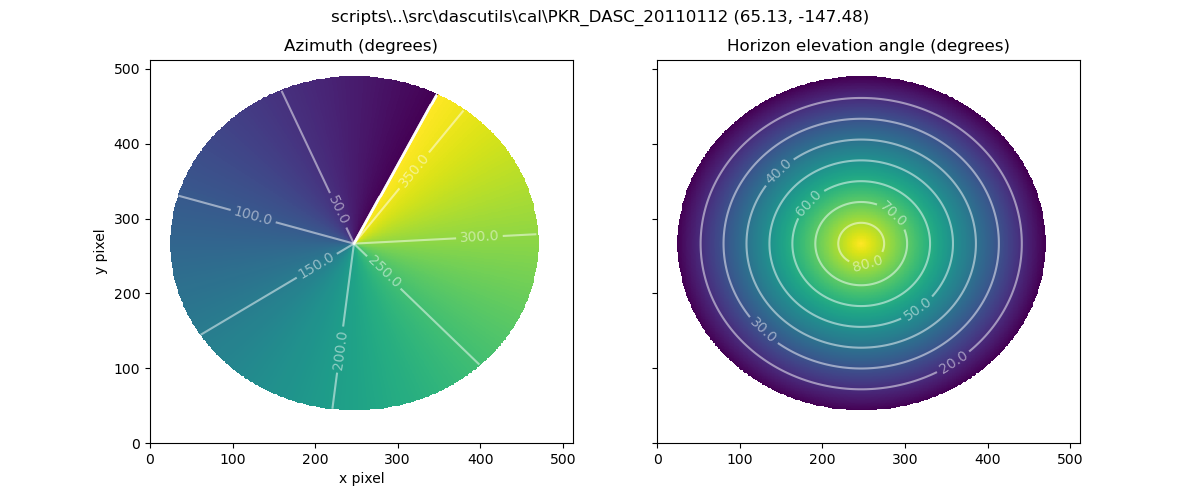
 (using scripts/PlotAzimuthElevation.py)
Most people will find it useful to have the example scripts and the tests built into the Git repo.
git clone https://github.com/space-physics/dascasi

pip install -e dascasiTo use the API directly, like:
import dascasi as du

data = du.load('tests/PKR_DASC_0558_20151007_082351.743.FITS')
This returns a dictionary of
xarray.DataArray,
which is like a "smart" Numpy array.
The images are indexed by wavelength if it was specified in the data file, or '0000' otherwise.
The images are in a 3-D stack: (time, x, y).
data.time is the time of each image.
also several metadata parameters are included like the location of the camera.
Save the data using lossless compression to HDF5 by
du.save_hdf5(data, "foo.h5")Now we give several examples.
Download Poker Flat Research Range "PKR" October 7, 2015 from 8:23 to 8:54 UTC to ~/data/:
python -m dascasi.download PKR 2015-10-07T08:23 2015-10-07T08:54 ~/data-wfour-letter wavelength in nanometers e.g. 0630
As usual, we assume UTC and do NOT specify the timezone.
It is very tedious to download large amounts of DASC data in single FITS files. We have tried to make this faster by multi-threading the download, but then the FTP server anti-leeching leaves us with broken downloads. As an alternative in general, it's more convenient to have a single HDF5 file for a day rather than 10,000 FITS files. Convert a bunch of FITS files to HDF5 like:
python scripts/ConvertDASC_FITS_to_HDF5.py ~/data/2015-10-07 ~/data/2015-10-07.h5-tstart stop times to convert
Play movie of all wavelengths in subplots for files in a directory, for example:
python -m dascasi.movie dascasi/tests/additional options include:
-tspecify time limits e.g.-t 2014-01-02T02:30 2014-01-02T02:35-wchoose only certain wavelength(s)
To match data from DASC with other instruments, it is vital that the plate scale data user be appropriate for the time and instrument. Calibration data may be downloaded, for other times / instruments please contact UAF-GI.
import dascasi as du

data = du.load('dascasi/tests/', azelfn='/path/to/your_calibration_file')
now data includes data variables az and el, same shape as the image(s), along with camera position in lat lon alt_m.
- Be sure you know if you're using magnetic north or geographic north
- Note the calibration date in the filename--was the camera was moved since that date?
In all cases, the end user must manually verify the calibration with sky features such as stars / moon.
A common task in auroral and airglow analysis is to project the image to an imaginary alttiude, that is, as if all the brightness were coming from that altitude. Each wavelength has a distinctive peak emission altitude due to the energies, kinetic reactions and vertical density profiles involved.
It takes considerable time to stretch the image stack pixels to fit a project geographic grid, so this is not enabled by default. It will be enabled if the du.load(..., wavelength_altitude_km=) parameter is used. See PlotProjectedImage.py for an example.
Some analyses can be done far more rapidly by just projecting pixel(s) of interest rather than an entire 3-D image stack.