This is a toy FFT implementation. Numpy has a fantastic production quality implementation
Note: Source code is here, sorry about all the boiler plate, I used some project generator and shouldn't have!
Fourier transforms are really cool and I want to learn the maths and concepts behind it all. This continues from fourier-exp-01, a small C program that performs a temporal to frequency domain transform. This is a port of the C program, Python seems to have a better selection of libraries for parsing wave files, drawing graphs and doing maths.
This project includes a Python implementation of the Discrete Fourier Transform (DFT) in the C project above, it also contains an implementation of the Cooley-Tukey Fast Fourier Transform (FFT). The key differences between this project and the earlier C project is that this one uses Python's built in support for complex numbers, it also uses the correct divisor in the argument for the complex exponent operation (which expands cis(x)).
git clone github.com/spacekitcat/<repository-name>
cd <repository-name>
python setup.py develop
python src/cooley-tukey-fast-fourier-transform-implentation/fft.py resources/440hz.wav
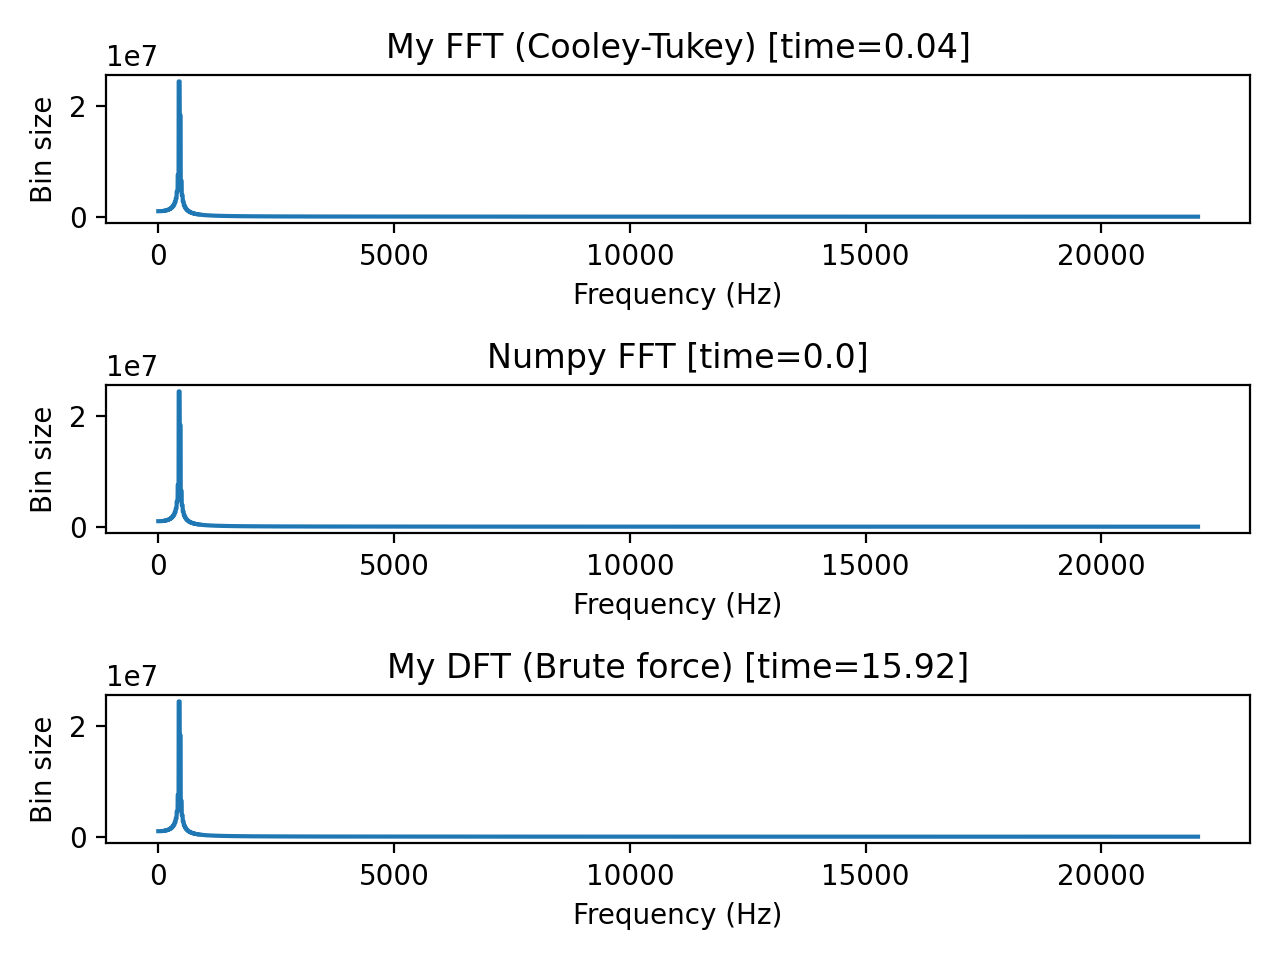
The graph below shows the frequency graph for an input wave file made up of a single 440hz sine wave.
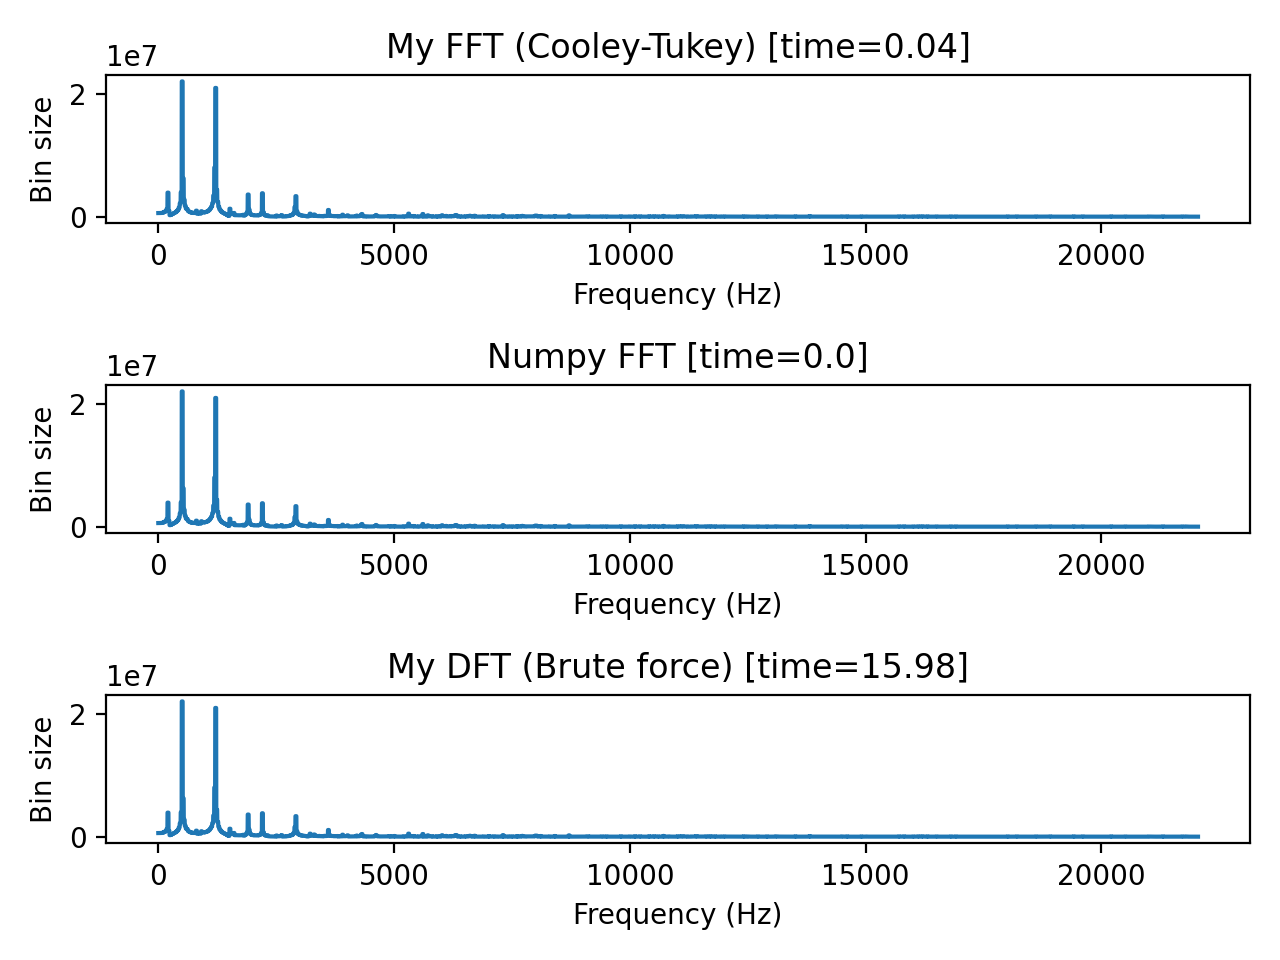
The graph below shows the frequency graph for an input wave file made up of a 500hz and a 1200hz sine wave.
Fourier Series (Dover Books on Mathematics) - Georgi P. Tolstov

