 Webpage of the Decision Making Tool
A simple interactive visualisation webtool for multi-dimensional data produced with the PDOPT Code.
Just install the latest version of dash plotly using pip:
pip install dash
Run the code from the terminal with the command:
$ python dm_tool.py
It will output a local IP address which can be opened with a browser.
Dash is running on http://127.0.0.1:8050/

 * Serving Flask app 'dm_tool'
 * Debug mode: off
WARNING: This is a development server. Do not use it in a production deployment. Use a production WSGI server instead.
 * Running on http://127.0.0.1:8050
Press CTRL+C to quit
Data, in the format of a .csv file, can be loaded by pressing the "Load .csv file" link.
Two types of plots are available: Parallel Coordinates and Scatter. Parallel Coordinates have a drop-down menu for selecting the axis where the colormap will be applied to. It is possible to select "None" for providing just plain colors.
 Example of selections in a Parallel Coordinate plot
Datapoints can be selected by selecting a range of data on each axis. The selections will propagate to the other plots, by greying out the non-selected points. On the scatter plots it is possible to select using the drop-down menus the X, Y and colour axes.
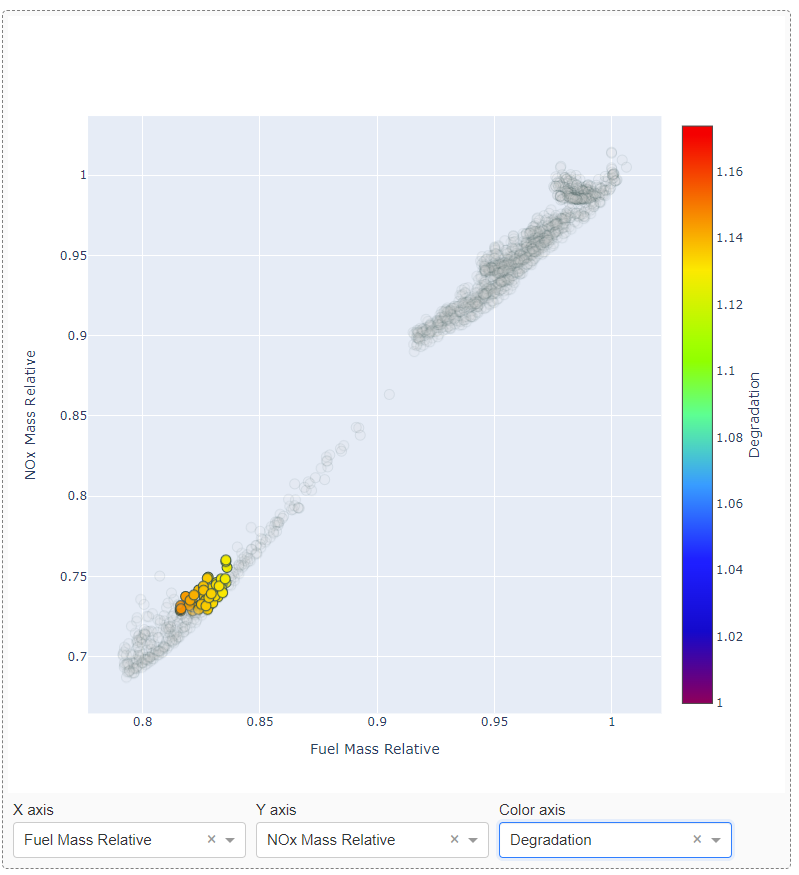
Example of propagated selections on a Scatter plot
An example dataset is available in this repository in the example folder.