demtemps
Installing Graphite and Grafana
I modified this guide for much of this. You will want to do this on a Linux machine. Technically it should be possible on Windows or Mac OS by using Docker, but I've always struggled to make those work well.
- Install Docker and Docker Compose. Docker is not strictly necessary, but it makes the next steps much simpler.
- Run
mkdir ~/grafana && cd ~/grafana. Copy the following YAML spec intodocker-compose.ymlin the folder you just made.
version: "3"
services:
  grafana:
    image: grafana/grafana
    container_name: grafana
    restart: always
    ports:
      - 3000:3000
    networks:
      - grafana-net
    volumes:
      - grafana-volume

  graphite:
    image: graphiteapp/graphite-statsd
    container_name: graphite
    restart: always
    ports:
      - 2003:2003
    networks:
      - grafana-net

networks:
  grafana-net:

volumes:
  grafana-volume:
external: true- Run
docker volume create --name=grafana-volume. - Run
docker-compose up -d. - Run
docker psand confirm that there are two containers with statusUp. - Navigate to
localhost:3000in a browser. Log in withadmin,admin. - Add Graphite as a data source. The URL should be
http://graphite:8080. You can't visit this URL in your browser becausehttp://graphiteonly resolves to graphite within the Docker environment. Neat! - Set your password to something more reasonable.
- Confirm that if you reboot your computer, Graphite and Grafana are automatically started. If not, it is probably because Docker is not automatically started, since the two services defined above have
restart: always.
Feeding data into Graphite
Official docs here. Graphite does not collect data for you. Instead, you have to send it data. Fortunately, this is not too tough. Send a newline-delimited message over TCP to port 2003 on your computer with the following form: metric_name value timestamp. metric_name can have periods to delimit namespace, for instance the scanning fridge's 3K temperature might be scanning.3K_temperature.
You can send the data using bash with code like this (from the docs). I had to do nc -q0 ${SERVER} ${PORT} or else it waited forever for more input.
PORT=2003
SERVER=graphite.your.org
echo "local.random.diceroll 4 `date +%s`" | nc ${SERVER} ${PORT}
The following python code will also do. You will want to handle exceptions.
import socket
import time

s = socket.socket(socket.AF_INET, socket.SOCK_STREAM)
# connect can fail. Catch the exception and gracefully handle it if necessary.
s.connect(('server.ip.here', 2003))
# send may not send all the data at once.
# See https://docs.python.org/3/howto/sockets.html for deets.
s.send(bytes(f'local.random.diceroll 4 {int(time.time())}\n'))
# Please close your sockets.
s.close()
Example data feeding
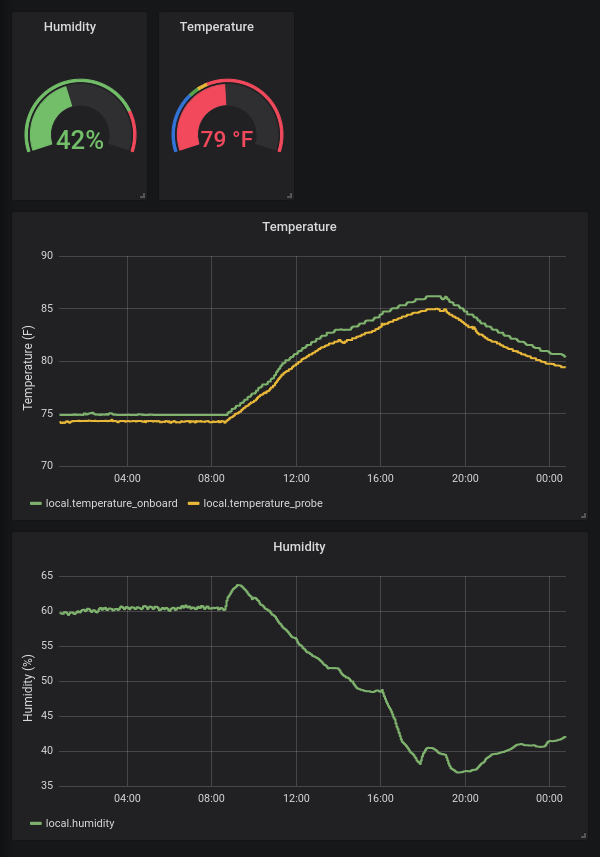
For example, on the graphite computer itself I have plugged in a temperature and humidity sensor. I can connect to the device using pyvisa and query its sensors, then print out data formatted in Graphite's style. The unmodified code is this, called get_temp_hum.py.
#!/usr/bin/env python3

import time
import visa

rm = visa.ResourceManager('@py')
inst = rm.open_resource('USB0::4883::33016::M00423437::0::INSTR')

temp_onboard = float(inst.query('SENS1:TEMP:DATA?').strip()) * 9/5 + 32
temp_probe   = float(inst.query('SENS3:TEMP:DATA?').strip()) * 9/5 + 32

hum  = float(inst.query('SENS2:HUM:DATA?').strip())
t    = int(time.time())

print(f'local.temperature_onboard {temp_onboard:.3f} {t}')
print(f'local.temperature_probe {temp_probe:.3f} {t}')
print(f'local.humidity {hum:.3f} {t}')
Then, I have a crontab that pipes this into netcat as above: * * * * * /home/dgglab/get_temp_hum.py | nc -q0 localhost 2003. The *s at the beginning means it runs every minute.
Next, I went onto Grafana, created a dashboard, and played around with settings to get this:
TODO
- Storage retention policies.
- Data backup.
- Firewall rules.
- HTTPS.
- More data feeds.
