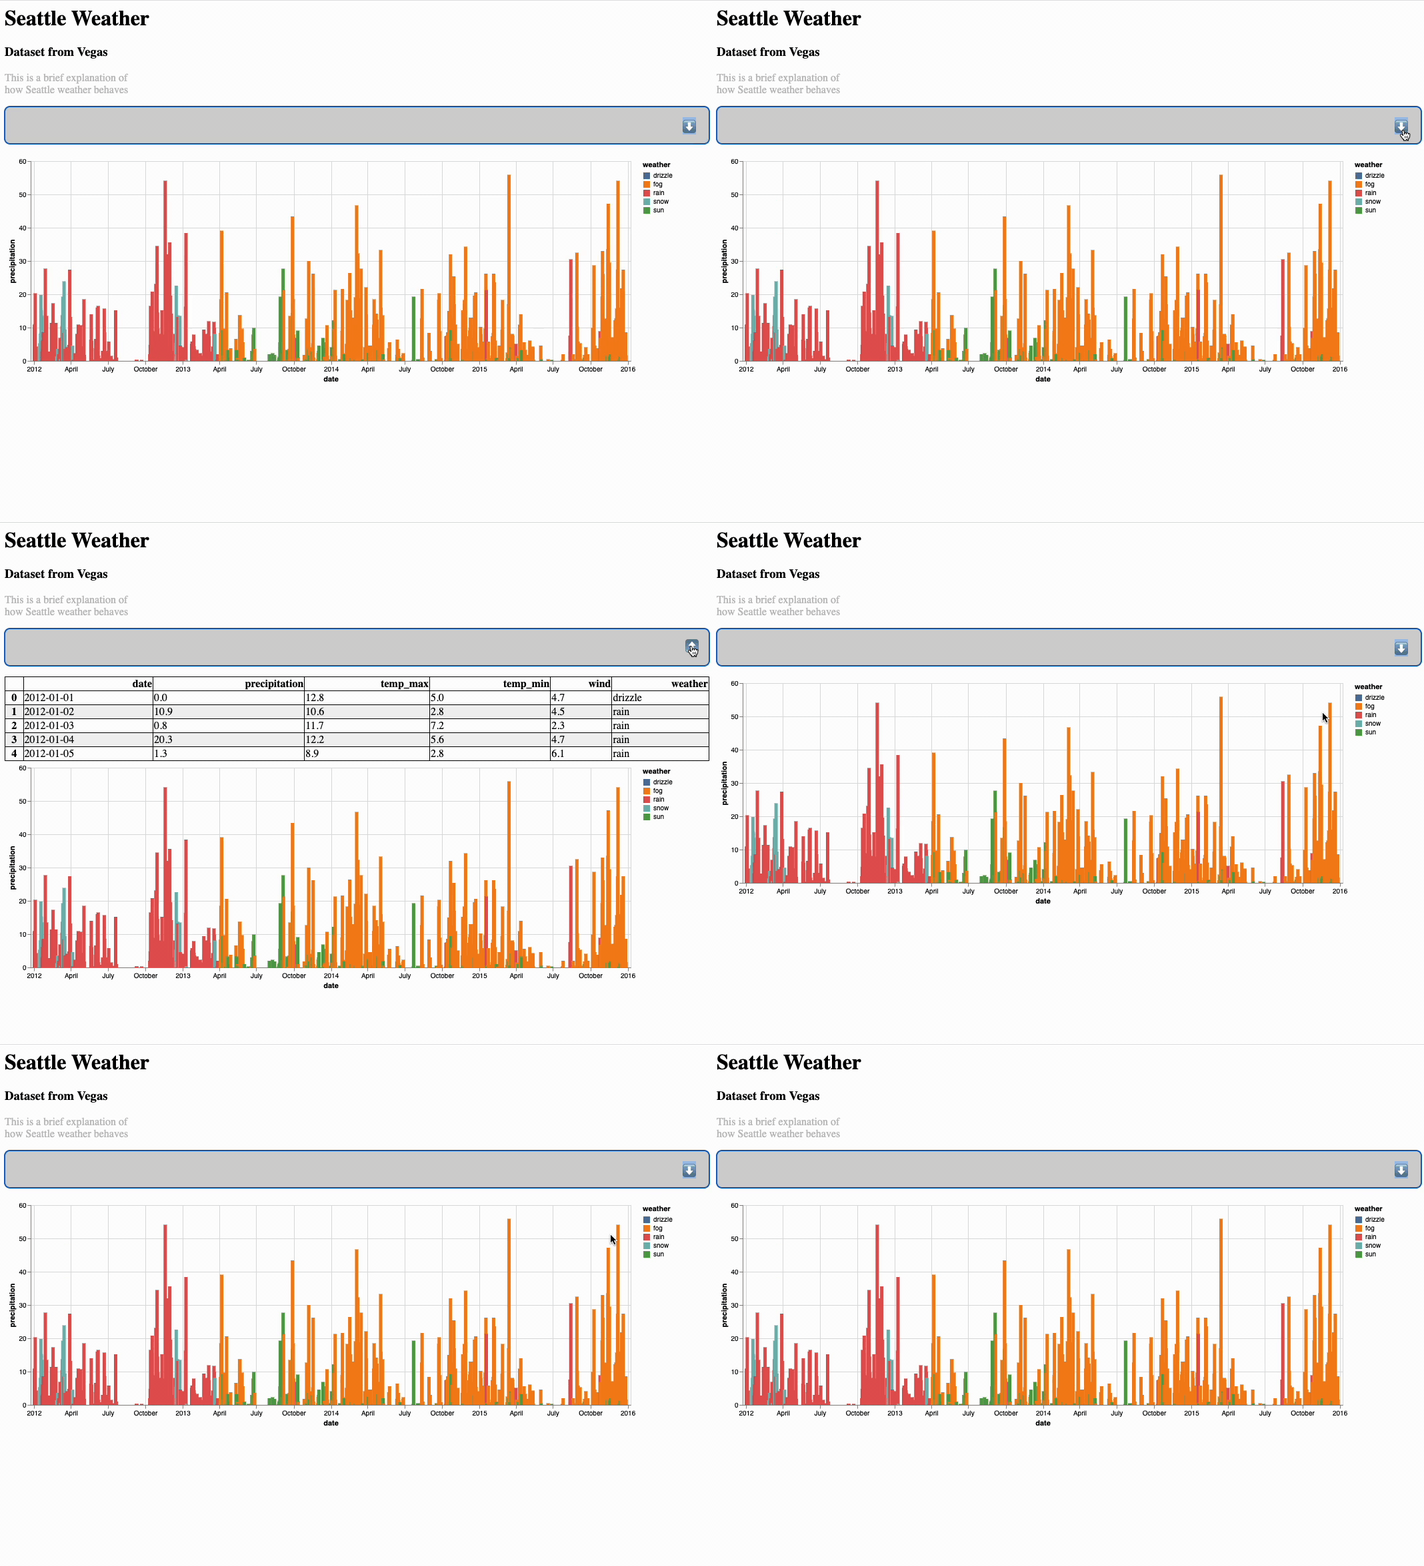
This library will allow Titles, Paragraphs, Dataframes and Altair Charts to be exported into a static HTML file.
You can access the PyPi project here
pip install st-static-export- add_header : Creates a H1-H4 title.
- export_dataframe : Creates a HTML table from your dataframe that can be optionally enclosed in an expander.
- add_text: Allows for a paragraph to be added to the HTML export.
- export_altair_graph: Embeds an Altair chart, including interactions and selections to your HTML file.
- create_html: composes final HTML file and returns a string or bytes.
import streamlit as st
import st_static_export as sse
import pandas as pd
import altair as alt

#This can be read from a separate file
css_text = """
table, th, td {
border: 1px solid black;
border-collapse: collapse;
}
tr:nth-child(even) {background-color: #f2f2f2;}
.table{
    width:100%;
}
.footn{
color:#c0c0c0;
}
"""
#Initialize StreamlitStaticExport

static_html = sse.StreamlitStaticExport(css=css_text)
static_html.add_header(id="title",text="Seattle Weather", size="H1" )
static_html.add_header(id="subtitle",text="Dataset from Vegas", size="H3" )
st.title("Seattle Weather")
html.add_text(id="explanation", text="""This is a brief explanation of \n how Seattle weather behaves""", text_class='footn')
df = local_data.seattle_weather()
st.dataframe(df)
html.export_dataframe(id="df", dataframe=df,inside_expandable=True, table_class='table')
base = alt.Chart(df).mark_bar().encode(
    x=alt.X('date', type='temporal'),
    y=alt.Y('precipitation', type='quantitative'),
    color = alt.Color('weather', type ='nominal')
)
st.altair_chart(base, use_container_width=True)

html.export_altair_graph(id="chart",html_content=base.properties(width=900))

#Return a string
str_result = html.create_html(return_type="String")
with open('sample.html', 'w') as b:
    b.write(str_result)

#Return Bytes to be attached to a button or other actions.
bt_result = html.create_html(return_type="Bytes")
with open('sample_bytes.html', 'wb') as b:
b.write(bt_result)- Support for plotly charts

