Go Module providing robust framework for running complex workload scenarios in isolation, using Go and Docker. For integration, e2e tests, benchmarks and more! 💪
- Ability to schedule isolated processes programmatically from single process on single machine.
- Focus on cluster workloads, cloud native services and microservices.
- Developer scenarios in mind e.g preserving scenario readability, Go unit test integration.
- Metric monitoring as the first citizen. Assert on Prometheus metric values during test scenarios or check overall performance characteristics.
There are three main use cases envisioned for this Go module:
- Unit test use (see example). Use
e2ein unit tests to quickly run complex test scenarios involving many container services. This was the main reason we created this module. You can check usage of it in Cortex and Thanos projects. - Standalone use (see example). Use
e2eto run setups in interactive mode where you spin up workloads as you want programmatically and poke with it on your own using your browser or other tools. No longer need to deploy full Kubernetes or external machines. - Benchmark use (see example). Use
e2ein local Go benchmarks when your code depends on external services with ease.
Let's go through an example leveraging go test flow:
-
Implement the workload by embedding
e2e.Runnableor*e2e.InstrumentedRunnable. Or you can use existing ones in e2edb package. For example implementing function that schedules Jaeger with our desired configuration could look like this:// Setup Jaeger for example purposes, on how easy is to setup tracing pipeline in e2e framework. j := e.Runnable("tracing"). WithPorts( map[string]int{ "http.front": 16686, "jaeger.thrift": 14268, }). Init(e2e.StartOptions{Image: "jaegertracing/all-in-one:1.25"})
-
Implement test. Start by creating environment. Currently
e2esupports Docker environment only. Use unique name for all your tests. It's recommended to keep it stable so resources are consistently cleaned.// Start isolated environment with given ref. e, err := e2e.NewDockerEnvironment("e2e_example") testutil.Ok(t, err) // Make sure resources (e.g docker containers, network, dir) are cleaned. t.Cleanup(e.Close)
-
Program your scenario as you want. You can start, wait for their readiness, stop, check their metrics and use their network endpoints from both unit test (
Endpoint) as well as within each workload (InternalEndpoint). You can also access workload directory. There is a shared directory across all workloads. CheckDirandInternalDirrunnable methods.// Create structs for Prometheus containers scraping itself. p1 := e2edb.NewPrometheus(e, "prometheus-1") s1 := e2edb.NewThanosSidecar(e, "sidecar-1", p1) p2 := e2edb.NewPrometheus(e, "prometheus-2") s2 := e2edb.NewThanosSidecar(e, "sidecar-2", p2) // Create Thanos Query container. We can point the peer network addresses of both Prometheus instance // using InternalEndpoint methods, even before they started. t1 := e2edb.NewThanosQuerier(e, "query-1", []string{s1.InternalEndpoint("grpc"), s2.InternalEndpoint("grpc")}) // Start them. testutil.Ok(t, e2e.StartAndWaitReady(p1, s1, p2, s2, t1)) // To ensure query should have access we can check its Prometheus metric using WaitSumMetrics method. Since the metric we are looking for // only appears after init, we add option to wait for it. testutil.Ok(t, t1.WaitSumMetricsWithOptions(e2e.Equals(2), []string{"thanos_store_nodes_grpc_connections"}, e2e.WaitMissingMetrics())) // To ensure Prometheus scraped already something ensure number of scrapes. testutil.Ok(t, p1.WaitSumMetrics(e2e.Greater(50), "prometheus_tsdb_head_samples_appended_total")) testutil.Ok(t, p2.WaitSumMetrics(e2e.Greater(50), "prometheus_tsdb_head_samples_appended_total")) // We can now query Thanos Querier directly from here, using it's host address thanks to Endpoint method. a, err := api.NewClient(api.Config{Address: "http://" + t1.Endpoint("http")}) testutil.Ok(t, err) { now := model.Now() v, w, err := v1.NewAPI(a).Query(context.Background(), "up{}", now.Time()) testutil.Ok(t, err) testutil.Equals(t, 0, len(w)) testutil.Equals( t, fmt.Sprintf(`up{instance="%v", job="myself", prometheus="prometheus-1"} => 1 @[%v] up{instance="%v", job="myself", prometheus="prometheus-2"} => 1 @[%v]`, p1.InternalEndpoint(e2edb.AccessPortName), now, p2.InternalEndpoint(e2edb.AccessPortName), now), v.String(), ) } // Stop first Prometheus and sidecar. testutil.Ok(t, s1.Stop()) testutil.Ok(t, p1.Stop()) // Wait a bit until Thanos drops connection to stopped Prometheus. testutil.Ok(t, t1.WaitSumMetricsWithOptions(e2e.Equals(1), []string{"thanos_store_nodes_grpc_connections"}, e2e.WaitMissingMetrics())) { now := model.Now() v, w, err := v1.NewAPI(a).Query(context.Background(), "up{}", now.Time()) testutil.Ok(t, err) testutil.Equals(t, 0, len(w)) testutil.Equals( t, fmt.Sprintf(`up{instance="%v", job="myself", prometheus="prometheus-2"} => 1 @[%v]`, p2.InternalEndpoint(e2edb.AccessPortName), now), v.String(), ) } }
Each instrumented workload have programmatic access to latest metrics with WaitSumMetricsWithOptions methods family. Yet, especially for standalone mode it's often useful to query and visualisate all metrics provided by your services/runnables using PromQL. In order to do so just start monitoring from e2emontioring package:
mon, err := e2emonitoring.Start(e)
if err != nil {
	return err
}
This will start Prometheus with automatic discovery for every new and old instrumented runnables being scraped. It also runs cadvisor that monitors docker itself if env.DockerEnvironment is started and show generic performance metrics per container (e.g container_memory_rss). Run OpenUserInterfaceInBrowser() to open Prometheus UI in browser.
	}
	// Open monitoring page with all metrics.
	if err := mon.OpenUserInterfaceInBrowser(); err != nil {
		return errors.Wrap(err, "open monitoring UI in browser")
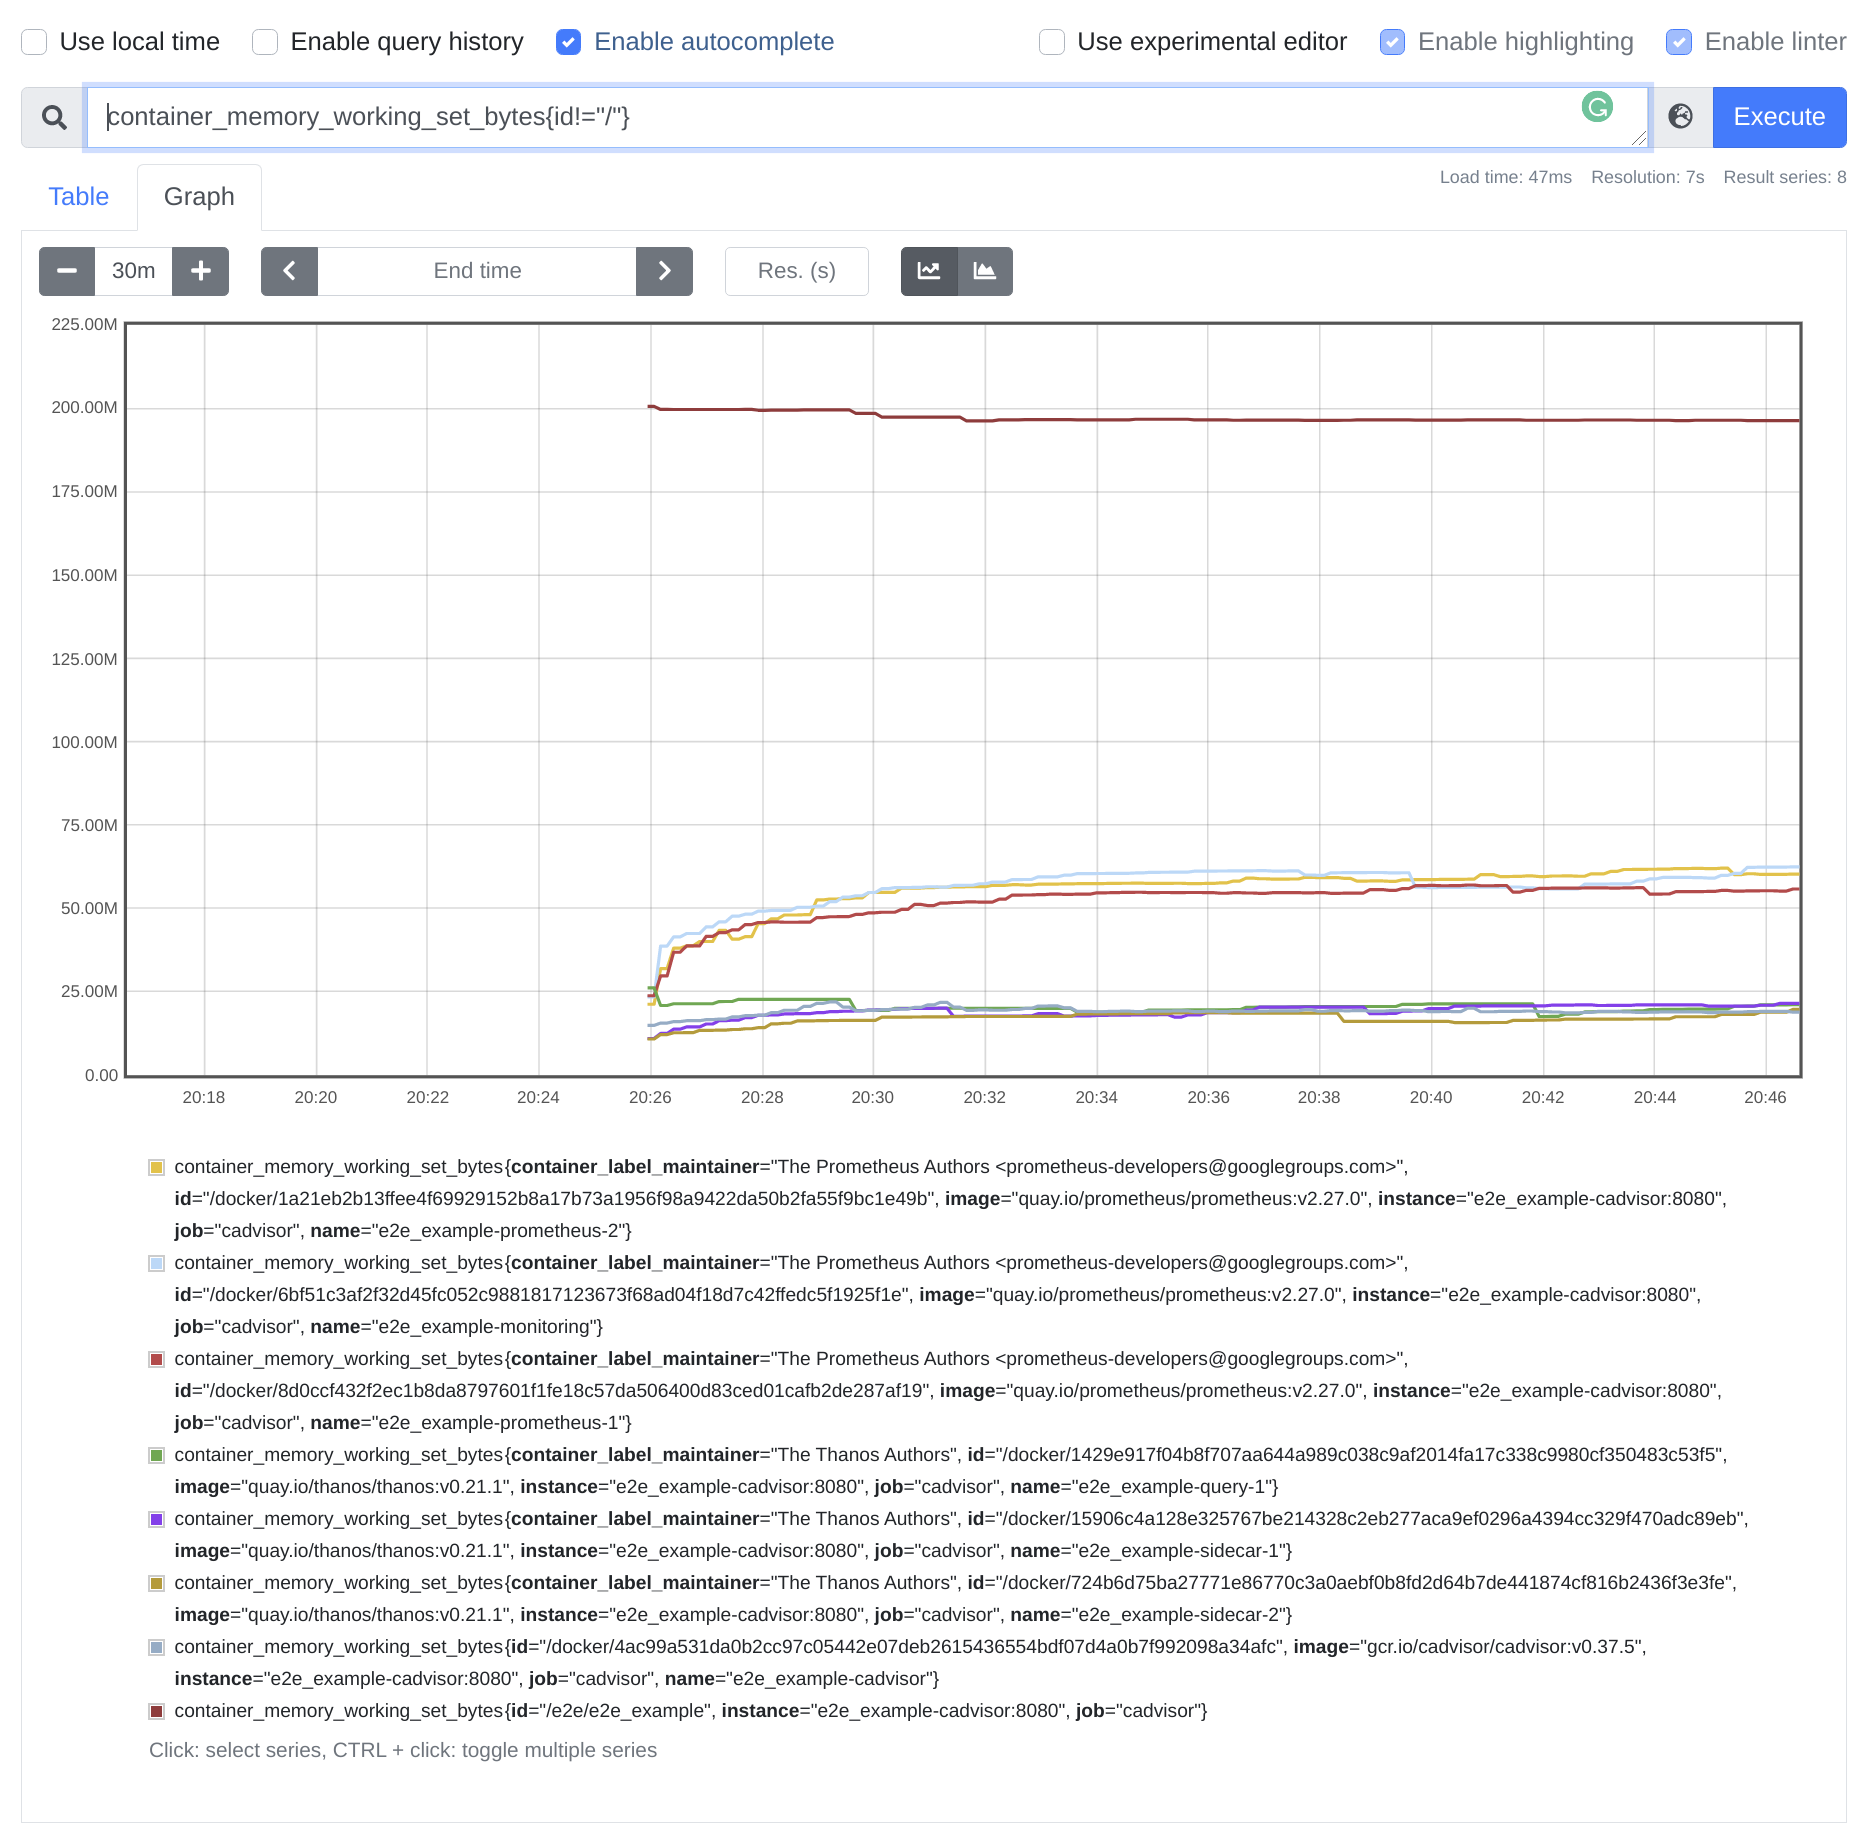
To see how it works in practice run our example code in standalone.go by running make run-example. At the end, three UIs should show in your browser. Thanos one, monitoring (Prometheus) one and tracing (Jaeger) one. In monitoring UI you can then e.g query docker container metrics using container_memory_working_set_bytes{id!="/"} metric e.g:
NOTE: Due to cgroup modifications and using advanced docker features, this might behave different on non Linux platforms. Let us know in the issue if you encounter any issue on Mac or Windows and help us to add support for those operating systems!
It's common pattern that you want to schedule some containers but also, you might want to run some expensive code inside e2e once integration components are running. In order to learn more about performance of existing process run e2emonitoring.Start with extra parameter:
	// NOTE: This will error out on first run, demanding to setup permissions for cgroups.
	// Remove `WithCurrentProcessAsContainer` to avoid that. This will also descope monitoring current process itself
	// and focus on scheduled containers only.
	mon, err := e2emonitoring.Start(e, e2emonitoring.WithCurrentProcessAsContainer())
	if err != nil {
		return err
	}
This will put current process in cgroup which allows cadvisor to watch it as it was container.
NOTE: This step requires manual step. The step is a command that is printed on first invocation of e2e with above command and should tell you what command should be invoked.
- Initial Authors: @pracucci, @bwplotka, @pstibrany
- Cortex Team hosting previous form of this module initially.

