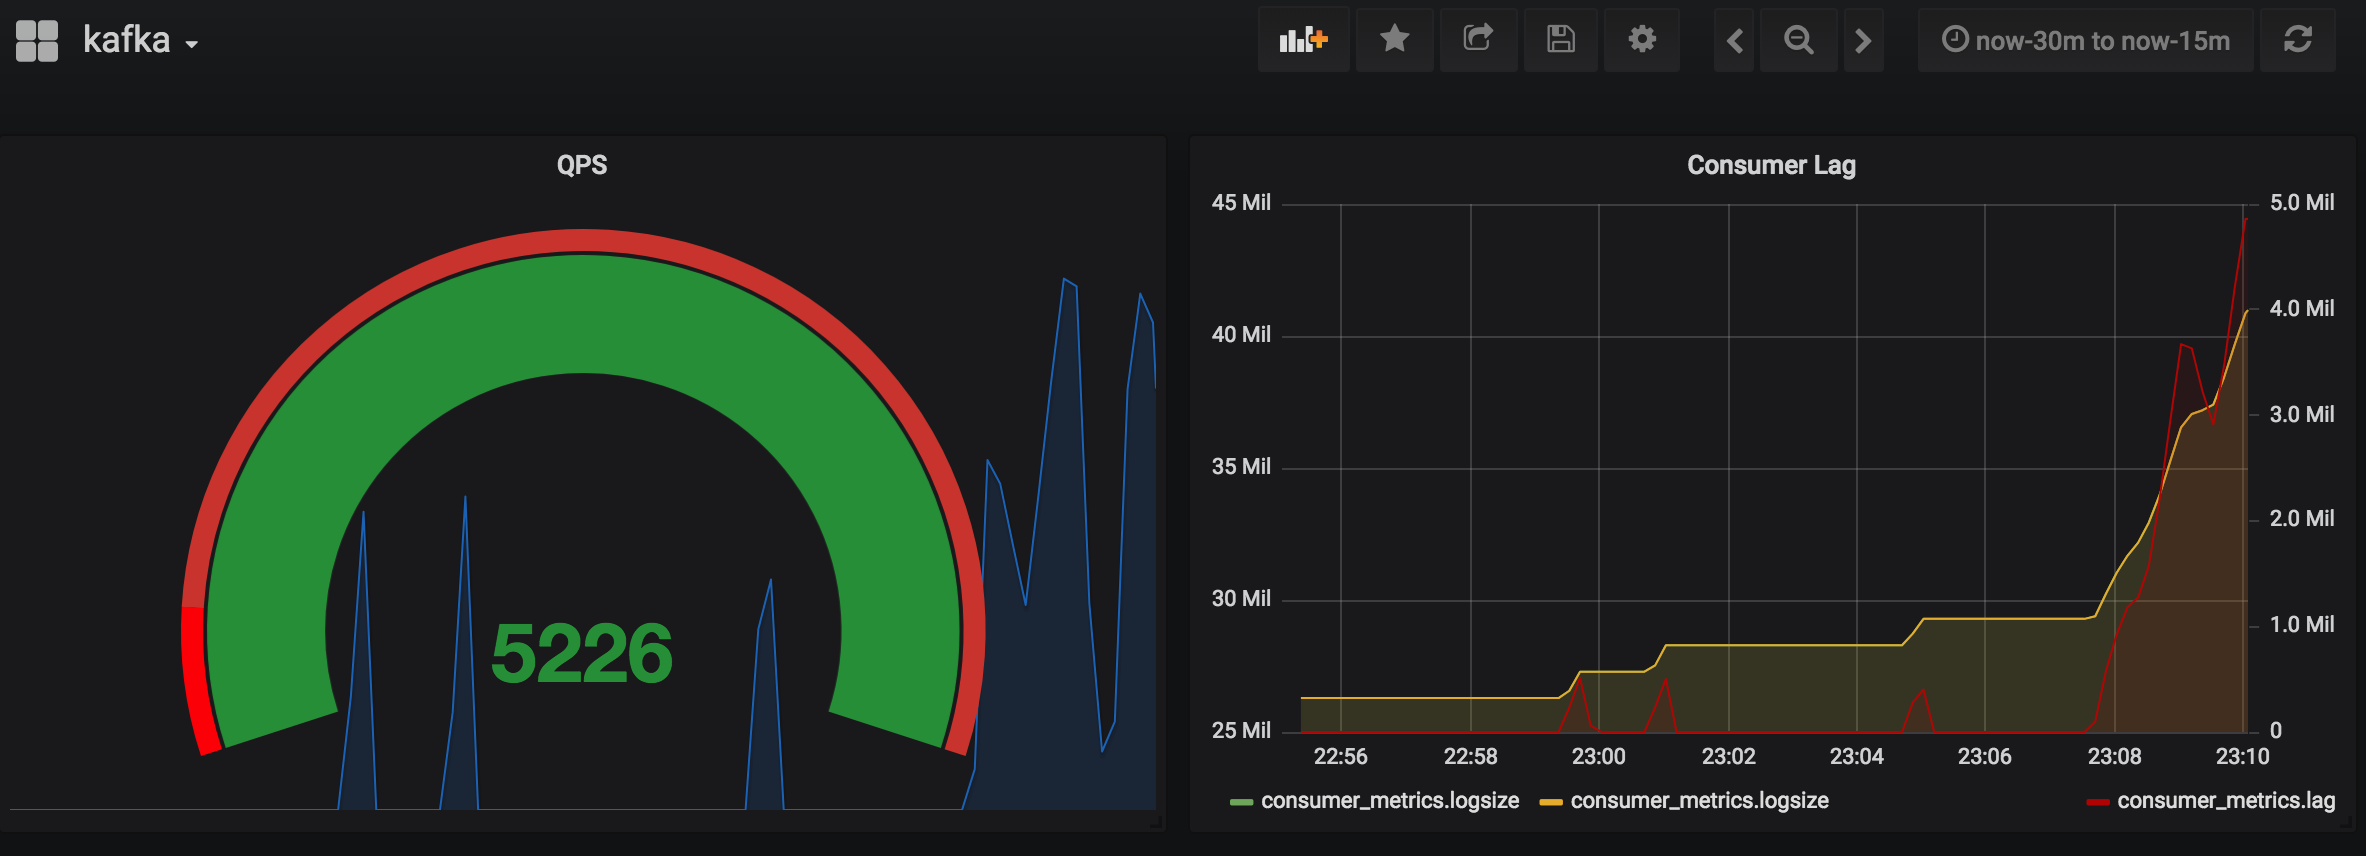
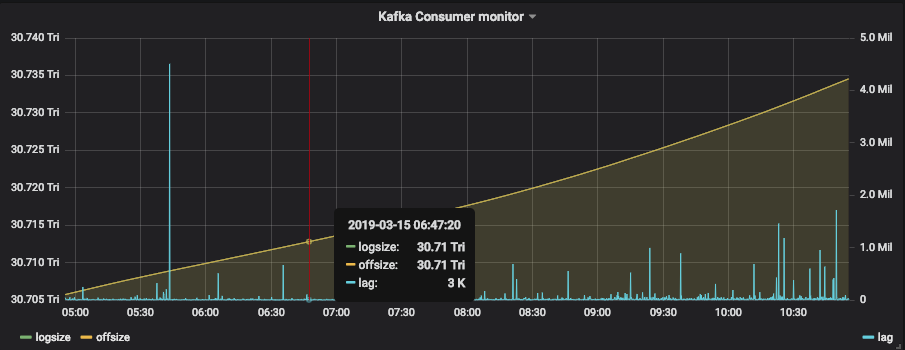
A simple, lightweight kafka offset monitor, currently metrics stored by influxdb. Motivated by Burrow, but much faster and cleaner and more stable. burrowx is good integration with influxdb and grafana.
-
By release binary
Just click the release links
-
By source build
$ go get github.com/sundy-li/burrowx
$ cd $GOPATH/src/github.com/sundy-li/burrowx
$ go build && go install## new workspace for burrowx
mkdir -p /data/app/burrowx
## cd to the workspace
cd /data/app/burrowx
## cp the files to here
cp $GOPATH/bin/burrowx ./
cp -rf $GOPATH/src/github.com/sundy-li/burrowx/config ./
## you should create the burrowx database in influxdb manually
## then modify server.json file config and run it
./burrowxA Docker file is available which builds this project on top of an Alpine Linux image.
- Create your desired configuration files (server.yaml, logging.xml)
- Run
docker build -t burrowx .It will include the server.yaml and logging.xml and automatically start service. - Run the container on your favourite container platform
-
Create a new test topic
bin/kafka-topics.sh --create --zookeeper localhost:2181 --replication-factor 1 --partitions 8 --topic test_burrowx_topic -
Produce the data to the topic
for i in `seq 1 10000`;do echo "33" | bin/kafka-console-producer.sh --topic test_burrowx_topic --broker-list localhost:9092 ; sleep 1; done -
Create a consumer to consume the data
$ pip install kafkafrom kafka import KafkaConsumer consumer = KafkaConsumer('test_burrowx_topic', group_id='my_group2') for msg in consumer: print(msg) print("end")
Then you will find the data in the influxdb database burrowx .
cluster: cluster nametopic: topic nameconsumer_group: group namepartition: partition idlogsize: partition logsizeoffsize: partition consumer offsizelag: partition consumer log
SELECT sum("logsize") FROM "consumer_metrics" WHERE ("cluster" = 'your_cluster' AND "topic" = 'your_topic' AND "consumer_group" = 'your_consumer') AND $timeFilter  GROUP BY time(10s)

SELECT sum("offsize") FROM "consumer_metrics" WHERE ("cluster" = 'your_cluster' AND "topic" = 'your_topic' AND "consumer_group" = 'your_consumer') AND $timeFilter  GROUP BY time(10s)

SELECT sum("lag") FROM "consumer_metrics" WHERE ("cluster" = 'your_cluster' AND "topic" = 'your_topic' AND "consumer_group" = 'your_consumer') AND $timeFilter  GROUP BY time(10s)
- Light weight and extremely simple to use, metrics are stored in influxdb, and could be easily viewed on grafana
- Only support kafka version >= 0.9.X, which stores the consumer offsets in the topic
__consumer_offsets,if you are using kafka 0.8.X, try my previous repohttps://github.com/shunfei/Dcmonitor

