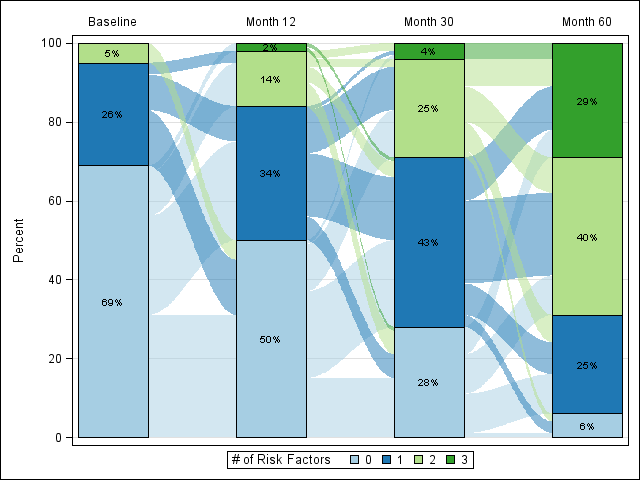
This repository contains a set of SAS macros for creating longitudinal bar charts with Sankey-style overlays.
A quick overview of the macro is available at the wiki.
This macro was originally published as part of a PharmaSUG 2015 paper by Shane Rosanbalm titled Getting Sankey with Bar Charts. At the SESUG 2016 conference Yichen Zhong presented a follow-up paper titled Sankey Diagram with Incomplete Data – From a Medical Research Perspective. In this second paper several enhancements to the original macro are suggested. Many of these updates were incorporated into version 2.0 of the macro. Many thanks to Yichen for the valuable suggestions.
