This repository is the implementation of the project "Document Clustering, Summarization and Visualization". For this project we perform document clustering, summarization and draw out insightful visualization for 20 News group dataset.
We use 20 Newsgroups data for the implementaion. The same data could be found in sklearn as well, this data is saved as 20newsdata.csv.
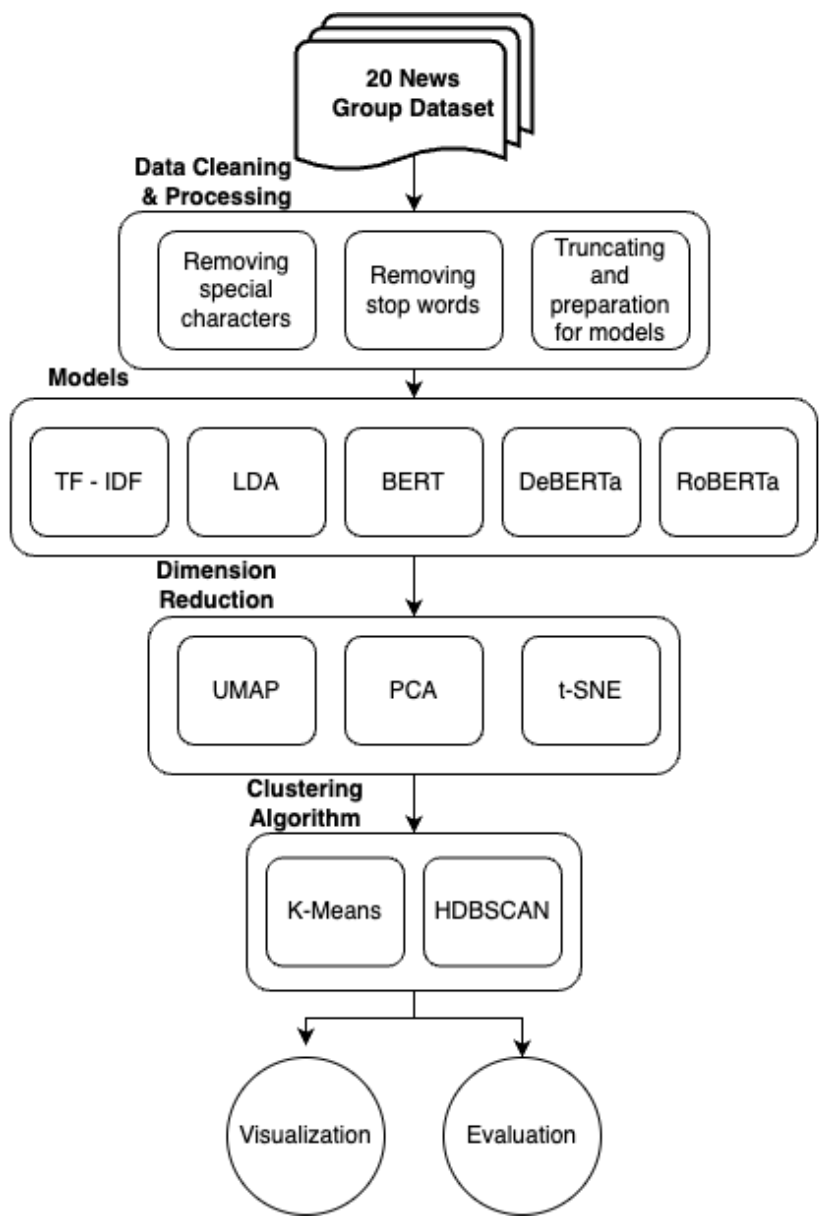
Following figure demonstrates the complete architecture and experiments for custering the documents.
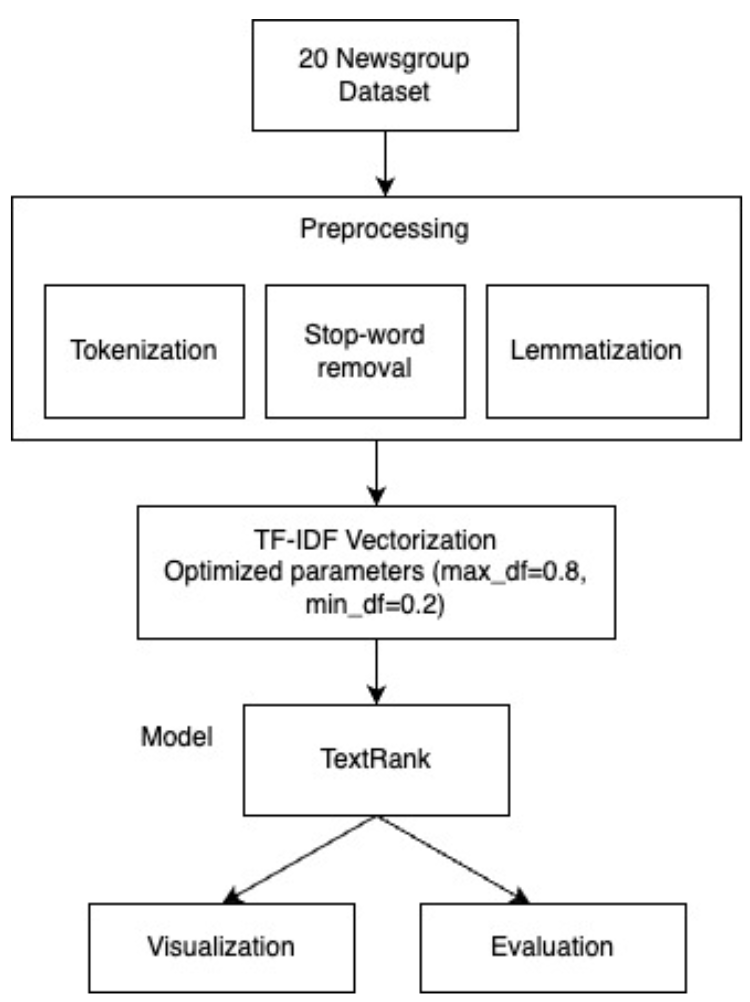
Below figure demonstrates the architectureand experiments involved in abstractive and extractive summarization.
| RAW | UMAP | PCA | t-SNE | |
|---|---|---|---|---|
| Silhouette Score | 0.05 | 0.468 | 0.406 | 0.32 |
| Davies Bouldin | 3.68 | 0.74 | 0.77 | 0.85 |
| Calinski harabasz | 168.51 | 30561.54 | 13235.05 | 12130.29 |
Additional evauluatons can be found in clustering notebook.
| ROUGE 1 | Precision | Recall | F-measure |
|---|---|---|---|
| PEGASUS | 0.47 | 0.07 | 0.13 |
| GPT2 | 0.29 | 0.31 | 0.299 |
All visualizations can be found in respective notebooks: clustering notebook, summarization
- 20 newsgroups. Home Page for 20 Newsgroups Data Set. (n.d.).
- Karmakar, Saurav, "Syntactic and Semantic Analysis and Visualization of Unstructured English Texts." Dissertation, Georgia State University, 2011.
- Kim, SW., Gil, JM. Research paper classification systems based on TF-IDF and LDA schemes. Hum. Cent. Comput. Inf. Sci. 9, 30 (2019).
- S. Zaware, D. Patadiya, A. Gaikwad, S. Gulhane and A. Thakare, "Text Summarization using TF-IDF and Textrank algorithm," 2021 5th International Conference on Trends in Electronics and Informatics (ICOEI), Tirunelveli, India, 2021, pp. 1399-1407.
- Kapadia, S. (2022, December 23). Topic modeling in Python: Latent dirichlet allocation (LDA). Medium
- Pegasus: Pre-training with extracted gap-sentences for abstractive ... (n.d.).
- Devlin, J., Chang, M.-W., Lee, K., & Toutanova, K. (2019, May 24). Bert: Pre-training of deep bidirectional Transformers for language understanding. arXiv.org.
- Ghantiwala, Alifia. “Using Word Clouds and N-grams to Visualize Text Data.” Medium, 16 Apr. 2022, Accessed 9 Oct. 2023.
- Eckerson, Wayne. “Using Treemaps to Visualize Data.” Data Plus Science, 5 Jan. 2016,
- Subakti, A., Murfi, H. & Hariadi, N. The performance of BERT as data representation of text clustering. J Big Data 9, 15 (2022).
- Bert - Hugging face. BERT. (n.d.)
- Grootendorst, M. P. (n.d.). BERTopic.
- Clustering with scikit-learn: A tutorial on unsupervised learning. KDnuggets. (n.d.).

